0423
MR imaging of neuromelanin-iron cluster within human postmortem substantia nigra1Department of Biomedical Engineering, Ulsan National Institute of Science and Technology, Ulsan, Republic of Korea, 2Department of Anatomy, Pusan National University School of Medicine, Yangsan, Republic of Korea, 3Department of Electrical and Computer Engineering, Ulsan National Institute of Science and Technology, Ulsan, Republic of Korea, 4Department of Neurology, Pusan National University Yangsan Hospital, Yangsan, Republic of Korea
Synopsis
The overall goal of this work was to provide a truth of neuromelanin-sensitive T1 weighted image with magnetization transfer effects and to segment the respective distribution of neuromelanin-iron complex and ferric iron within substantia nigra which are important to monitor Parkinson’s disease. Postmortem MR experiment at 7T and histological validation were performed for six normal midbrain samples. The correlation between T2*/T2 and neuromelanin pigments was highest compared to other MR parameters, especially compared to T2*, which shows specific distributions of paramagnetic molecules. Iron deposits were highly correlated with iron-sensitive T2 and T2* and the correlation was reduced for T2*/T2.
Purpose
Neuromelanin (NM) is a dark pigment which chelates iron in dopaminergic neurons of human substantia nigra (SN).1 Parkinson's disease (PD) is a major progressive nervous system disorder associated with the increase of ferric iron deposition and the loss of dopaminergic neurons.2 To define the distribution of paramagnetic molecules such as NM-iron complex and ferric iron in SN is meaningful to examine PD progression. Several studies have reported T1 weighted image with magnetization transfer (MT) effects provides NM-sensitive MR contrast.3 However, both NM-iron complex and ferric iron are paramagnetic molecules due to the load of highly concentrated iron on NM for preventing oxidative stress to the tissue.4 They cause the variation of magnetic field and affect T2 and T2* values.5 T2 and T2* values were also influenced by both concentration and practical size difference of the magnetic sources.5 The aim of this study was to specifically clarify the respective visualization of NM-iron complex and ferric iron within SN by combining MR relaxation times, T2 and T2*.Methods
The midbrain pieces including SN were extracted from elderly individuals without any diagnosis of neurodegenerative diseases. The study design for postmortem experiments was approved by the appropriate ethics review boards. The postmortem MR experiments were conducted at the preclinical 7T MRI system (Bruker, Germany). The formalin fixed samples were scanned for the T1 weighted image with and without MT effects, T1 map, T2 map, T2* map, QSM, and SWI. T1 weighted image with MT effects was acquired by multi slice RARE sequence with and without MT pulses, which are two sequential sinc pulses of 1 kHz off-resonance and 600 ̊ flip angle. T1, T2, and T2* maps were reconstructed using non-linear least-square fit on the RAREVTR, MSME, and MGE signals. T2*/T2 values were acquired voxel by voxel. QSM and SWI were generated using both magnitude and phase data of the MGE signal. After ex vivo MR experiments, the midbrain pieces were cryoprotected in sucrose solution. The samples were sectioned to 50 μm-thick slices according to the corresponding T1 weighted images. The slices were stained with Perls' Prussian blue staining for ferric iron and Luxol fast blue (LFB) staining for myelin. Binary images of NM and iron were detected from Perls’ Prussian blue staining. The binary image of myelin was detected by LFB staining. The Pearson’s correlation coefficients were calculated from iron density and NM density with MR parameters.Results
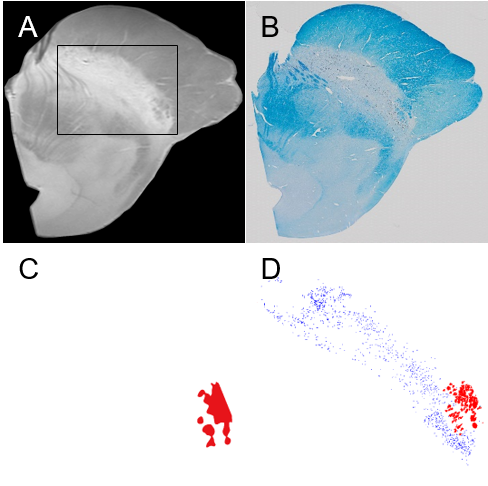
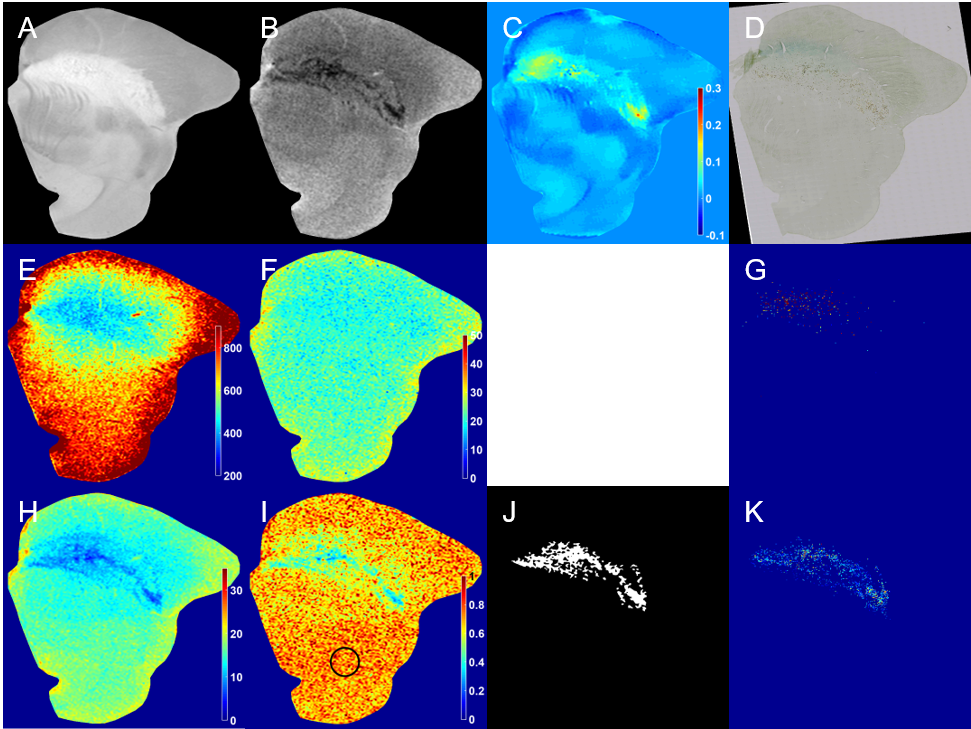
The hypointense region in T1 weighted image with MT effects was closely linked to the myelin distribution of LFB staining which was validated in Figure 1. NM-iron complex and ferric iron, which are paramagnetic molecules in SN detected from Perls’ Prussian blue staining (Figure 2D), contributed to T2* shortening with their spatially overlapped distributions. T2 map (Figure 2F) presented the distribution of ferric iron without that of NM. The effect of iron on T2* map (Figure 2H) was significantly reduced in T2*/T2 map (Figure 2I) only leaving the effect of NM-iron complex. The paramagnetic property of NM by iron chelation and the diamagnetic property of myelin were demonstrated by QSM (Figure 2C). The table for Pearson’s correlation coefficients (Table 1) showed NM pigments were highly correlated with T2* than T1 and T2. And iron deposits were sensitive to T2 and T2* than T1. The T2*/T2 showed the highest correlation coefficient with NM pigments than other MR parameters.Discussion
T1 weighted imaging with MT effects was performed to delineate NM distribution. T1 weighted image with MT effects and LFB staining showed that the hypointense region was significantly matched with the myelinated region. The hyperintense area in T1 weighted image with MT effects represented the non-myelinated region. Because NM and myelin were not colocalized, the hyperintense area in T1 weighted image may indirectly correlate with NM distribution. As the MT effect has been used to measure myelin content, our results were consistent with previous works.6 The distributions of paramagnetic ferric iron and NM-iron complex were identified in usual T2* map with overlapping when the T2* map was compared to the detected NM pigments and iron deposits, respectively. Furthermore, the region of low T2*/T2 values was mostly associated with NM distribution. The change of correlation coefficients from T2* to T2*/T2 was higher for the density of NM pigments but lower for the density of ferric iron deposits due to their effective size difference. Therefore, the segmented region of NM-iron complex from T2*/T2 map and ferric iron from T2 map can be obtained with the boundary of the SN decided from the T1 weighted image.Acknowledgements
This work was supported by the National Research Foundation of Korea under Grant No. 2017R1A1A1A05001062, which is funded by the Korean Government. This work was also supported by the 2017 Research Fund (1.170017.01) of the Ulsan National Institute of Science and Technology (UNIST).References
1. Zucca FA, Segura-Aguilar J, Ferrari E, Muñoz P, Paris I, Sulzer D, Sarna T, Casella L, and Zecca L, “Interactions of iron, dopamine and neuromelanin pathways in brain aging and Parkinson's disease”. Progress in neurobiology, 155, 96-119. (2017).
2. Damier P, Hirsch EC, Agid Y, and Graybiel AM, “The substantia nigra of the human brain”. Brain, 122(8), 1421-1436. (1999).
3. Sasaki M, Shibata E, Kudo K, and Tohyama K, “Neuromelanin-sensitive MRI”. Clinical Neuroradiology, 18(3), 147-153. (2008).
4. Enochs WS, Petherick P, Bogdanova A, Mohr U, and Weissleder R, “Paramagnetic metal scavenging by melanin: MR imaging”. Radiology, 204(2), 417-423. (1997).
5. Hardy PA, and Henkelman RM, “Transverse relaxation rate enhancement caused by magnetic particulates”. Magnetic resonance imaging, 7(3), 265-275. (1989).
6. Schmierer K, Scaravilli F, Altmann DR, Barker GJ, and Miller DH, “Magnetization transfer ratio and myelin in postmortem multiple sclerosis brain”. Annals of neurology, 56(3), 407-415. (2004).
Figures