0421
Early Stage Parkinson’s Disease Shows Changes in Energy and Period Content of Resting-State Networks1Cleveland Clinic Lou Ruvo Center for Brain Health, Las Vegas, NV, United States, 2University of Colorado, Boulder, CO, United States, 3University of Management & Technology, Lahore, Pakistan
Synopsis
Low-frequency BOLD fluctuations of major resting-state networks in early Parkinson’s disease (PD) were studied and compared with matched normal controls. Empirical Mode Decomposition (EMD) was used to decompose the natural occurring frequency bands of major brain resting-state networks. The novelty of our approach lies in the data-adaptive decomposition of fMRI data using EMD, and identification of resting-state networks based on energy and period (inverse frequency) characteristics of intrinsic mode functions. For most networks studied that showed a large effect size, the frequency content of the associated network time series was found to be significantly reduced in PD.
Introduction
Previous neuroimaging studies of Parkinson’s disease (PD) patients have shown that whole-brain functional networks such as the default mode network (DMN) and networks involving the motor pathway are affected, leading to different functional connectivity when compared to normal controls (NC)1. Other studies of the temporal characteristics of these brain networks have also shown abnormal spontaneous low-frequency content in PD2. However, it is not clear if changes in resting-state networks already appear in the very early stages (first 3 years) in unmedicated patients with PD. The purpose of this study is to examine early-stage PD to characterize the fluctuations of the major resting-state brain networks in more detail by using Empirical Mode Decomposition (EMD). EMD is a data driven-method that partitions a time series into naturally occurring intrinsic mode functions (IMFs) where each IMF occupies a characteristic frequency band3. To investigate differences in the time signatures of resting-state networks in PD vs NC, we compare energy and period information for IMFs.Methods
Functional MRI resting-state data (3T Siemens, TR/TE/Flip Angle/Resolution=2.4s/25ms/80deg/3.3mm isotropic, 40 axial slices, 210 time frames) were obtained for 18 PD (10 males; 57.1±11.6 years, UPDRS-III scores: 14.6±7.9; duration of the disease: 1.0±1.1 years) and 18 matched NC (14 males; 64.2±9.8 years) from the Parkinson’s Progression Markers Initiative (PPMI)4. After the usual preprocessing steps, all voxels were resampled to a 2mm x 2mm x 2mm grid. Group ICA (based on the FastICA algorithm5) was performed by stacking all data in the temporal domain to obtain 30 resting-state networks. Spatial regression was used on the networks of the group time series data to obtain the time series signatures for NC and PD. The network time signatures were further decomposed by EMD to compute the first 5 IMFs for each network. For each IMF determined, the average instantaneous energy, period, and their standard deviations were compared for NC vs PD.Results
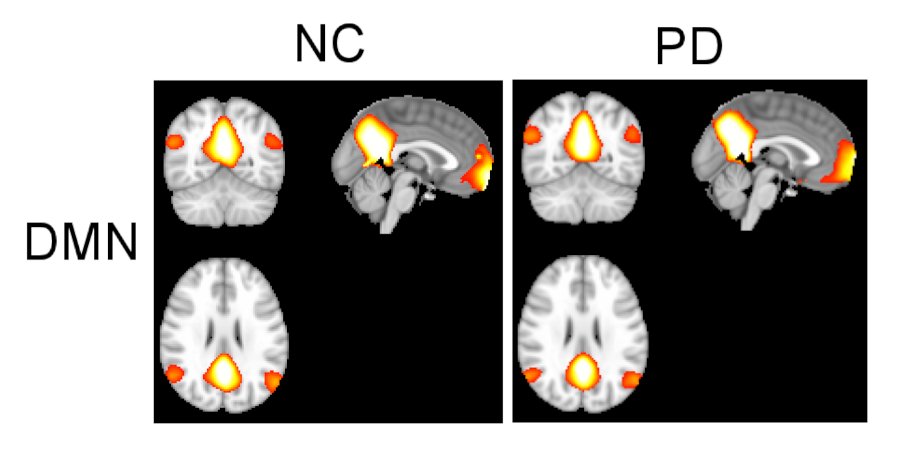
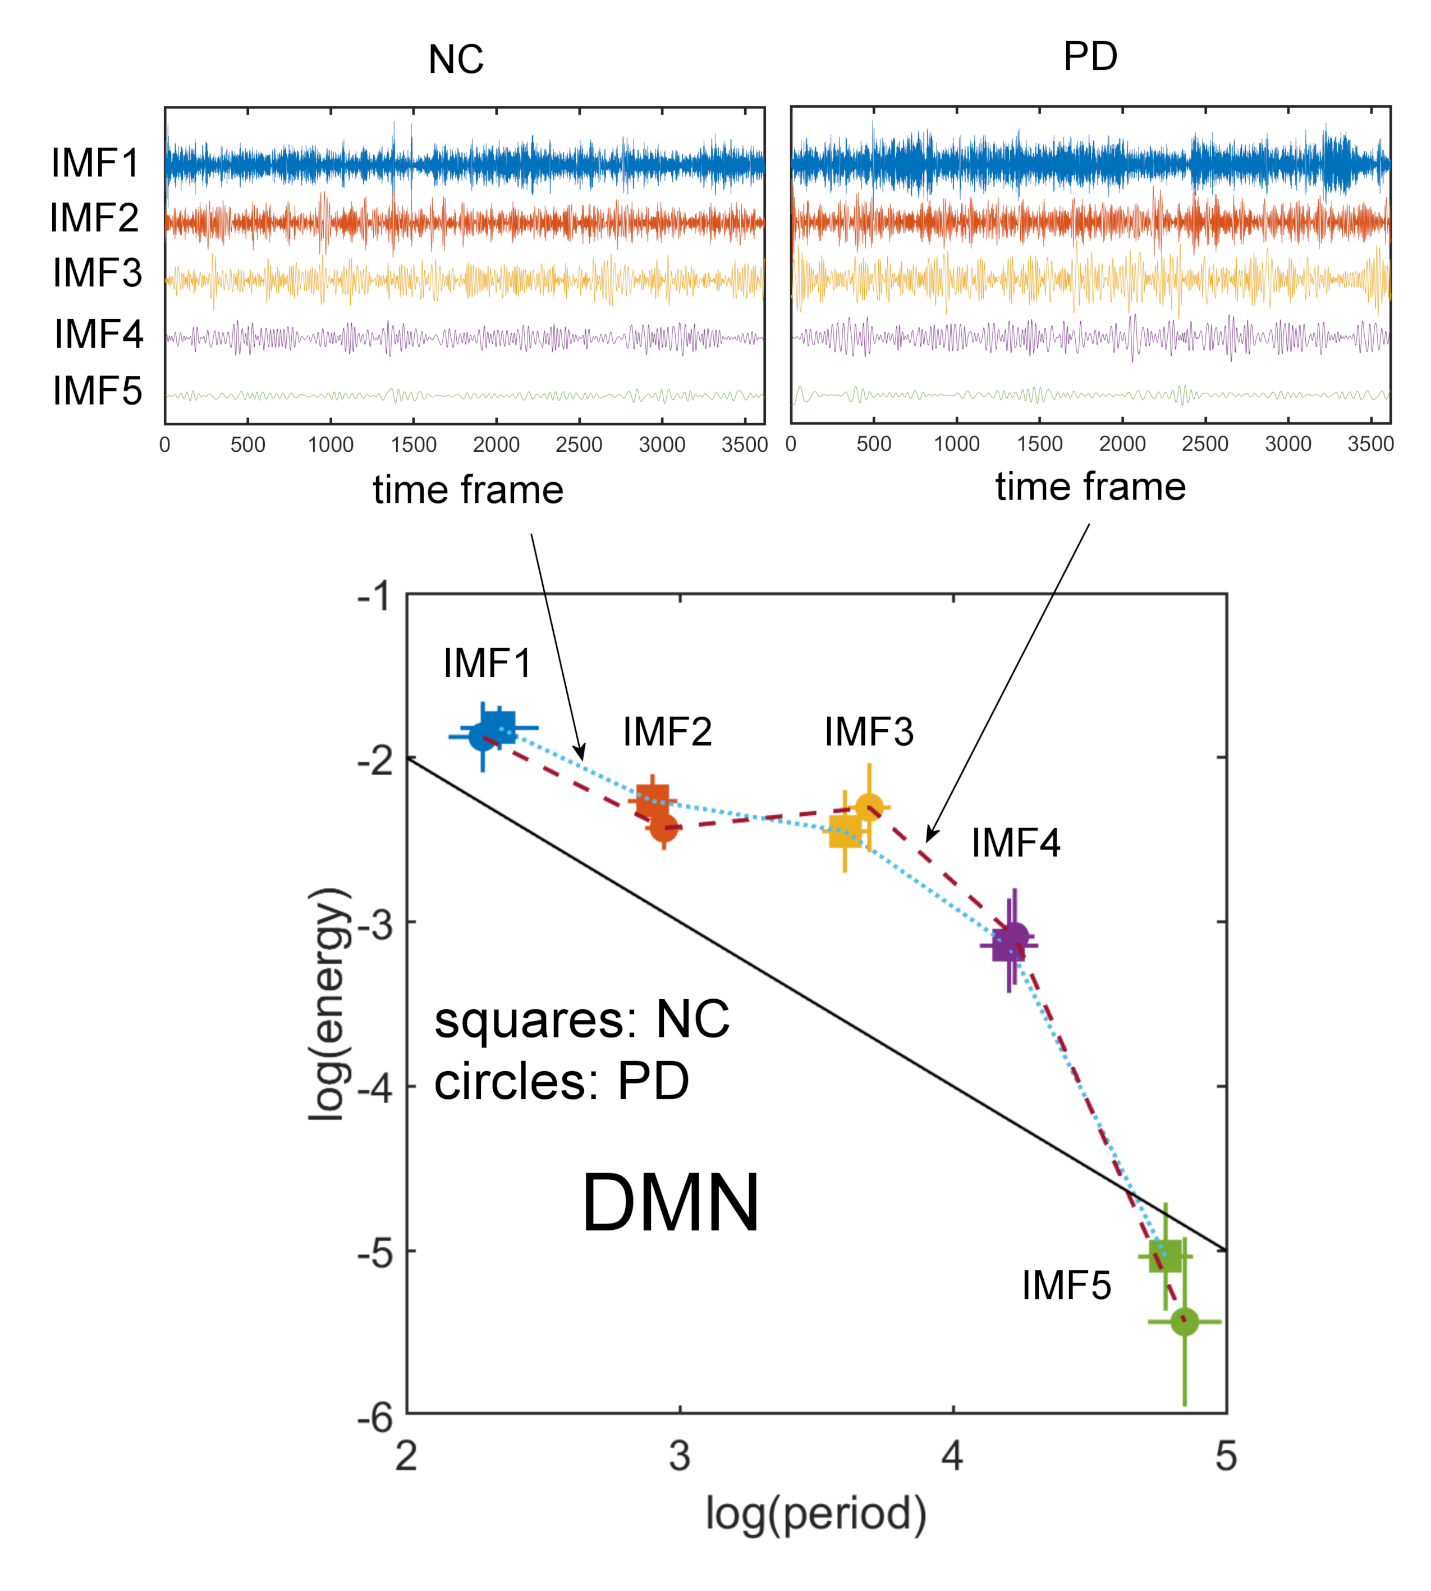
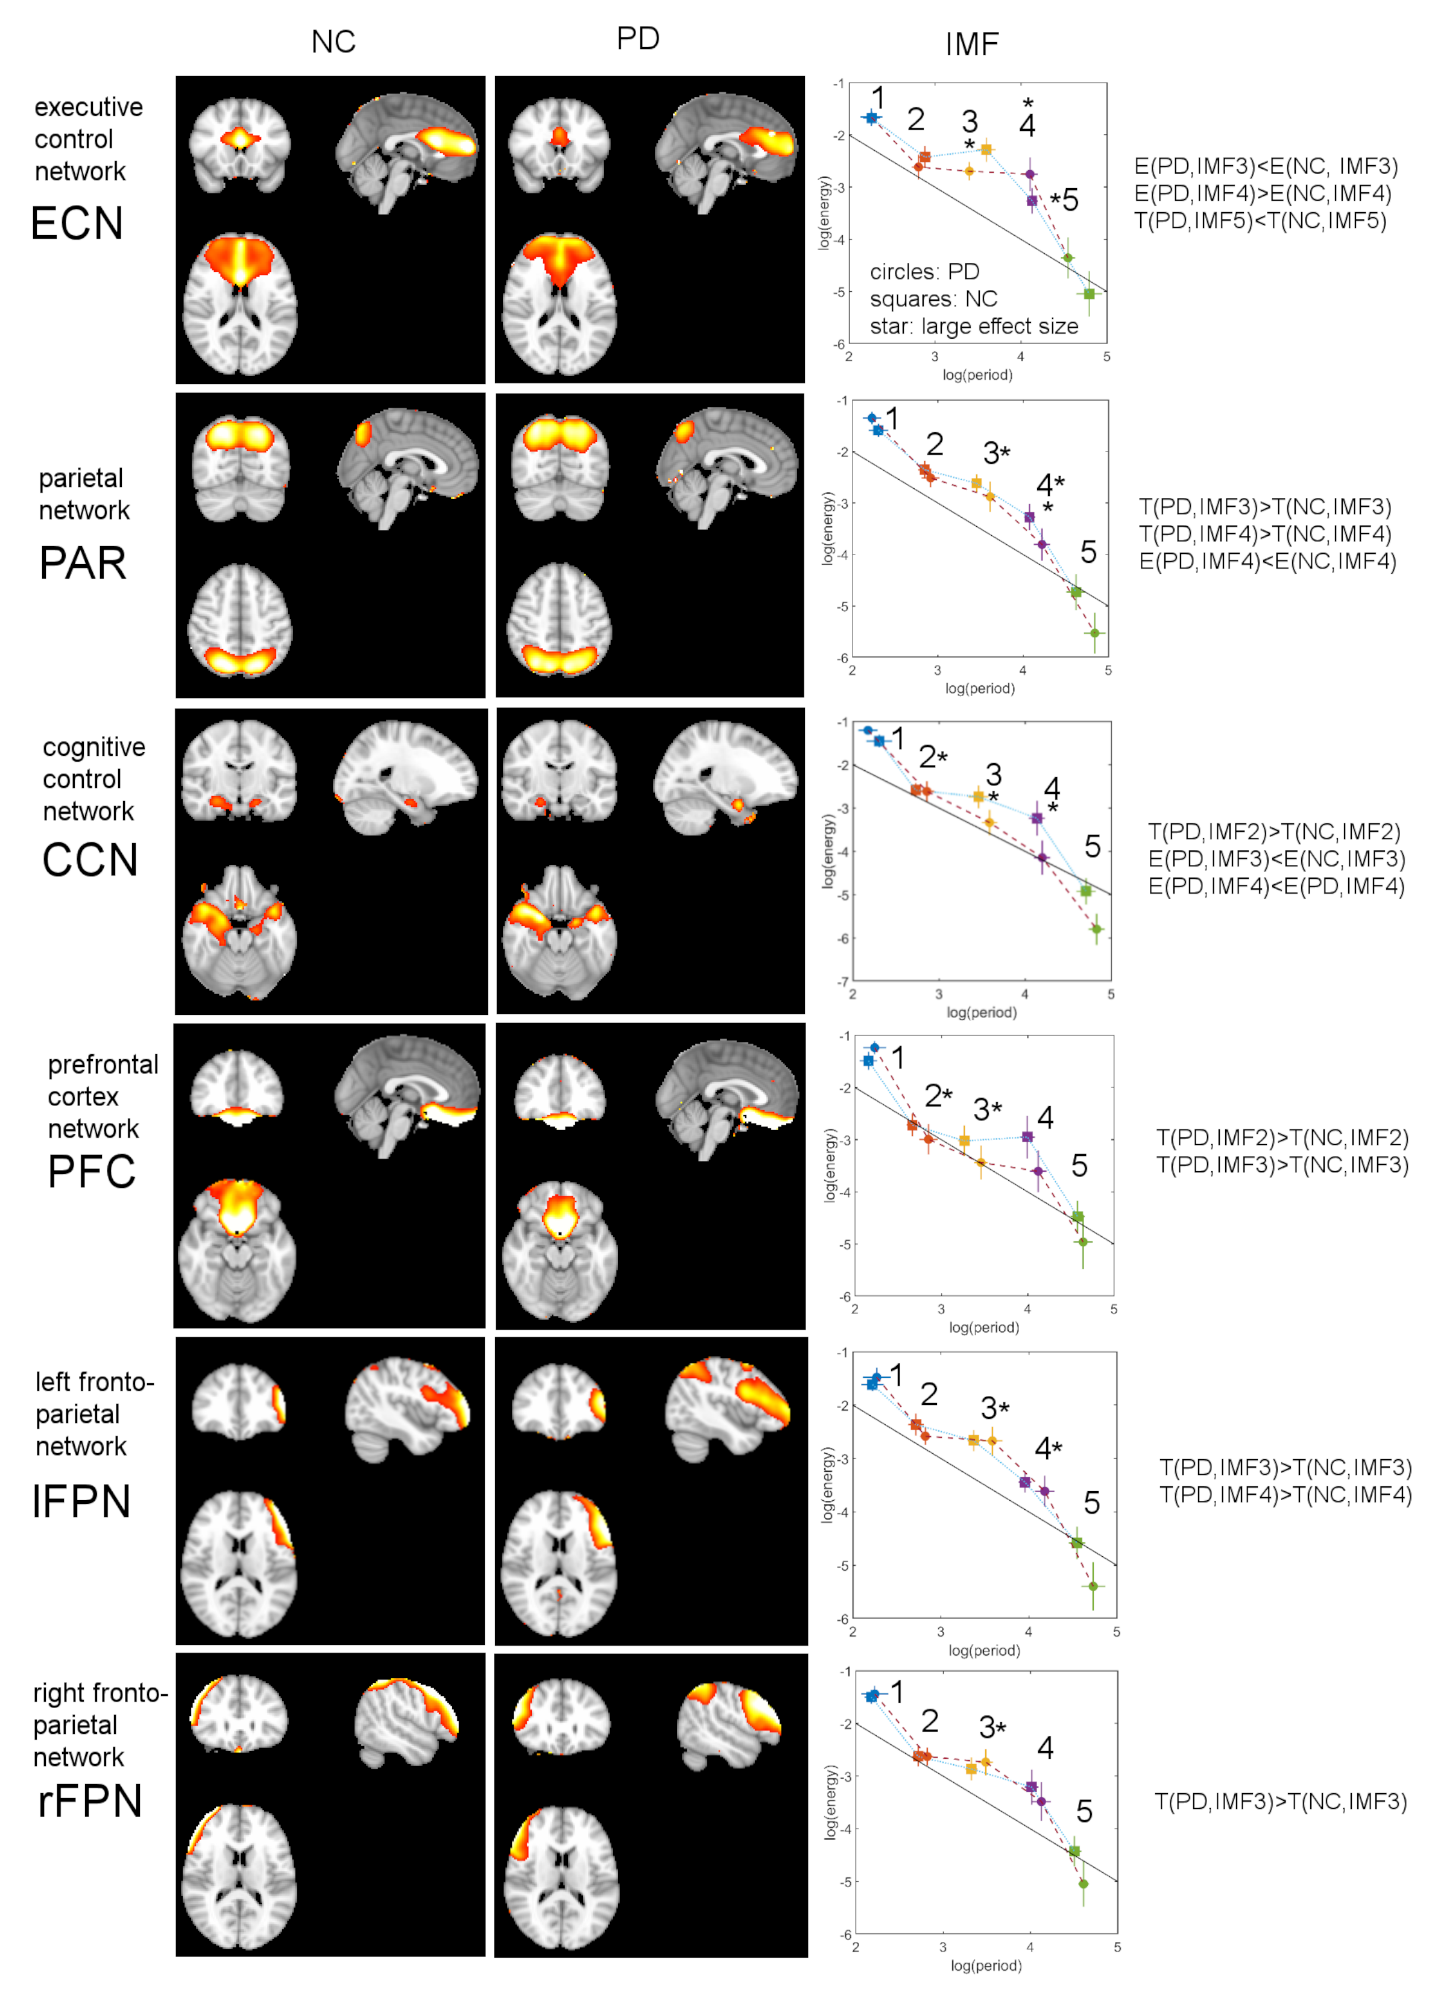
Fig.1 shows the results for the DMN. A t-test showed no significant spatial differences of this network between NC and PD. Fig.2 (top) shows the calculated IMFs for the DMN. IMF1 of PD patients shows some variation in the amplitude of the time series signal. All other IMFs have similar characteristics for the same index between NC and PD. In Fig.2 (bottom) we calculated the energy and period for each IMF and plotted this information using group-specific markers in a log(energy) vs log(period) diagram. Standard deviations of the markers are indicated by horizontal and vertical lines for log(period) and log(energy), respectively. Also here, we found no significant difference in energy or period for any of the IMFs of the DMN for NC vs PD. In Fig.3 we show all 6 resting-state networks (out of 30) where the period of the IMF (with the same index) differed by a large effect size (Cohen’s d > 0.8) between NC and PD. The obtained networks are the executive control network (ECN), the parietal network (PAR), the cognitive control network (CCN), the prefrontal cortex network (PFC), and the left/right fronto-parietal network (lFPN, rFPN). All these networks show significant spatial and temporal differences. The ECN, CCN, and PFC have reduced activations in PD, whereas the PAR, lFPN and rFPN have spatially extended activations in PD. Looking at the temporal characteristic of these networks, the ECN has increased frequency content (less period) for the very low frequency band in IMF5, whereas all other networks show a decrease in low-frequencies for some of the higher bands (IMFs with index ≤ 4). We found that the period for the same indexed IMF is always larger for PD for all networks except the ECN, whether the effect size is small or large. Also, the amplitude of oscillations of the IMFs as measured by log(energy) is generally smaller for PD for most of the IMFs.Discussion
This study demonstrated that in early PD there are no spatial or temporal changes detectable in the DMN. However, we found 6 other brain networks that showed significant spatial and temporal differences of resting-state signal characteristics. Most networks in early PD can be characterized by a reduction in frequency and energy in specific low-frequency bands. These findings may improve diagnosis of early PD patients.Conclusion
We have used EMD to study the energy and period content of IMFs for resting-state networks in early PD and found a reduction in both IMF frequency content and energy for PAR, CCN, PFC, lFPN, and rFPN. In contrast, ECN showed increased low-frequency content. For the DMN, no spatial or temporal changes were observed.Acknowledgements
The research was supported by the National Institute of Health (grant number 1R01EB014284 and P20GM109025). Data used in the preparation of this article were obtained from the Parkinson’s Progression Markers Initiative (PPMI) database (www.ppmi-info.org/data). For up-to-date information on the study, visit www.ppmi-info.org. PPMI, a public-private partnership, is funded by the Michael J. Fox Foundation for Parkinson’s Research. Other funding partners include a consortium of industry players, non-profit organizations and private individuals: AbbVie, Avid Radiopharmaceuticals, Biogen Idec, Bristol-Meyers Squibb, Covance, GE Healthcare, Genentech, GlaxoSmithKline, Eli Lilly and Company, Lundbeck, Merck, Meso Scale Discovery, Pfizer Inc., Piramal Imaging, Roche CNS group, Servier, UCB and Golub Capital.References
[1] Van Eimeren T, et al. Dysfunction of the Default Mode Network in Parkinson’s Disease. Arch Neurol 2009, 66:877-883.
[2] Hu X-F, et al. Amplitude of Low-frequency Oscillations in Parkinson’s Disease. Chin Med J (Engl) 2015, 128:593-601.
[3] Flandrin P, et al. Empirical mode decomposition as a filter bank, IEEE Sig. Proc. Letters 2004, 11(2), 112-114.
[4] Marek K, et al. The Parkinson Progressive Marker Initiative (PPMI). Prog Neurobiol 2011, 95:629-635.
[5] Hyvärinen A. Fast and Robust Fixed-Point Algorithms for Independent Component Analysis. IEEE Transactions on Neural Networks 1999, 10(3):626-634.
Figures