0420
Functional MRI can distinguish between optimal and non-optimal frequencies in PD-DBS1GE Global Research, Bangalore, India, 2Department of Neuroscience and Experimental Therapeutics, Albany Medical Center, Albany, NY, United States, 3GE Global Research, Niskayuna, NY, United States, 4Department of Neurosurgery, Albany Medical Center, Albany, NY, United States
Synopsis
Deep Brain Stimulation is an effective treatment for Parkinson's disease symptoms. Despite its success, the underlying principle and the mechanisms are not yet fully understood. In this study, we recorded concurrent DBS-fMRI to 1) elucidate brain regions activated at the clinically optimal settings and, 2) determine the effect of changes in stimulation frequency on whole-brain activation. Optimal DBS frequencies showed activation in the thalamus and motor cortices. Further, there was a significant difference in activation in the sensorimotor cortices between the optimal and non-optimal frequencies, indicating potential use for fMRI as a tool for optimizing DBS parameters.
Introduction
Deep brain stimulation (DBS) is a functional treatment that is widely accepted as a therapy for Parkinson’s disease (PD)1,2. Despite its remarkable clinical success, the precise mechanism of action remains to be elucidated. Most electrophysiological and cellular studies3, have investigated the local effects of DBS. However, visualization and understanding whole-brain effects of DBS requires functional imaging techniques, such as functional Magnetic Resonance Imaging (fMRI)4,5. Existing methods for tuning DBS parameters are largely based on trial and error, requiring at least 6-months of iterative search for the parameter combination that best mitigates symptoms. An understanding of whole-brain effects of DBS can significantly reduce programming time. In this study, we aim to use fMRI to 1) identify DBS-activated brain regions in PD patients with optimized DBS settings and, 2) investigate how frequency changes impacts brain response.Methods
PD subjects implanted with DBS electrodes in either the sub-thalamic nucleus (STN) or globus pallidus internal (GPi) were recruited for this study, and underwent concurrent DBS and fMRI. A total of 11 subjects were included in this study: 5/1 bilateral STN/GPi, 3/2 unilateral STN/GPi. After a T1-weighted anatomical acquisition, all patients were set on a 30s DBS ON/30s DBS OFF cycling paradigm. fMRI was acquired on a 1.5 T (GE Healthcare) MR scanner for 6-minutes using whole brain GE-EPI at a spatial resolution of 3.75 x 3.75 x 3mm, with a TE/TR of 45/3011ms. fMRI cycling and stimulation were synchronized using an electronic synchronization box6. Each patient underwent one scan at their clinically optimized settings and 2-4 scans at clinically non-optimal frequency settings (60-220Hz).
fMRI data were slice time corrected, motion corrected, rigid registered to T1-weighted image, non-rigid registered to Montreal Neurological Institute atlas, spatially smoothed using FWHM 6mm using SPM12 (http://www.fil.ion.ucl.ac.uk/). Functional activation maps (t-maps) were estimated using 30s ON/OFF block design at a voxel level. Response maps were thresholded at p<0.05 (cluster threshold 50 with p<0.001) for visualization.
Results
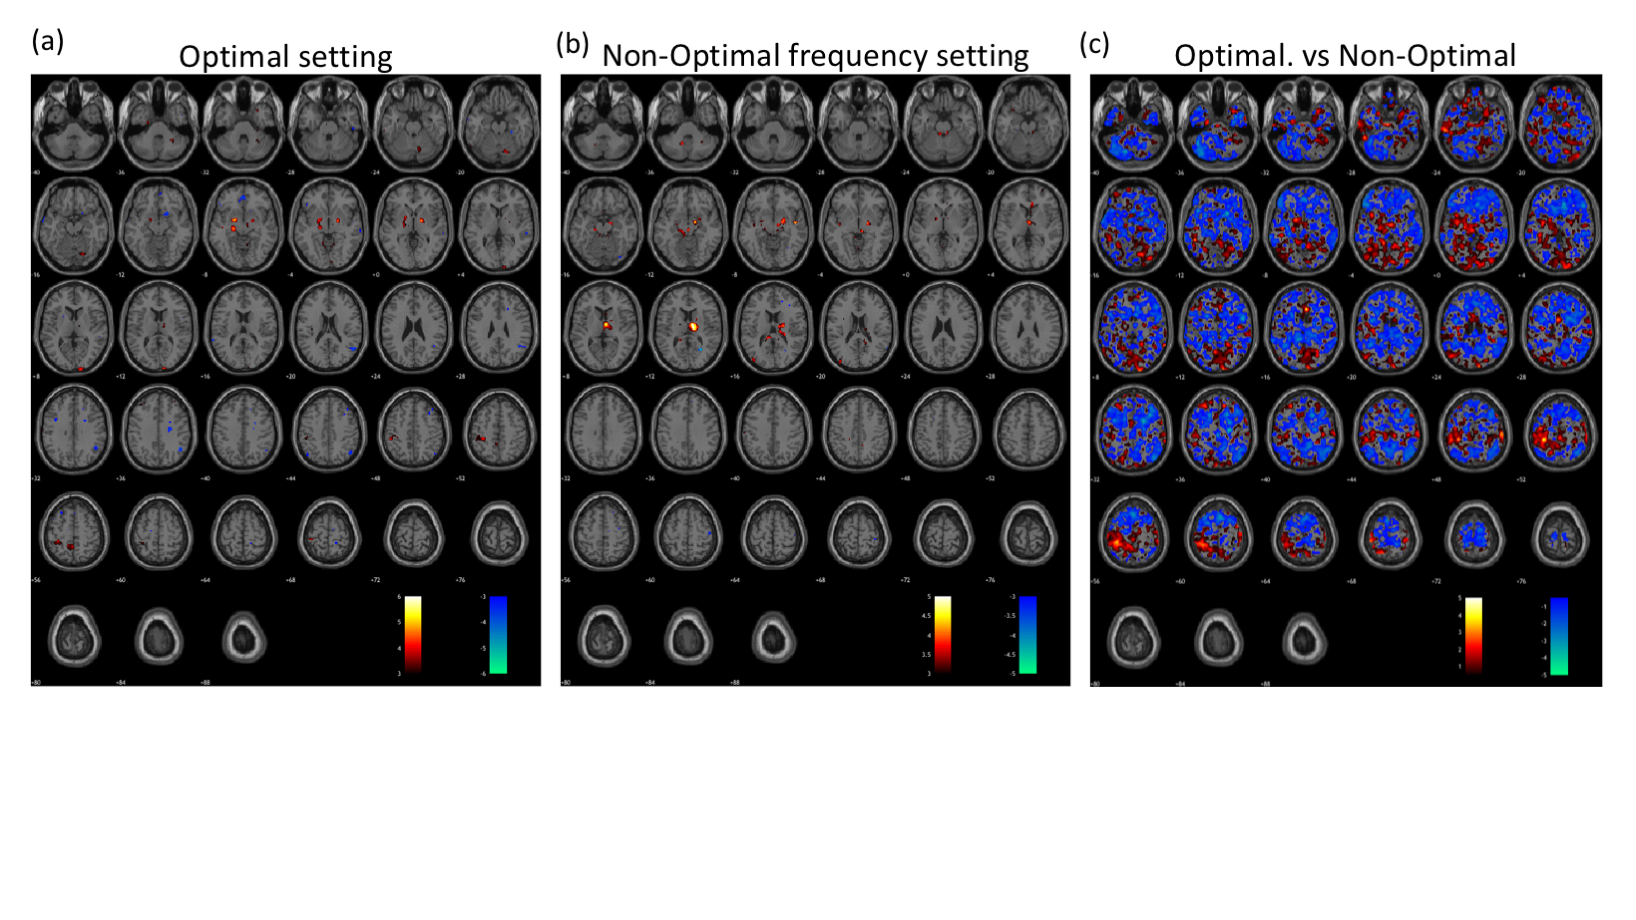
The fMRI response maps were different for optimal and non-optimal frequency settings (Fig. 1). Group-level analysis for all patients at optimal frequency settings showed activation in bilateral thalamus, motor cortex and posterior cerebellum; and deactivation in secondary visual and inferior frontal cortices (Fig. 1a), consistent with previous literature4,7. In contrast, the non-optimal frequency settings showed deactivation in the right motor cortex (Fig. 1b). Across subjects, the motor cortex showed significantly greater activation in optimal compared to non-optimal frequency settings (p<0.05, Fig. 1c). To alleviate the variability due to differences in electrode locations and laterality, we calculated response maps for only the 5 bilateral STN patients. The results were similar with stronger t-values.
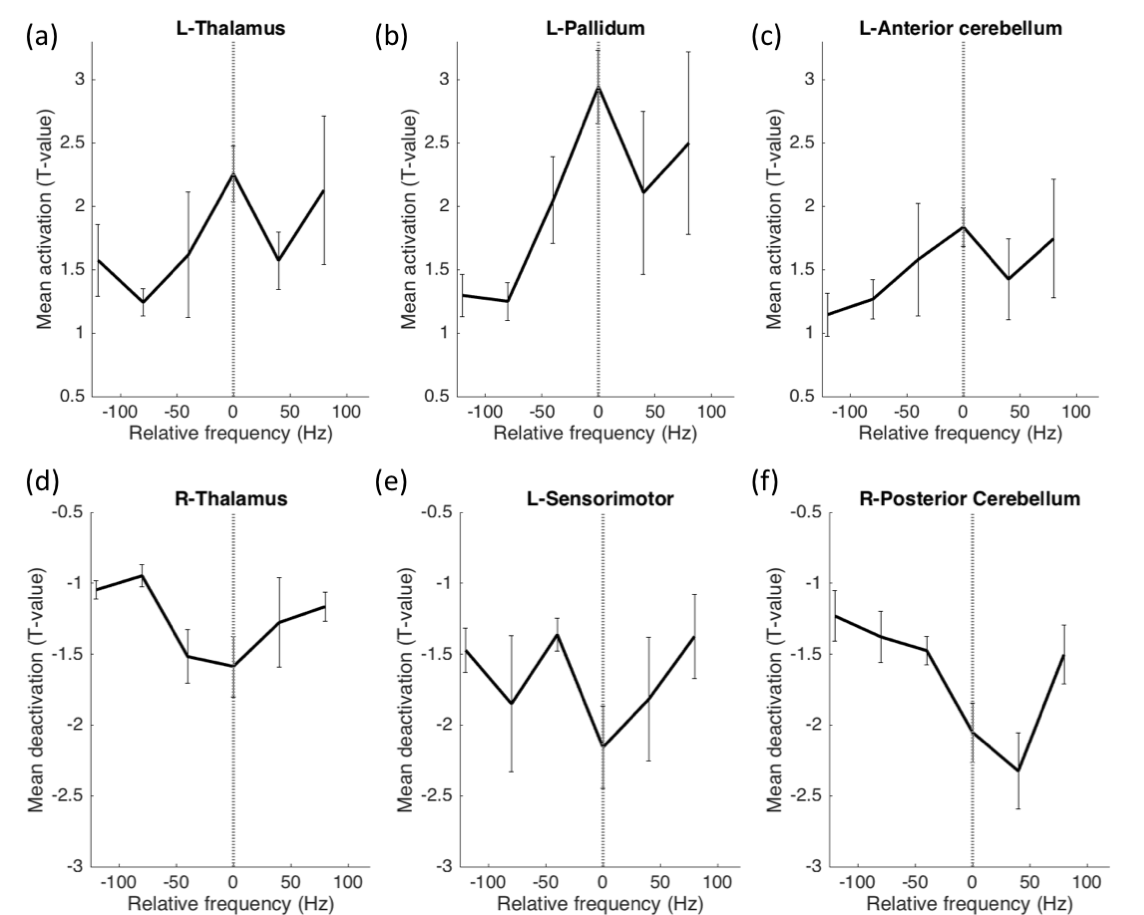
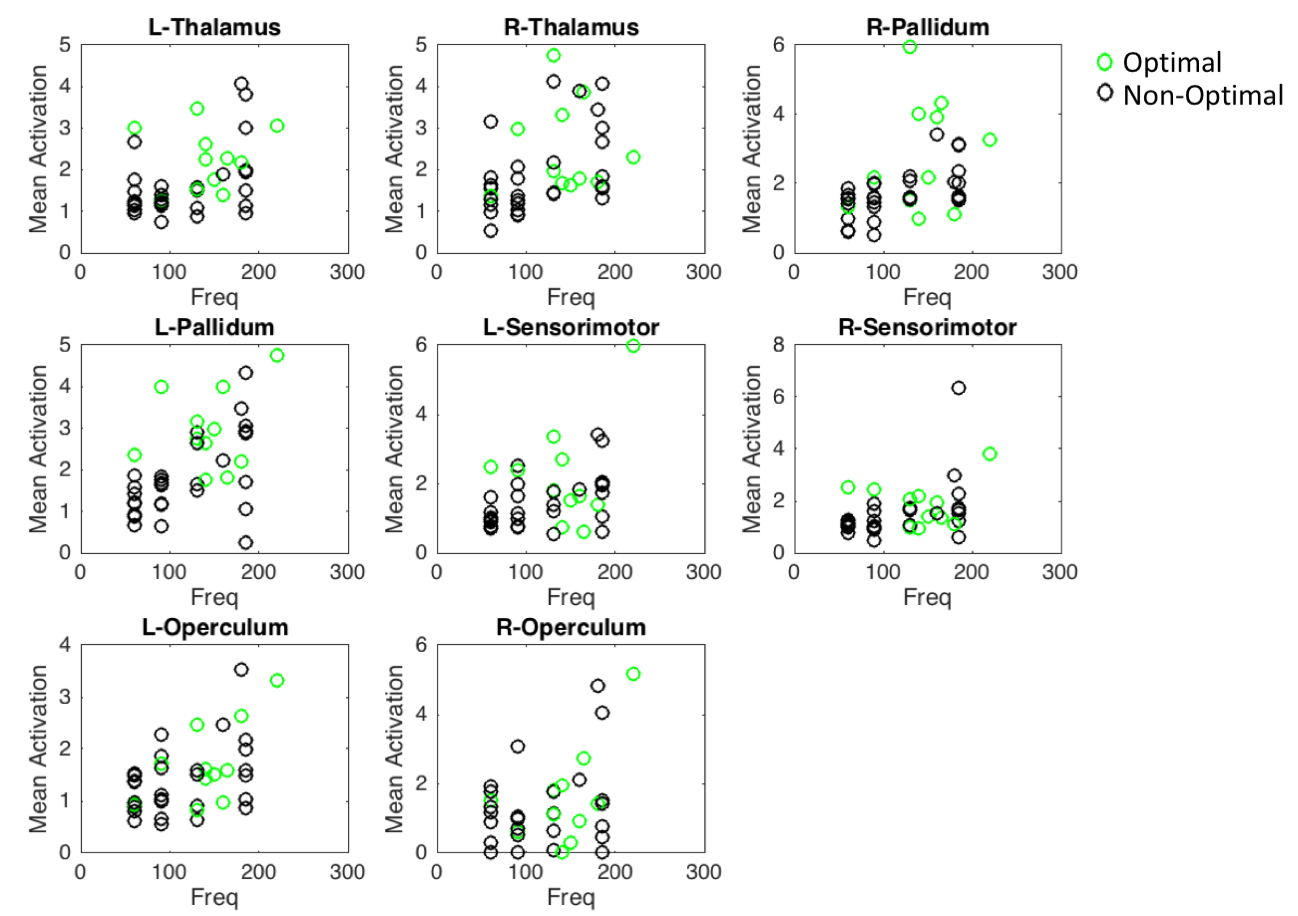
Mean t-values were calculated for 16 regions-of interest including the thalamus, pallidum, sensorimotor cortex, anterior and posterior cerebellum, primary and secondary visual areas and operculum. While optimal frequencies in our cohort ranged from [60-220Hz] in order to enable group-level analysis, each patient’s frequencies were mapped to a scale relative to the optimal frequency, which was set to 0 (Fig. 2). Thalamus, pallidum and anterior cerebellar regions showed significantly stronger activation in optimal compared to non-optimal frequencies (p<0.05, rank sum test, Fig. 2a-c). Sensorimotor cortex and posterior cerebellum showed significantly stronger deactivation for optimal compared to non-optimal frequencies (p<0.05, rank sum test, Fig. 2d-f). Absolute frequencies (not relative as shown in Fig. 2) were significantly correlated to activation in regions of the thalamo-cortical motor circuit (Fig. 3).
Discussion and conclusions
We have successfully conducted concurrent fMRI in PD patients with DBS implants. The stimulation frequency was varied around the clinically optimal configuration to determine the effect this parameter on brain activation. The pattern of activation and deactivation was significantly different between optimal and non-optimal frequencies; more specifically, in the sensorimotor regions (Fig. 1). At the optimal frequency, the activation/deactivation was maximal in regions of the thalamo-cortical motor circuit, decreasing sharply at non-optimal frequencies (Fig. 2). As shown previously8, frequency changes were positively correlated with amount of energy delivered locally, potentially associated with the amount of activation in the volume of tissue around the electrode. Increased activation at optimal frequency cannot be attributed to the absolute frequency, because though frequency was correlated to activation amplitude, optimal frequency was found to be uniformly distributed across the entire range of frequencies (Fig. 2-3). Here, we demonstrate that fMRI can be used to optimize DBS frequency. This can be expanded to other DBS parameters (voltage, contact, pulse-width), allowing the clinician to rapidly tune DBS for best symptom relief in PD and improve the customization of DBS to individual patients.Acknowledgements
No acknowledgement found.References
- Okun, M. S. Deep-brain stimulation for Parkinson’s disease. N. Engl. J. Med. 367, 1529–1538 (2012).
- Kringelbach, M. L., Jenkinson, N., Owen, S. L. F. & Aziz, T. Z. Translational principles of deep brain stimulation. Nat. Rev. Neurosci. 8, 623–635 (2007).
- McIntyre, C. C. & Hahn, P. J. Network Perspectives on the Mechanisms of Deep Brain Stimulation. Neurobiol. Dis. 38, 329–337 (2010).
- Kahan, J. et al. Therapeutic Subthalamic Nucleus Deep Brain Stimulation Reverses Cortico-Thalamic Coupling during Voluntary Movements in Parkinson’s Disease. PLOS ONE 7, e50270 (2012).
- Phillips, M. D. et al. Parkinson disease: pattern of functional MR imaging activation during deep brain stimulation of subthalamic nucleus--initial experience. Radiology 239, 209–216 (2006).
- Fiveland, E. et al. EKG-based detection of deep brain stimulation in fMRI studies. Magn. Reson. Med. (2017). doi:10.1002/mrm.26868
- Albaugh, D. L. & Shih, Y.-Y. I. Neural Circuit Modulation During Deep Brain Stimulation at the Subthalamic Nucleus for Parkinson’s Disease: What Have We Learned from Neuroimaging Studies? Brain Connect. 4, 1–14 (2013).
- Koss, A. M., Alterman, R. L., Tagliati, M. & Shils, J. L. Calculating total electrical energy delivered by deep brain stimulation systems. Ann. Neurol. 58, 168; author reply 168-169 (2005).
Figures