0418
Exploring Temporal Dynamics in Resting-State Networks using Co-Activation Pattern Analysis1Cleveland Clinic Lou Ruvo Center for Brain Health, Las Vegas, NV, United States, 2Barrow Neurological Institute, Phoenix, AZ, United States, 3University of Colorado, Boulder, CO, United States
Synopsis
We propose a novel group CAP analysis method to investigate temporal dynamics of specific resting-state networks. Our data-driven method computes less spatially overlapping d-CAPs for each group. We compare network-dynamics between different populations using d-CAP based measurements. Using simulation, we demonstrate that the proposed method is able to determine spatially less overlapping d-CAPs for each group accurately. Using real fMRI data, we find reduced network-dynamics of most networks in PD subjects as hypothesized, which corroborates and expands upon previous electrophysiologic reports.
Introduction
The temporal dynamics of brain’s intrinsic networks have been recently studied using co-activation pattern (CAP) analysis1,2,3. One limitation of existing CAP-related methods is that obtained CAPs share considerable spatial overlap, and existing CAPs might not be specific enough to describe network dynamics. In this study, we have proposed a data-driven CAP group analysis method to compute spatially less overlapping dominant-CAPs (d-CAPs) and to compare network dynamics between different populations. The proposed method is first demonstrated using simulated data, and is further applied to real fMRI data to explore network-dynamics in normal controls (NC) and Parkinson’s Disease (PD) where reduced network dynamics are hypothesized to be related to motor dysfunction4,5.Methods
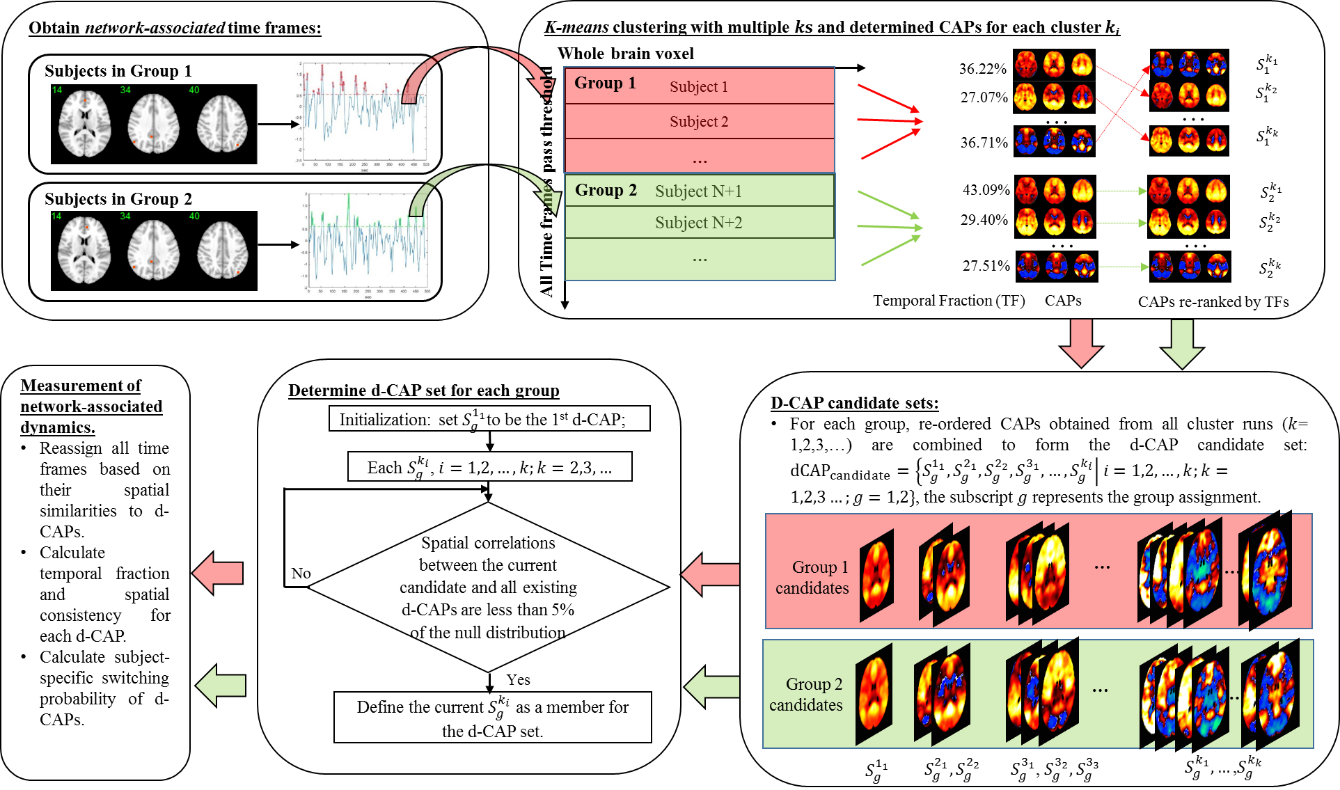
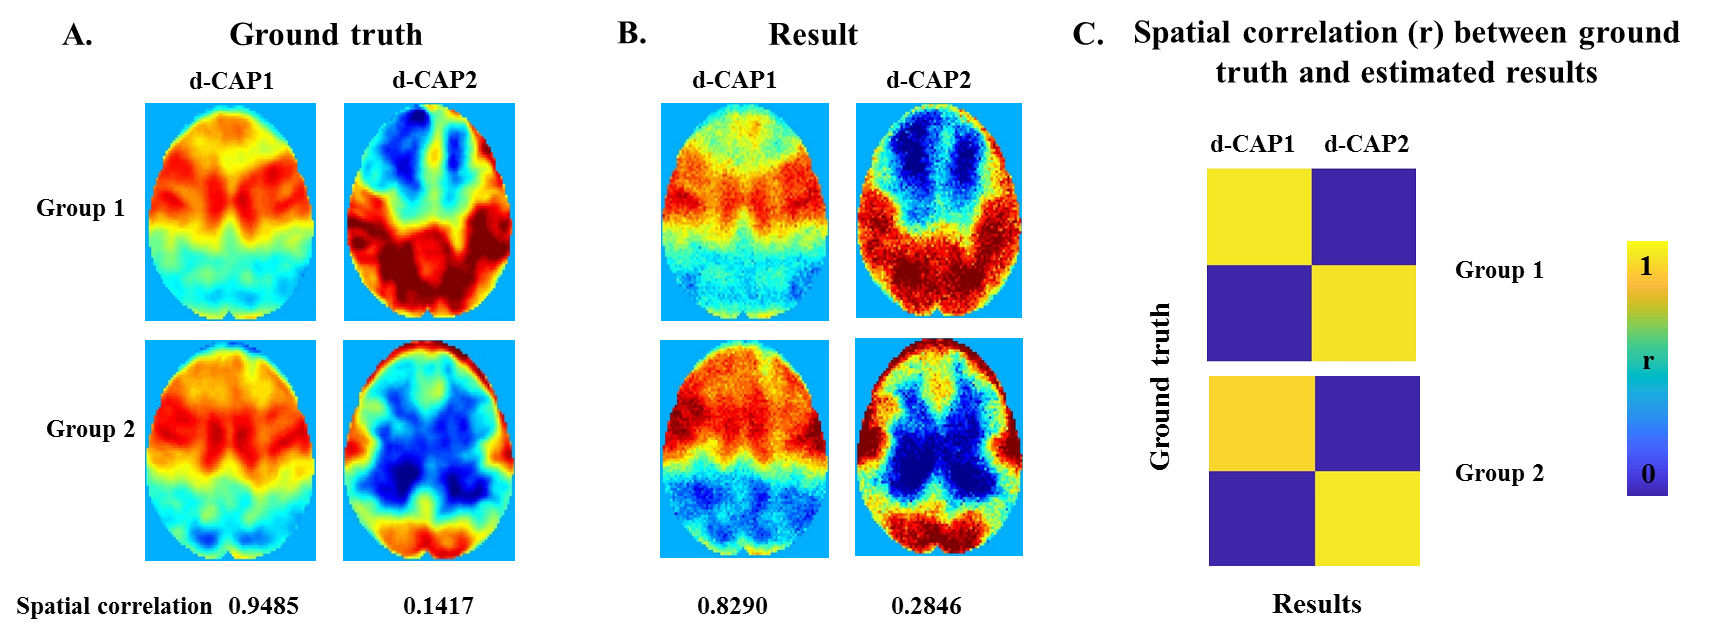
CAP group analysis method: Fig. 1 summarizes the steps in the proposed method. First, a seed is determined for every network in group1 and 2 separately. Time frames with the seed signal intensity passing certain thresholds are identified as network-associated time frames. The network-associated time frames from every subject are temporally concatenated and clustered into different number of clusters (k) using k-means method. For each k-means run with total k clusters, group-specific CAP sets S1ki and S2ki are computed by averaging spatial maps of time frames assigned to the cluster ki (ithcluster of total k clusters) in group1 and group2, respectively. A group-specific d-CAP set is then determined for each group separately. In group1, CAPs from all k-means runs ( S1ki;k=2,3...;i=1,2...k) form the d-CAP candidate-set. The average spatial pattern of all network-associated time frames (S111) is initialized to be the first element of the d-CAP set. Next, for each element in the candidate-set, if the spatial correlations between the current candidate and all existing d-CAPs are less than 95 percentile of the null distribution, the current candidate is added to the d-CAP set. After the final d-CAP set is determined for group1, network-associated time frames in group1 are assigned to different clusters based on their spatial similarities to final d-CAPs. Based on the new cluster assignment, subject-specific switching probability is determined to quantify the network dynamics. Briefly, if two continuous selected time frames in one subject belong to two different d-CAPs, we consider there is a state-switch. The same process is repeated for group2. Simulation: Two groups of synthetic data with two d-CAPs in each group were created from real fMRI time series (Fig. 2(A)). The within-group spatial correlations between d-CAP1 and d-CAP2 were simulated to be -0.57 and -0.37 in two groups separately. The between-group spatial correlations for d-CAP1 and d-CAP2 were simulated to be 0.98 and 0.14 separately. The proposed method was applied to the simulated data. Real fMRI data: 18 NCs (14 M; 64.25±9.50 years) and 20 de-novo PD-subjects (11 M; 58.03±11.54 years; UPDRS-III: 15.05±7.42) obtained from Parkinson’s Progression Markers Initiative (PPMI) database6 were included in this study. Resting-state fMRI was performed on 3T Siemens scanner (TR/TE/FlipAngle/Resolution=2.4s/25ms/80deg/3.3mm3, 210 time frames) and went through standard preprocessing steps. The CAP group analysis were focused on seven networks: the default mode network (DMN), left and right frontal-parietal network (FPN), sub-cortical networks (sub-thalamic seeded network (STh) and striatum seeded network (STR)), sensorimotor network (SMN), executive control network (ECN) and medial temporal network (MTN). D-CAP sets were determined for each network in the PD and NC group separately and switching probabilities were calculated for every subject and used to compare the network-based temporal dynamics between two groups.Results
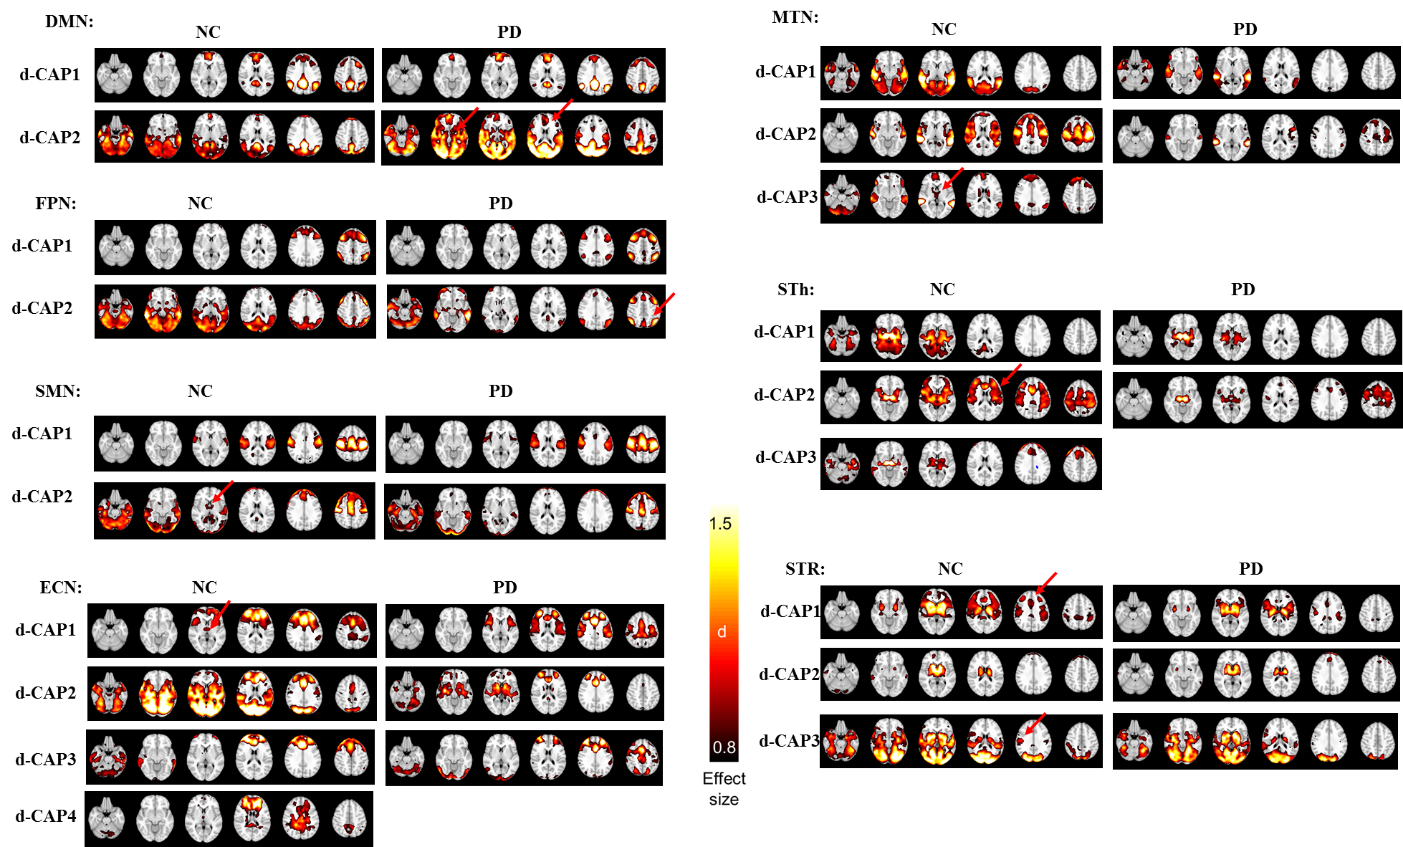
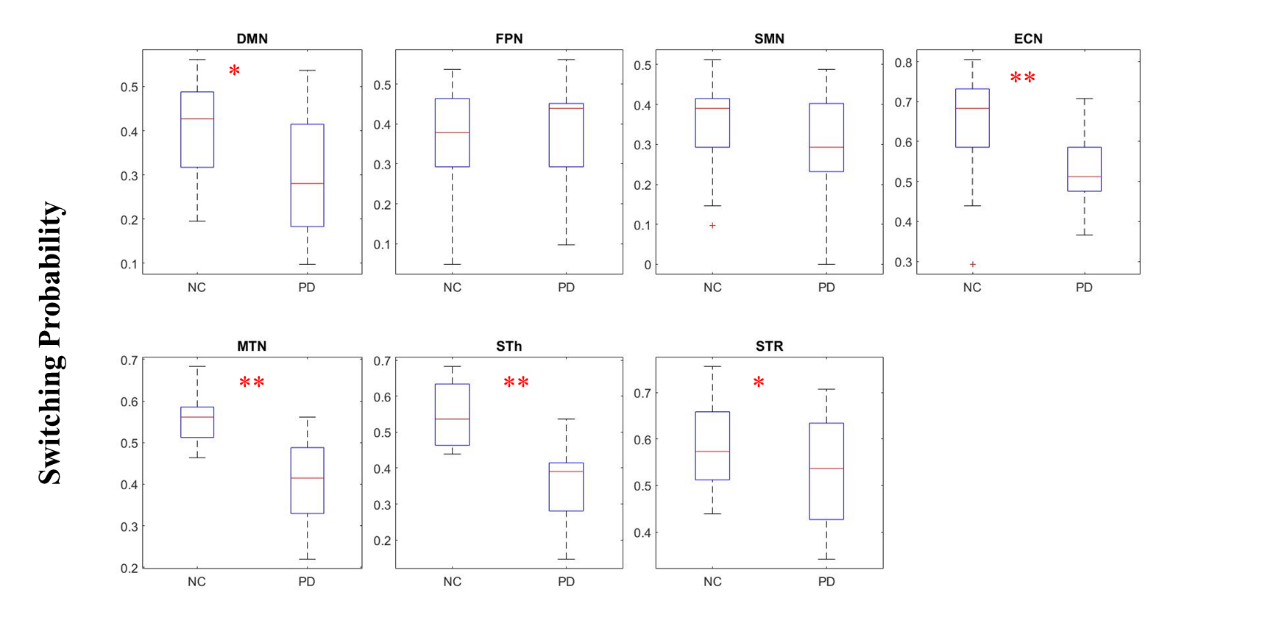
Fig. 2(B) shows the final d-CAP set of each group computed by the proposed CAP method using simulated data. The simulated ground truth and the estimated results are highly correlated for both groups (Fig. 2(C)). Fig.3 shows effect-size (Cohen’s d) maps of d-CAPs from each network in the PD and NC groups, thresholded at d ≥ 0.8 (large effect). Overall, there are altered connections and fewer d-CAPs in the PD group in the ECN, MTN, STh, and STR networks, as compared to NCs. Further, switching probability comparisons between the PD and NC groups for each network are reported in Fig. 4. The switching probability for the PD group is overall reduced, reaching statistical significance (p<0.05) in five networks.Discussion and conclusion
The proposed data-driven approach (Fig.1) forms a complete routine to determine spatially less overlapping d-CAPs and to compare network-based temporal dynamics between different populations. Using simulation, we have demonstrated the proposed method is able to determine spatially less overlapping d-CAPs for each group. Using real fMRI data, we have found reduced network-dynamics of most networks in PD subjects as hypothesized, corroborating and expanding upon previous electrophysiologic and imaging reports in PD.Acknowledgements
The study issupported by the National Institutes of Health (grant number 1R01EB014284 and P20GM109025). PPMI is sponsored and partially funded by The Michael J. Fox Foundation for Parkinson’s Research (MJFF). Other funding partners include a consortium of industry players, non-profit organizations and private individuals (for a full list see http://www.ppmi-info.org/about-ppmi/who-we-are/study-sponsors/).References
[1]. Liu X, and Jeff H. D. 2013. Time-varying functional network information extracted from brief instances of spontaneous brain activity. PNAS.
[2]. Liu et al. 2013. Decomposition of spontaneous brain activity into distinct fMRI co-activation patterns. Front. Syst. Neurosci
[3]. Chen J, et al. 2015. Introducing co-activation pattern metrics to quantify spontaneous brain network dynamics. NeuroImage.
[4]. Yanagisawa T, et al. 2012. Regulation of motor representation by phase–amplitude coupling in the sensorimotor cortex. The Journal of Neuroscience.
[5]. De Hemptinne C, et al. 2012. Therapeutic deep brain stimulation reduces cortical phase-amplitude coupling in Parkinson's disease. Nature neuroscience.
[6]. Parkinson Progression Marker Initiative. 2011. The Parkinson Progression Marker Initiative (PPMI). Prog Neurobiol.
Figures