0417
CEST Fingerprinting: Initial Study in Human Subjects1Biomedical Imaging Research Institute, Cedars-Sinai Medical Center, Los Angeles, CA, United States, 2Department of Radiology, Xuanwu Hospital, Capital Medical University, Beijing, China, 3Department of Bioengineering, University of California, Los Angeles, Los Angeles, CA, United States
Synopsis
CEST fingerprinting was recently proposed to achieve efficient exchange rate quantification for pH mapping. Here we present the initial data of pH mapping in healthy subjects and one acute stroke patient at clinical scanners in an 8-min scan using CEST fingerprinting. The pH maps of the healthy volunteers are homogenous and the values fall in the normal physiological range. The pH map in the patient shows an inhomogenous acidic area. This study shows CEST fingerprinting has the potential to detect acidosis in human subjects.
Introduction
CEST Fingerprinting has been proposed to achieve efficient exchange rate quantification for pH mapping1,2. This technique utilizes CEST saturation with varying B1 amplitudes and saturation durations to create unique signal evolution for different exchange rates. The acquired signal will then be matched to a simulated dictionary to determine the exchange rate. Previous method requires a reference signal at the opposite solute resonant frequency offset for MT effect estimation. However, NOE effect could contaminate the reference signal in in vivo study.
In this study, we applied CEST Fingerprinting framework at wide frequency offsets to estimate MT parameters. CEST Dictionary was then simulated using 3-pool model with the estimated MT parameters. Initial studies were performed in healthy subjects and one stroke patient.
Methods
This study was performed on a 3T clinical scanner (Verio; Siemens Healthcare) with a 12-channel head receiver coil.
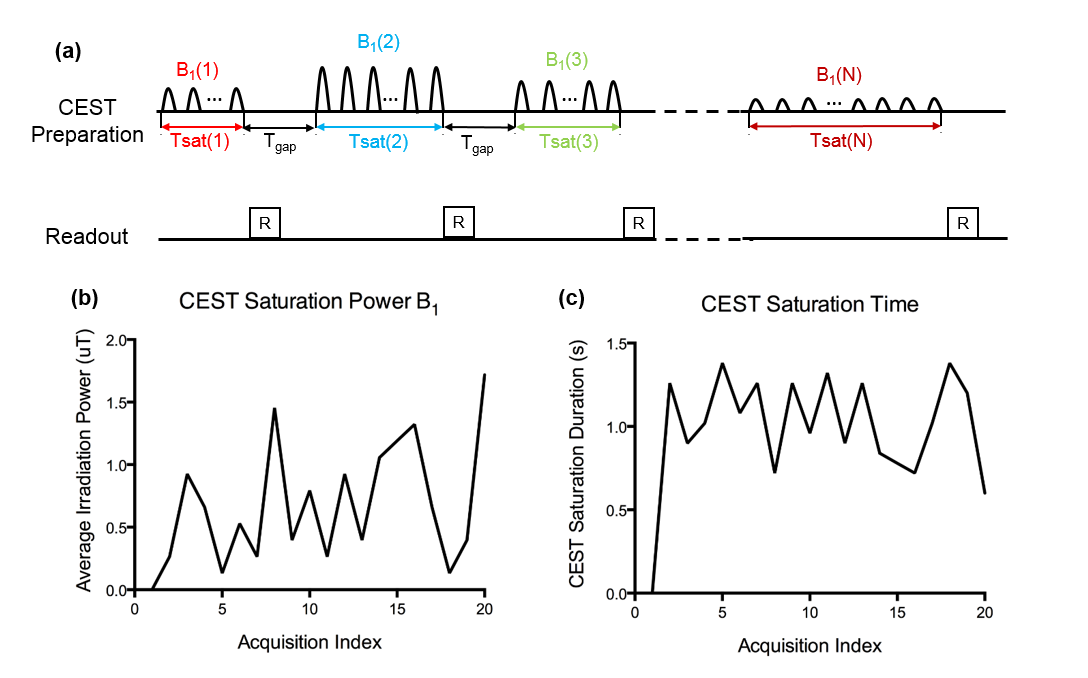
Sequence design: Fig. 1a illustrates the acquisition sequence diagram of CEST fingerprinting. In each subsequent acquisition block, RF irradiation power and duration of the CEST preparation module were varied in a pseudorandom pattern. The readout was performed in the gap between acquisition blocks and the gap time is fixed.
Imaging Study: MRI scans were performed in three healthy subjects and one acute stroke patient with hemorrhagic infarction. CEST fingerprinting scan was performed as shown in Fig. 1 with FLASH readout (FOV: 224x190 mm2; matrix size: 80x68; resolution: 2.8x2.8x6 mm3; parallel imaging acceleration factor: 2; flip angle 15°; gap time: 1000 ms). Fig 1b and 1c represent the B1 amplitude (from 0.25 μT to 2 μT) and the total CEST saturation time (from 0.8s to 1.5s), respectively. CEST preparation module consists of 30 ms Gaussian saturation pulses (flip angle ranging from 200° to 1500°) with 50% duty cycle. The scan was repeated at 3 wide frequency offsets +6 ppm, +10 ppm and +14 ppm for MT quantification, and 3 narrow frequency offsets +3 ppm, +3.5 ppm and +4.0 ppm for CEST quantification. B0 field was corrected using WASSR method. T1 mapping was acquired using MOLLI3. T2 mapping was acquired using T2 prep-FLASH with varying T2 prep durations (5ms, 30ms, 55ms, 100ms and 150ms). The total scan time of the protocol above was approximately 8 min. DWI was performed in the patient to identify the lesion.
Post Processing: Fig. 2 illustrates the flow chart of data processing procedures for in vivo CEST fingerprinting. Signals acquired at wide frequency offsets (+6, +10 and +14 ppm) were combined together to match to MT dictionary simulated with the following range of tissue parameters: semi-solid proton volume fraction: 0.025:0.025:0.15; semi-solid proton exchange rate (Hz): 20:20:100 and semi-solid proton T2 (µs): 25:25:150. With the estimated MT parameters, reference signal was calculated at +3.5 ppm with only MT effect and direct water saturation effects. CEST signal was defined as the subtraction between the reference signal and the acquired signal (shown in Fig. 2b). It was matched to the CEST dictionary simulated at +3.5 ppm with amide proton exchange rates in the range of 1:1:50 Hz using 3-pool model with estimated MT parameters to determine the amide proton exchange rate. The amide proton volume fraction was determined as the multiplicative constant derived by fitting the CEST data to CEST dictionary. The absolute pH was calculated using the formula derived by Zhou et al.4
$$k_{ex}=5.57\times10^{pH-6.4}$$
Results
Fig. 3 shows the results in a representative healthy subject. Semi-solid proton volume fraction shows a good delineation between gray matter and white matter. The other parameters also show good consistency within the brain. The pH map of the healthy volunteer is homogenous and the values fall in the normal physiological range.
Fig. 4 shows the results in the acute
stroke patient and an inhomogenous acidic area can be observed in the pH map.
Conclusion
This study shows initial feasibility of pH mapping in the brain at clinical scanners in an 8-min scan using CEST fingerprinting. This method shows the potential to detect acidosis in human subjects.Acknowledgements
No acknowledgement found.References
1. Zhou Z, Han P and Li D. CEST Fingerprinting: A Novel Approach for Exchange Rate Quantification. Proc Intl Soc Mag Reson Med 2017:0197.
2. Huang S, Cohen O, McMahon M, Kim Y, Rosen M, and Farrar C. Quantitative Chemical Exchange Saturation Transfer (CEST) Imaging with Magnetic Resonance Fingerprinting (MRF). Proc Intl Soc Mag Reson Med 2017:0196.
3. Messroghli D, Radjenovic A, Kozerke S, Higgins D, Sivananthan M and Ridgway J. Modified Look-Locker inversion recovery (MOLLI) for high-resolution T1 mapping of the heart. Magn Reson Med 2004;52:141–146.
4. Zhou J, Payen JF, Wilson DA, Traystman RJ and van Zijl PC. Using the amide proton signals of intracellular proteins and peptides to detect pH effects in MRI. Nat Med 2003;9(8):1085-1090.
Figures