0416
Multicolor metabolic quantitative CEST (mmqCEST) imaging: possibility and limitations1UMC Utrecht, Utrecht, Netherlands, 2University of Nottingham, Nottingham, United Kingdom, 3Copenhagen University Hospital Hvidovre, Copenhagen, Denmark
Synopsis
Multicolor metabolic CEST imaging: possibility and limitations
Introduction
The high imaging resolution and metabolite sensitivity of CEST-MRI has been exploited in metabolite-weighted imaging of glutamate1, glucose2-4, glycogen5, creatine6, myo-inositol7 and glycosaminoglycans8. Thus far, measurement efforts have mainly resulted in single metabolite-weighted (<75% purity) contrast, which in pathology, where metabolite variations are on the order of a few percent, may be difficult to interpret. In this regard, CEST-MRI is behind 1H-MRS in terms of specificity and quantification. There is a strong need in multicolor-CEST-MRI methodology suitable for simultaneous-quantitative imaging of multiple metabolites. Herein, we present a new multicolor-metabolic-quantitative CEST (mmqCEST)-model and demonstrate its application in both phantom and human data.Methods
mmqCEST-model
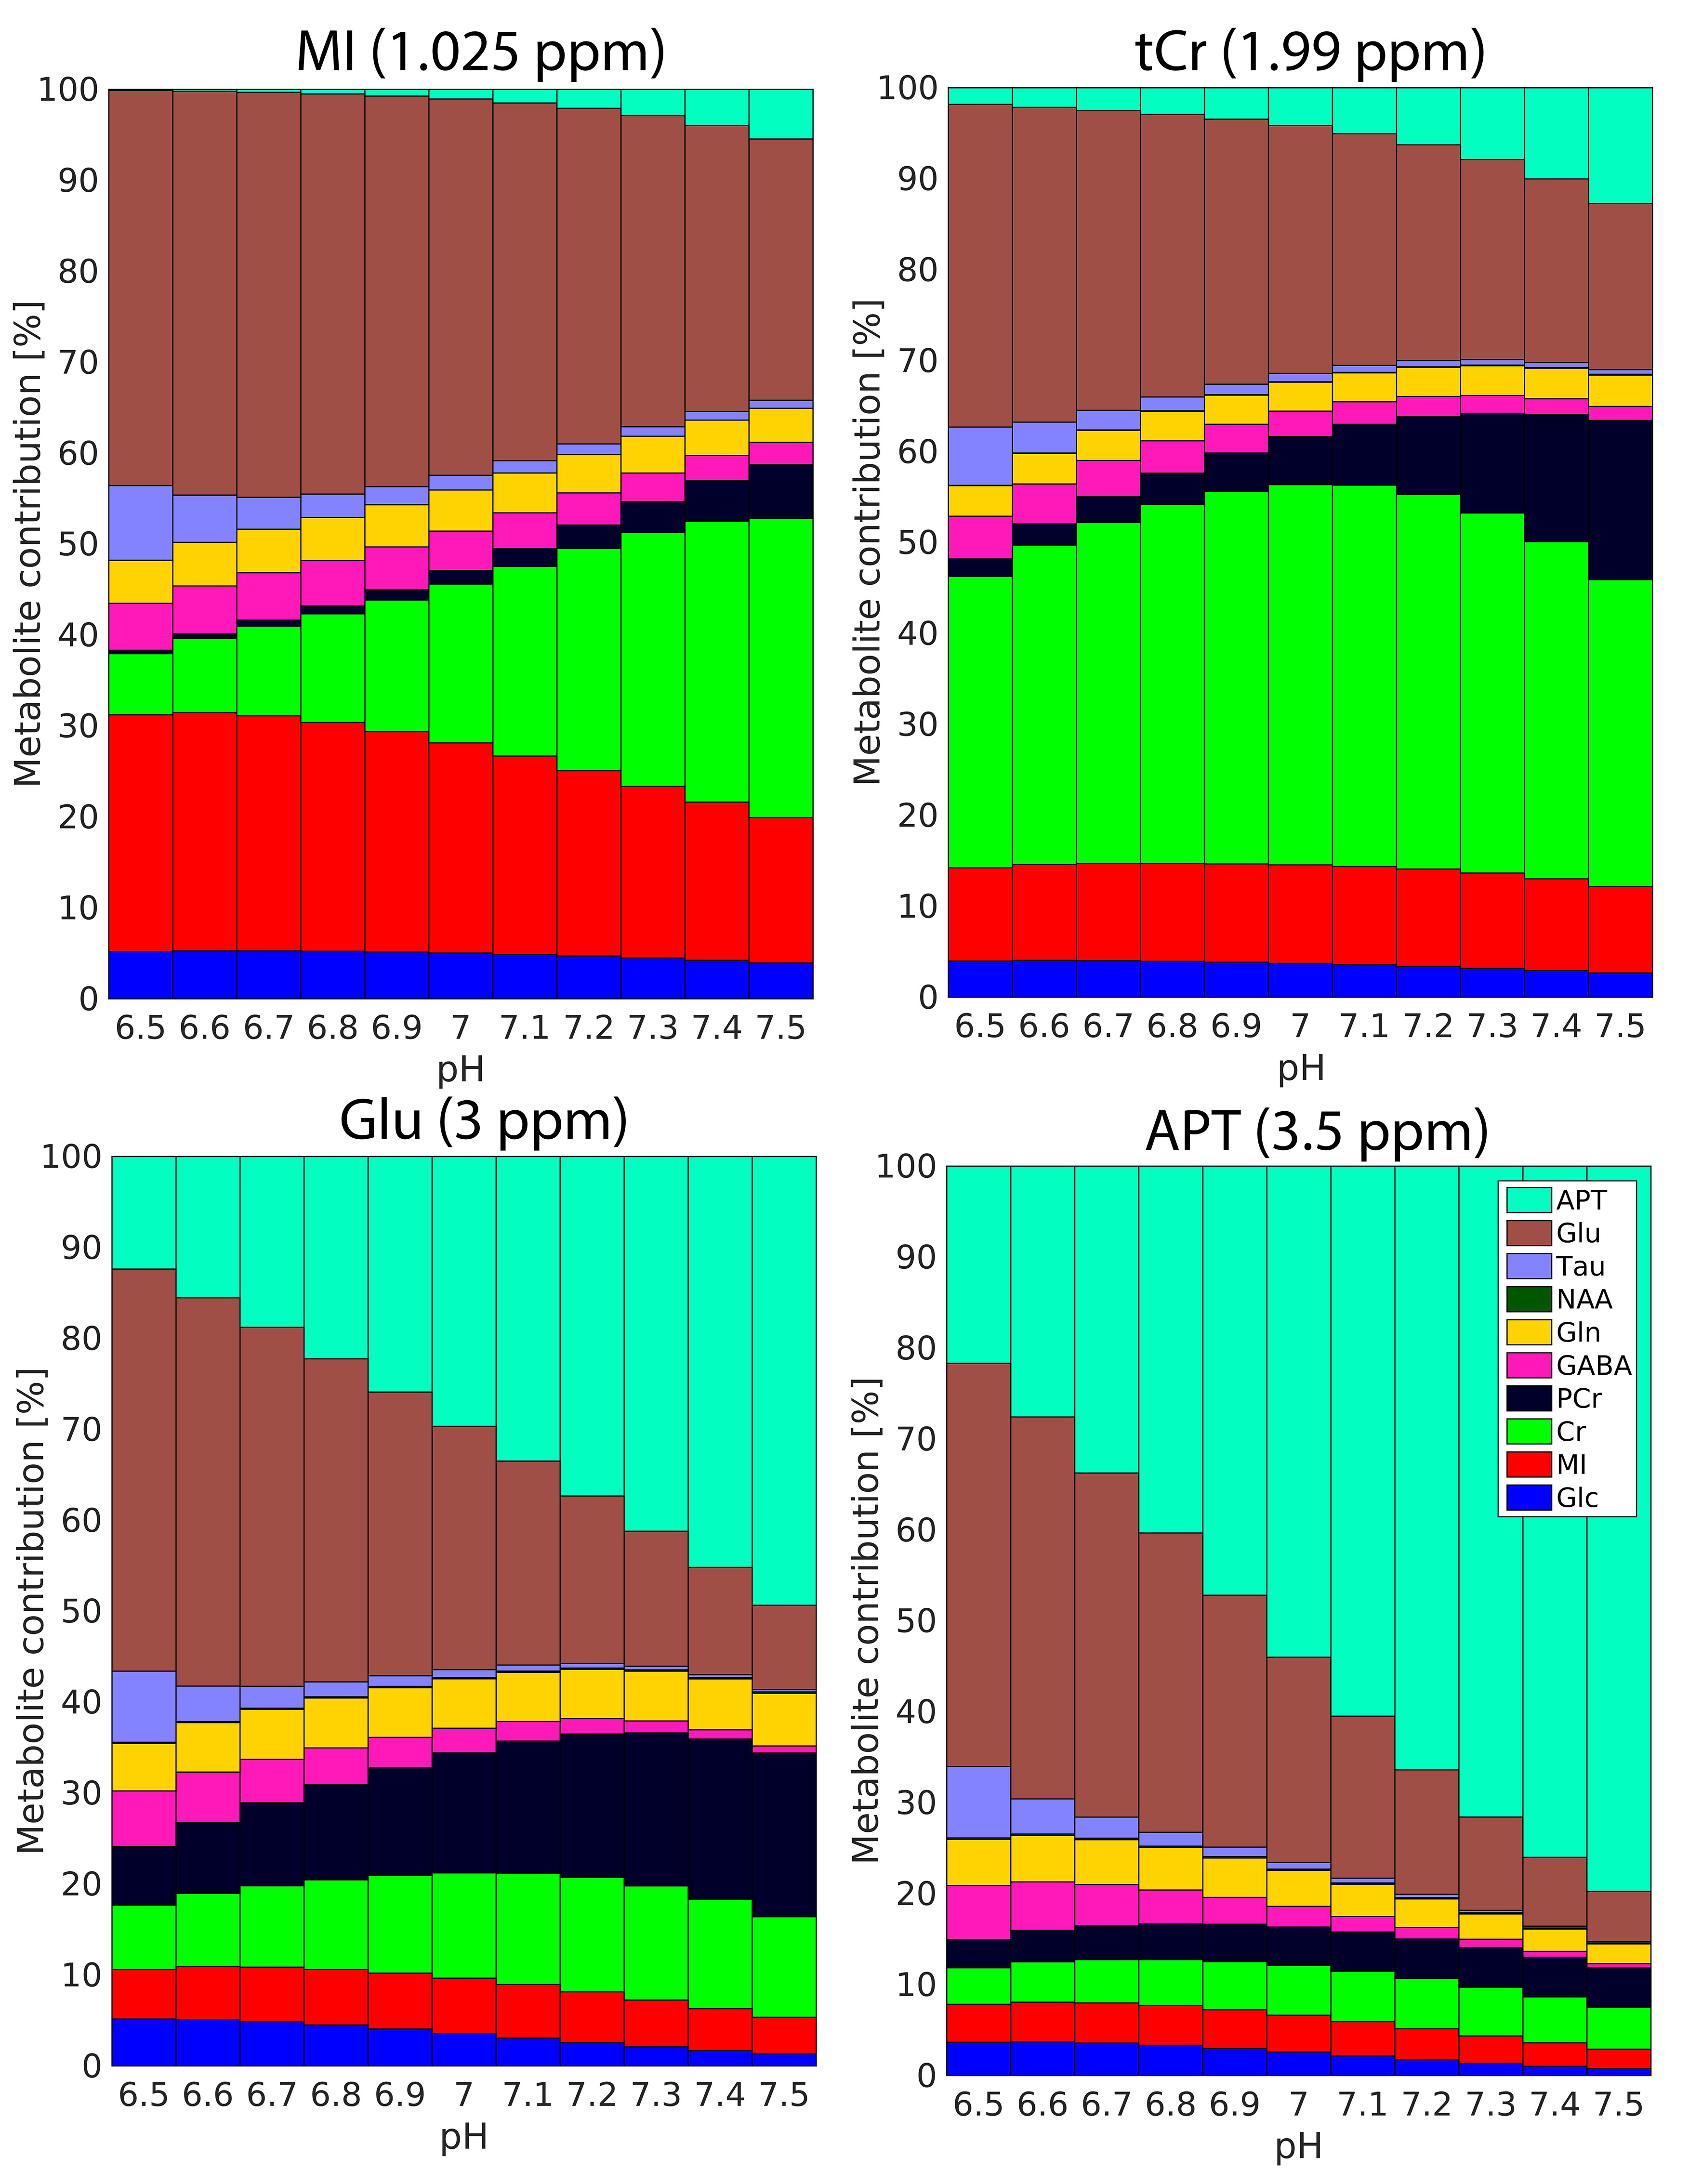
The exchange rates of the major brain metabolites glucose-Glc, myo-inositol-MI, creatine-Cr, phosphocreatine-PCr, gamma-aminobutyric-acid-GABA, glutamine-Gln, N-acetyl-aspartate-NAA, taurine-Tau, and glutamate-Glu were determined by fitting CEST-spectra from 50mM phantoms (pH: 6.5-7.5, 37ºC) measured on a 600MHz NMR-spectrometer (Bruker) to Bloch-McConnell-equations9 (BME) at multiple B1 (at least 4-B1 levels) and pH simultaneously. The exchange rates were subsequently used in BME simulations. For building mmqCEST-model in BME at 7T, the following (typical for gray matter-GM) concentrations were used10-14: Glc-1mM, MI-6.7mM, total(t)Cr-8.1mM (assuming Cr/PCr=1 for brain), GABA-1.2mM, Gln-3mM, NAA-9.5mM, Tau-2.1mM, Glu-11.1mM and cellular amides (APT)-72mM. The following CEST-prepulse parameters were investigated in BME: sinc-gaussian pulse-B1-amplitude 0.1-10µT, duty cycle-DC 0-100% and number of pulses-Np 1-200. The optimum (defined as providing the highest metabolite weighting at pH=7) parameters for brain metabolites present in sufficient concentrations were found to be: MI (1.025ppm, 24.6%-weighting):B1-4µT, DC-100%, Np-15; tCr (1.99ppm, 47.1%-weighting, of which pure Cr is 41.8%):B1-3µT, DC-100%, Np-100; Glu (3ppm, 48%-weighting):B1-10µT, DC-100%, Np-20 and amides (3.5ppm, 89.9%-weighting):B1-1µT, DC-100%, Np-200. To find the optimum mmqCEST-parameters for simultaneous imaging of MI, tCr and Glu at pH=7, the matrices containing their CEST effects as a function of B1, DC and Np (normalized by a maximum) were averaged to yield the following optimal parameters: B1-3µT, DC-100%, Np-80. For SAR-considerations, Np was reduced to 60.Brain and phantom experiments
All experiments were done on a 7T Philips MR system with a TX8/RX32 head-coil (NOVA medical). The GM phantom (10mM PBS, pH=7, 37ºC) had the same composition as for the BME-simulations, except for amides.1H-MRS
Single-voxel STEAM 1H-MRS was done with the following parameters: sample frequency=4000Hz, TE/TR=10ms/10s, NSA=64, mixing time=12ms, VAPOR water suppression, voxelsize=20x20x15mm3 (phantom) and 30x10x10mm3 (in-vivo). Metabolite quantification was done in LCmodel15-16.mmqCEST-MRI
The same mmqCEST sequence was used for both phantom and in-vivo imaging with the following parameters: saturation (B1-3µT, DC-100%, Np-60, pre-saturation T1-recovery 8s) and readout (single-shot-TFE with low-high profile order, FOV=220x189mm2, resolution=2x2x10mm2, TR/TE/FA=5ms/1.91ms/13º, SENSE 2.1, acquisition=11min3s). A 100% duty cycle was achieved with the use of 8-independent RF-channels17-18. The data were acquired at 64 unequally-spaced frequency offsets. For metabolite quantification, B0-corrected19-ROI-averaged CEST-spectra were fit to BME based on a 4-pool-model for phantom (water, MI, tCr and Glu) and a 6-pool-model for in-vivo (water, MI, tCr, APT, NOE and MT; Glu not included in-vivo as in GM-phantom its fitted concentration of 4mM was largely underestimated). The number of pools to be fitted was chosen based on major metabolic contributions at the frequencies of interest (Fig. 1) and phantom experiments (Fig. 3).Results and Discussion
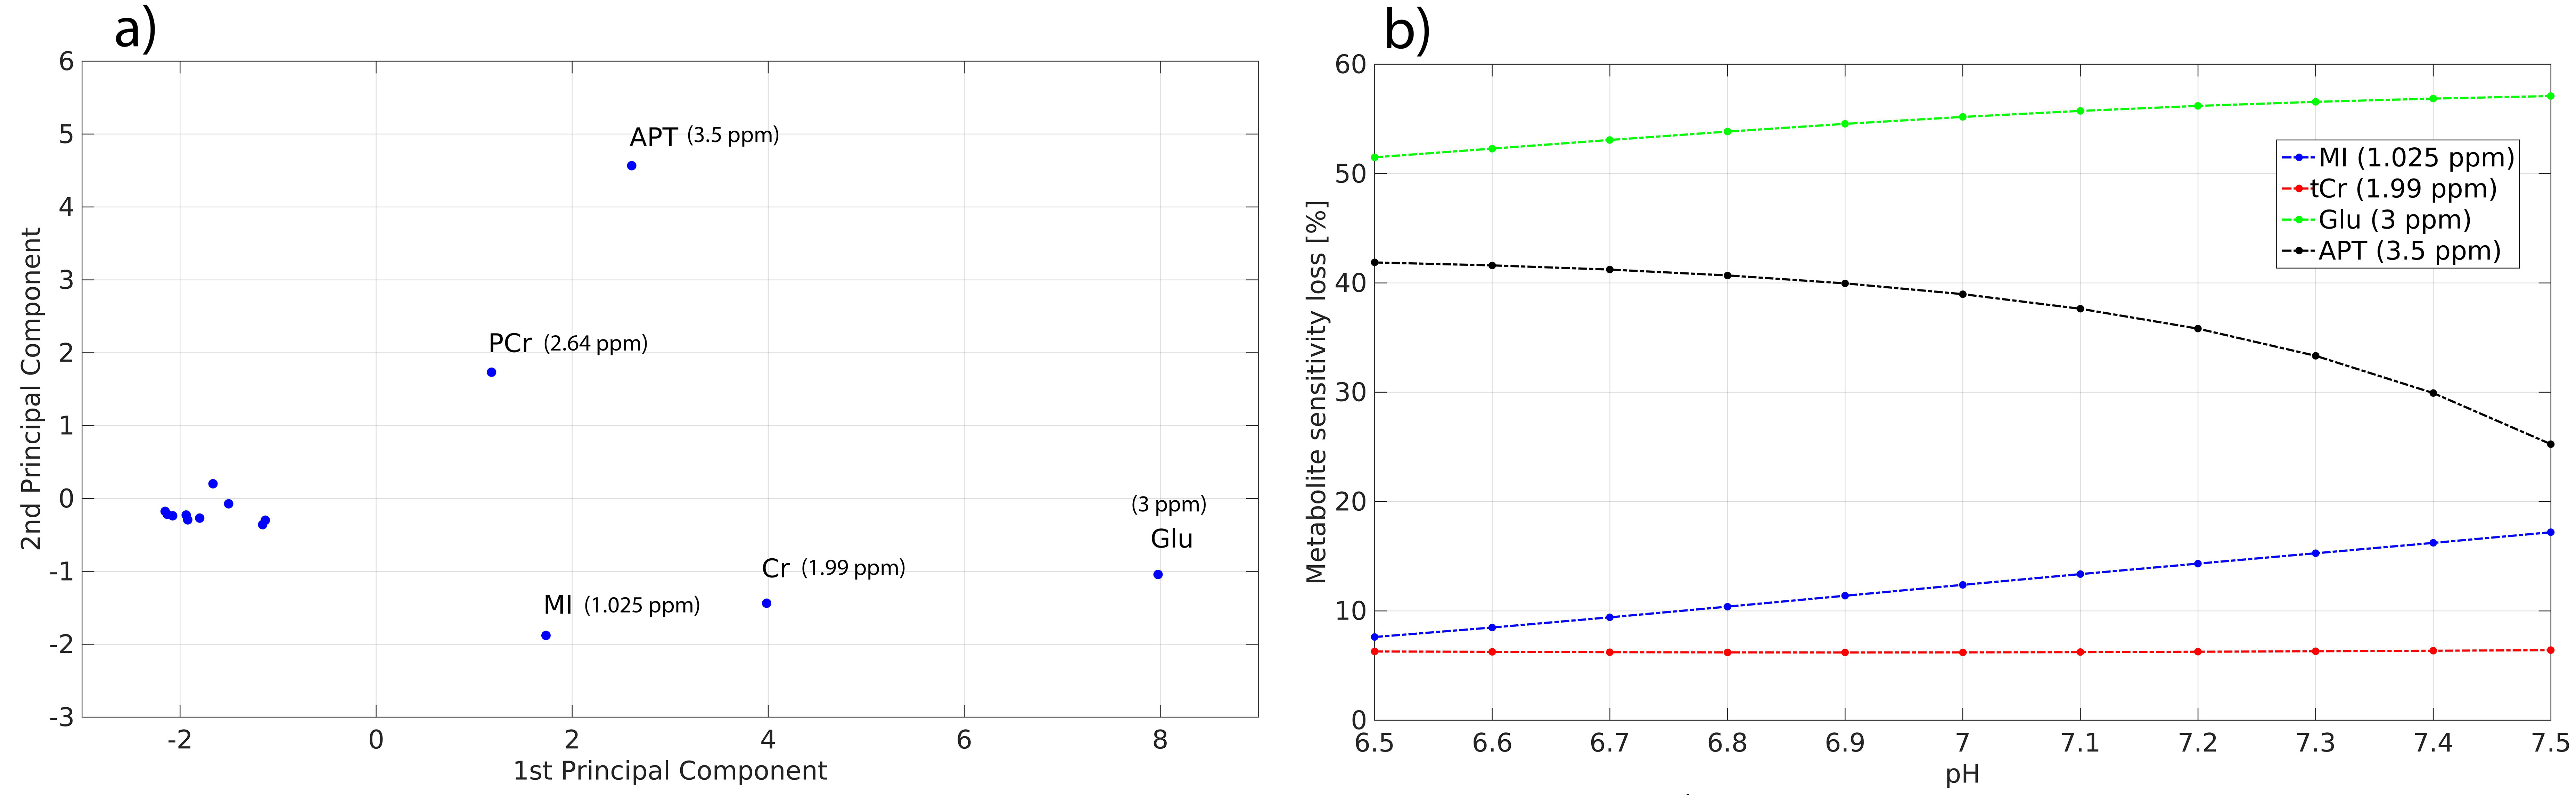
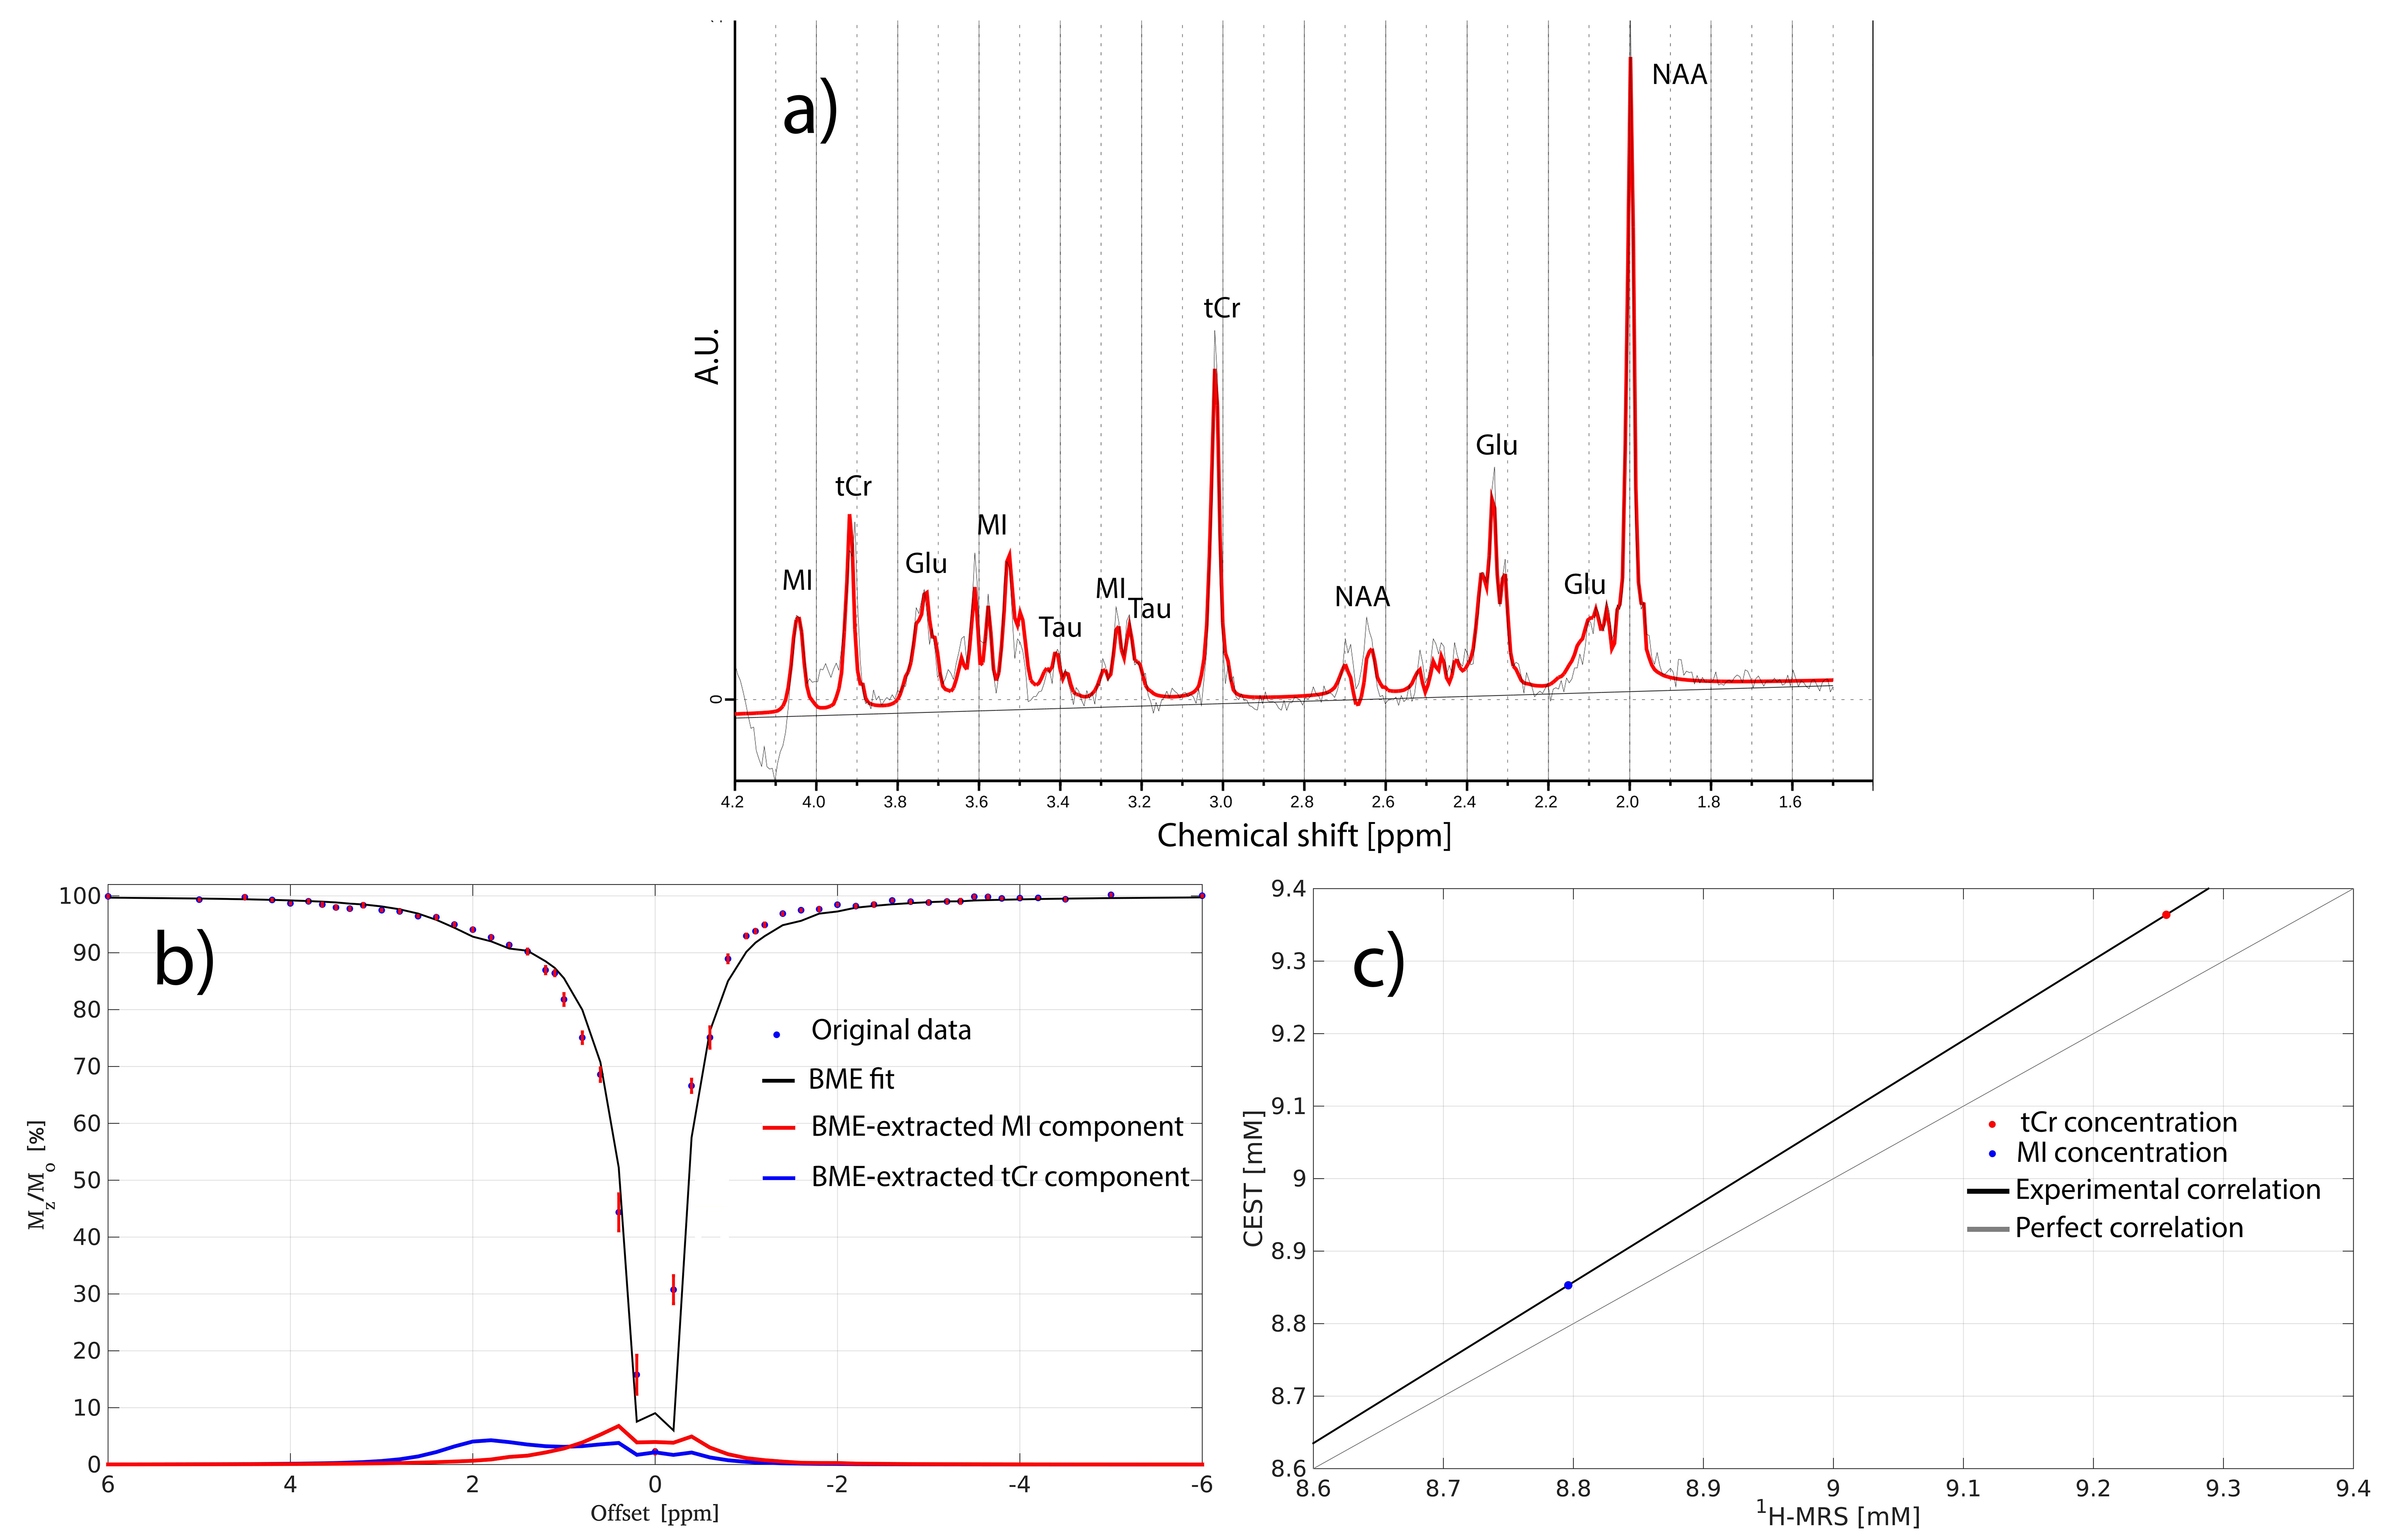
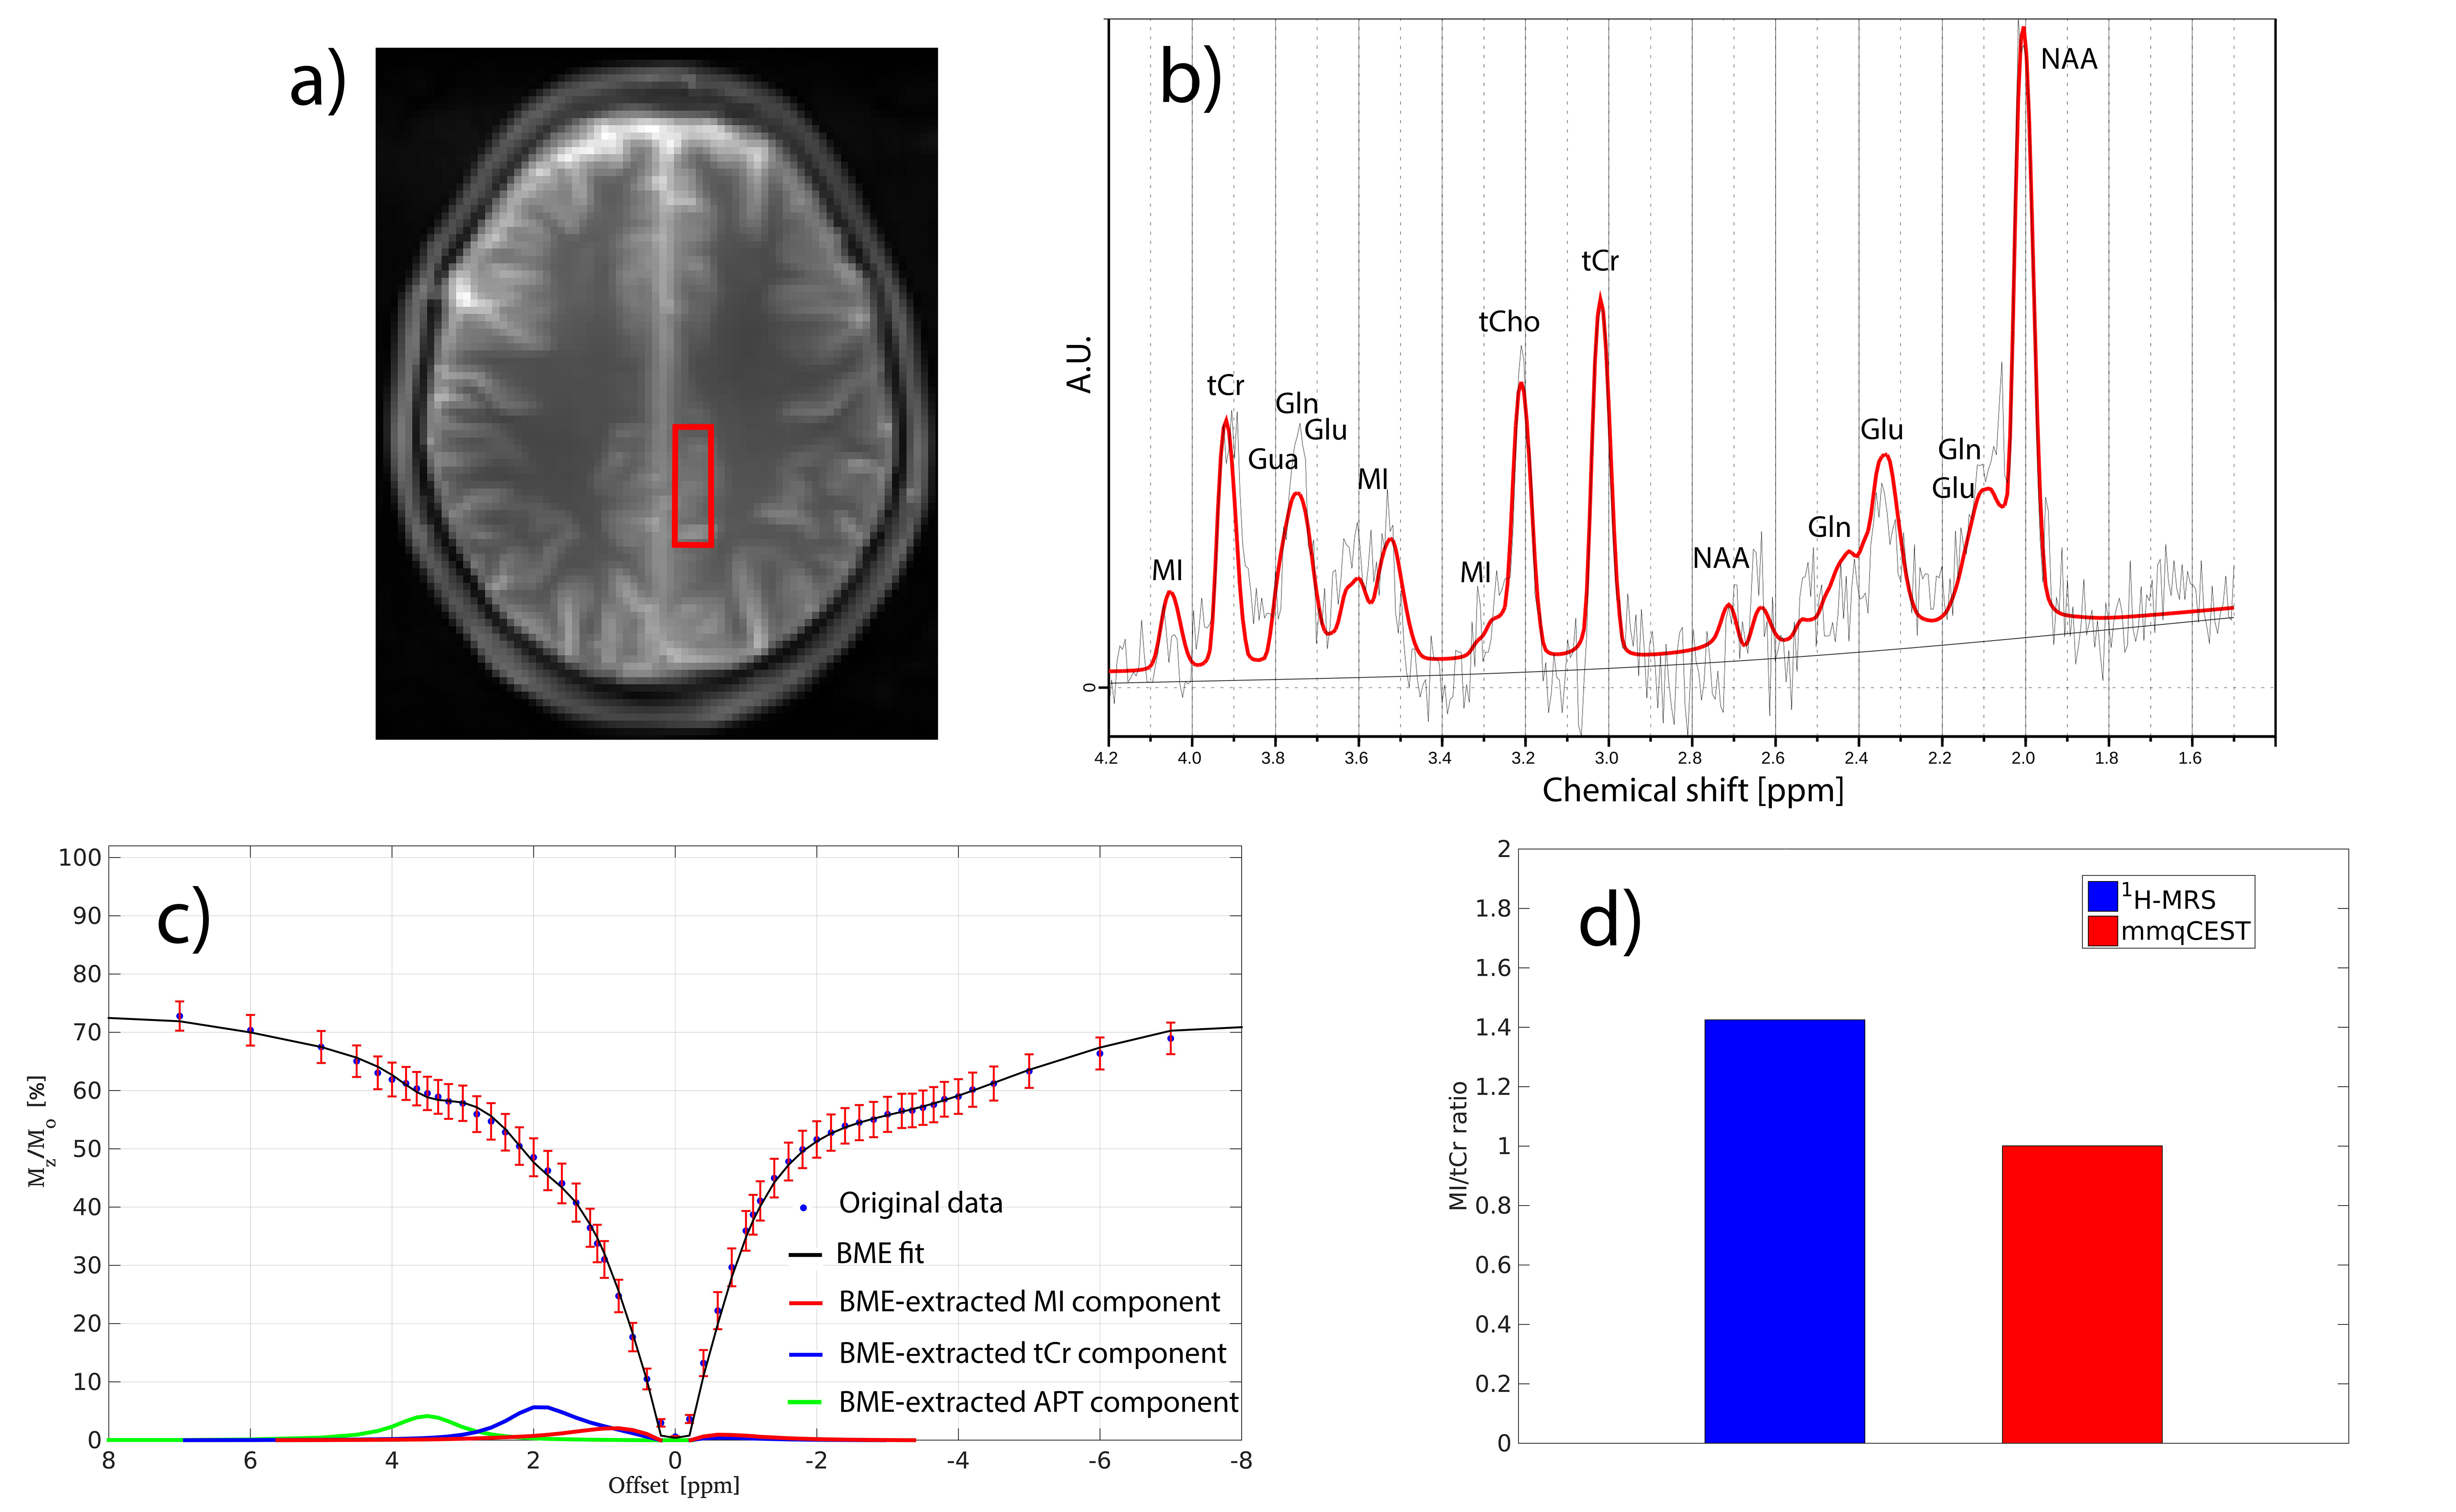
Principle-component-analysis (Fig. 2a) on BME-data revealed that the above mmqCEST-parameters should in theory separate MI, Cr, PCr (not measured as a separate pool as its contribution is low, see Fig. 1), Glu and APT. Measuring this metabolites (MI, tCr, Glu and amides) simultaneously at mmqCEST-parameters, when compared to the optimum parameters per metabolite, has a disadvantage of reduced sensitivity mainly for Glu (55% at pH=7) and APT (39% at pH=7) (Fig. 2b). Fig. 3c shows that MI and tCr concentrations measured in GM-phantom using 1H-MRS (Fig. 3a) and mmqCEST (Fig. 3b) match closely. mmqCEST-quantified Glu-concentration in GM-phantom was 4mM, significantly lower than its phantom concentration of 11.1mM, which is a subject of future investigation.For in-vivo data, the ratio of MI/tCr estimated with mmqCEST is close to 1H-MRS suggesting that the sequence is sensitive enough for simultaneous imaging of both MI and tCr. Our results suggest that two different sets of parameters may be necessary for imaging of major brain metabolites: 1st set for MI, Cr and amides and 2nd set for Glu (requires higher B1 and shorter saturation).Conclusions
To our knowledge, we provide the first example of mmqCEST-MRI imaging in the brain. Our results demonstrate the feasibility of simultaneous-CEST-imaging for at least three brain metabolites (MI, tCr and amides). Future work will involve calibrating our model for absolute-concentrations measurements of MI, tCr, Glu and amides at the field strengths of 3,4.7,7 and 9.4T.Acknowledgements
No acknowledgement found.References
1. Cai K et al. Magnetic resonance imaging of glutamate. Nat Med. 2012;18(2):302–306.
2. Chan KW et al. Natural D-glucose as a biodegradable MRI contrast agent for detecting cancer. Magn Reson Med. 2012;68(6):1764–1773.
3. Walker-Samuel S et al. In vivo imaging of glucose uptake and metabolism in tumors. Nat Med. 2013;19(8):1067–1072.
4. Rivlin M et al. Molecular imaging of tumors and metastases using chemical exchange saturation transfer (CEST) MRI. Sci Rep. 2013;3.
5. van Zijl PC et al. MRI detection of glycogen in vivo by using chemical exchange saturation transfer imaging (glycoCEST). PNAS. 2007;104(11):4359–4364.6. Haris M et al. A technique for in vivo mapping of myocardial creatine kinase metabolism. Nat Med. 2014;20(2):209–214.
7. Haris M et al. In vivo mapping of brain myo-inositol. NeuroImage. 2011;54(3):2079–2085.
8. Ling W et al. Assessment of glycosaminoglycan concentration in vivo by chemical exchange-dependent saturation transfer (gagCEST). PNAS. 2008;105(7):2266–2270.
9. McConnell HM. Reaction rates by nuclear magnetic resonance. J. Chem. Phys. 28, 430-431 (1958).
10. de Graaf RA. In Vivo NMR Spectroscopy: principles and techniques, second ed., John Wiley & Sons Ltd., 2007.
11. Wijnen JP et al. Short echo time 1H MRSI of the human brain at 3T with adiabatic slice-selective refocusing pulses; reproducibility and variance in a dual center setting. J Magn Reson Imaging 2010;31:61-70.
12. Ramadan S et al. Glutamate and glutamine: a review of in vivo MRS in the human brain. NMR Biomed. 2013;26(12):1630-1646.
13. Schaller B. Is the macromolecule signal tissue-specific in healthy human brain? A (1)H MRS study at 7 Tesla in the occipital lobe. Magn Reson Med. 2014;72(4):934-940.
14. Zhou J et al. Using the amide proton signals of intracellular proteins and peptides to detect pH effects in MRI. Nature Med. 2003;9(8):1085–1090.
15. Provencher SW. Estimation of metabolite concentrations from localized in vivo proton NMR spectra. Magn Reson Med. 1993;30(6): 672-679.
16. Bhogal A et al 1H-MRS processing parameters affect metabolite quantification: The urgent need for uniform and transparent standardization. NMR Biomed. 2017;30(11). doi: 10.1002/nbm.3804.
17. Hoogduin H et al. Semi continuous wave CEST with alternating sets of 4 transmit channels at 7T. MAGMA. 2017;30:S1–S152.
18. Keupp J et al. Parallel RF Transmission based MRI Technique for Highly Sensitive Detection of Amide Proton Transfer in the Human Brain at 3T. Proc Intl Soc Mag Reson Med. 2011;19:710.
19. Kim M et al. Water saturation shift referencing (WASSR) for chemical exchange saturation transfer (CEST) experiments. Magn Reson Med. 2009;61(6):1441–1450.
Figures