0415
NaSA-CEST: MR monitoring of brain inflammation using an aspirin metabolite as contrast agent1Johns Hopkins Univeristy, Baltimore, MD, United States, 2Northwest University, Xi'an, Shaanxi, China, 3Xi'an Jiaotong University, Xi'an, Shaanxi, China
Synopsis
Sodium salicylate (NaSA), a nonsteroidal anti-inflammatory drug and the main metabolite of aspirin, can accumulate specifically in inflamed tissue. We investigated the use of NaSA-enhanced CEST MRI for in vivo mapping of brain inflammation, induced by intrastriatal injection of lipopolysaccharide (LPS). Inflamed mice exhibited an increase of ~8% NaSA-CEST signal on the AUC10-30min images, with signals for the ipsilateral striatum significantly higher than those for the mirrored contralateral regions. While for the non-inflamed sham mice, which received saline instead of LPS, no such NaSA-CEST signal could be observed. Our NaSA-CEST approach could possibly lead to the development of inflammation-specific theranostics.
Introduction
Sodium salicylate (NaSA), a nonsteroidal anti-inflammatory drug and the main metabolite of aspirin, can accumulate specifically in inflamed tissue1, where it can exert analgesic, antipyretic, and anti-inflammatory effects. We previously showed that NaSA can accumulate ex vivo in lipopolysaccharide (LPS)-treated mouse organotypic brain slice cultures2, and that NaSA can be detected with Chemical Exchange Saturation Transfer (CEST) MRI in vivo at millimolar concentrations3. In this study, we investigated the use of NaSA-enhanced CEST MRI for in vivo mapping of brain inflammation.Materials and Methods
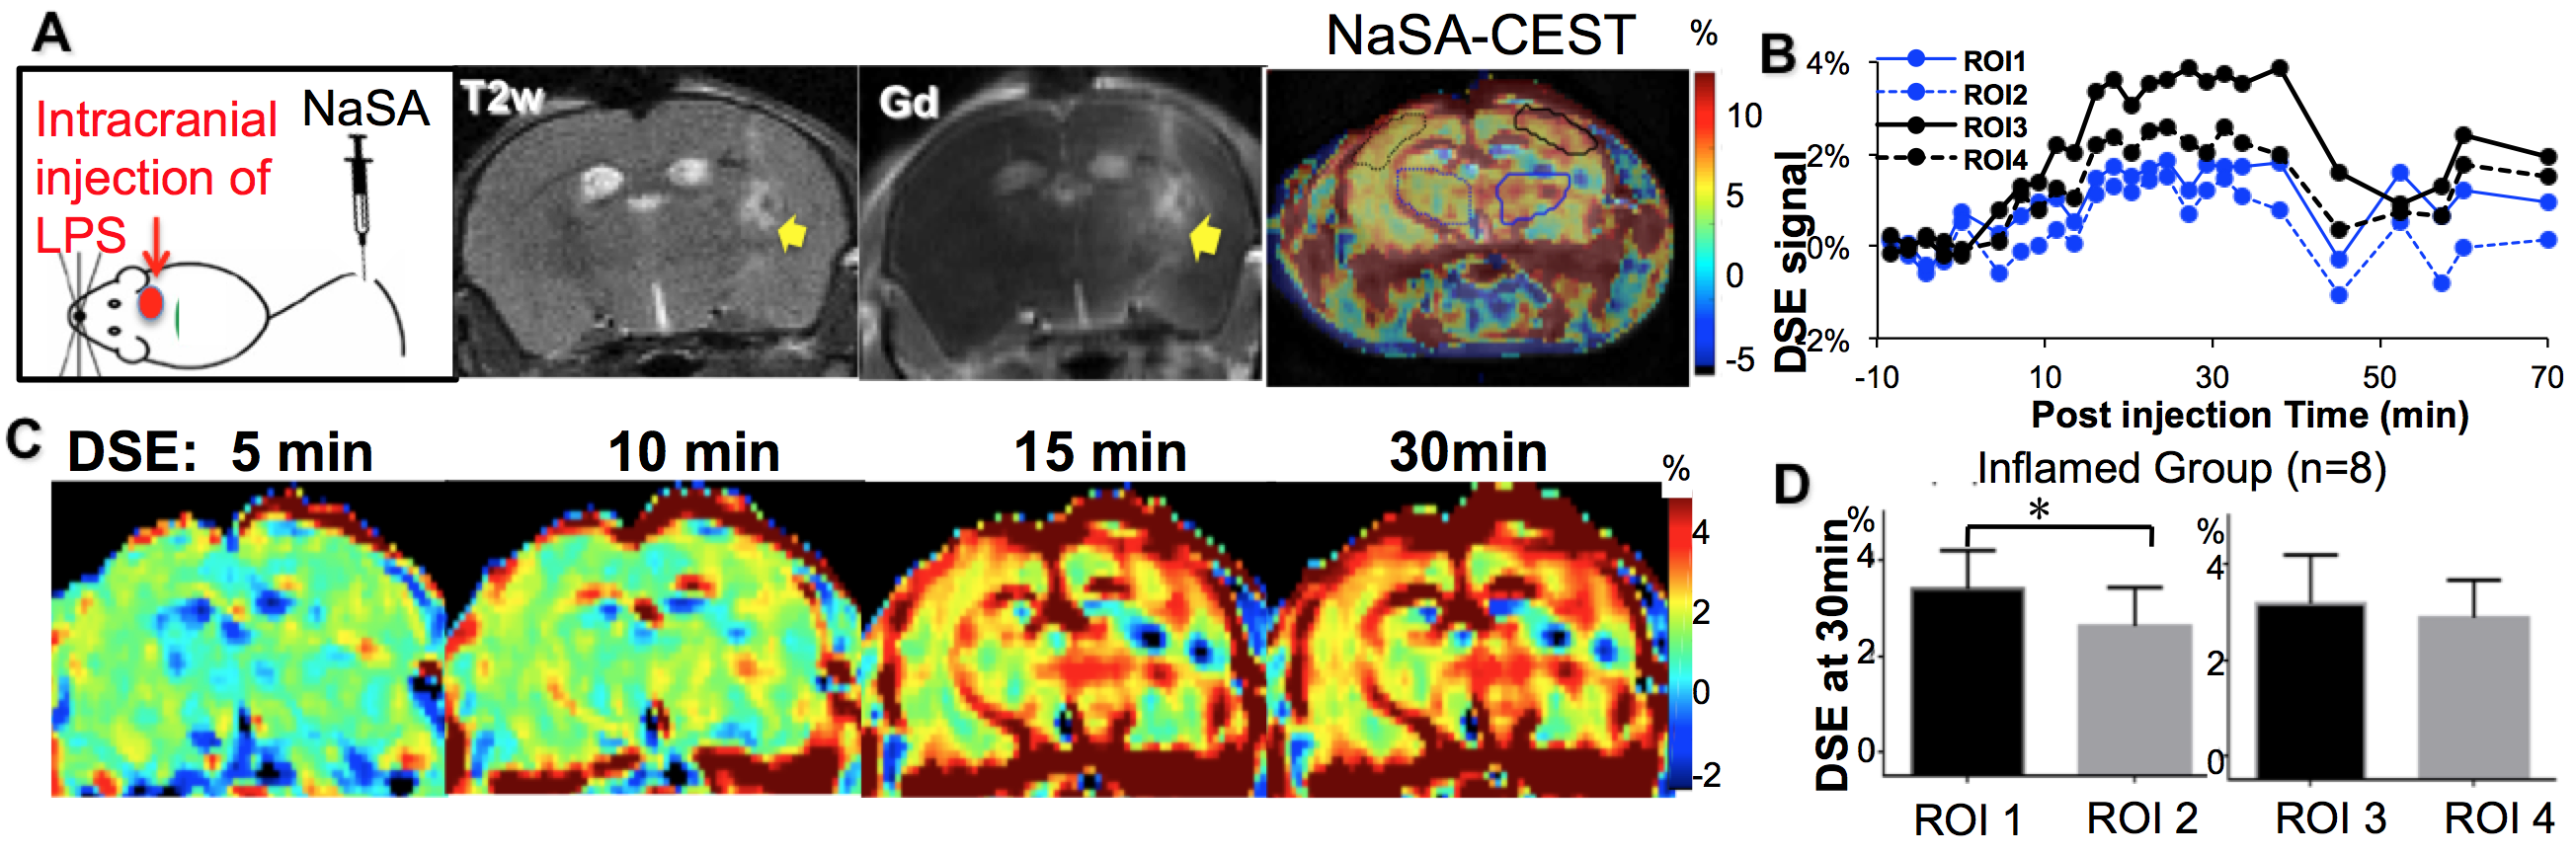
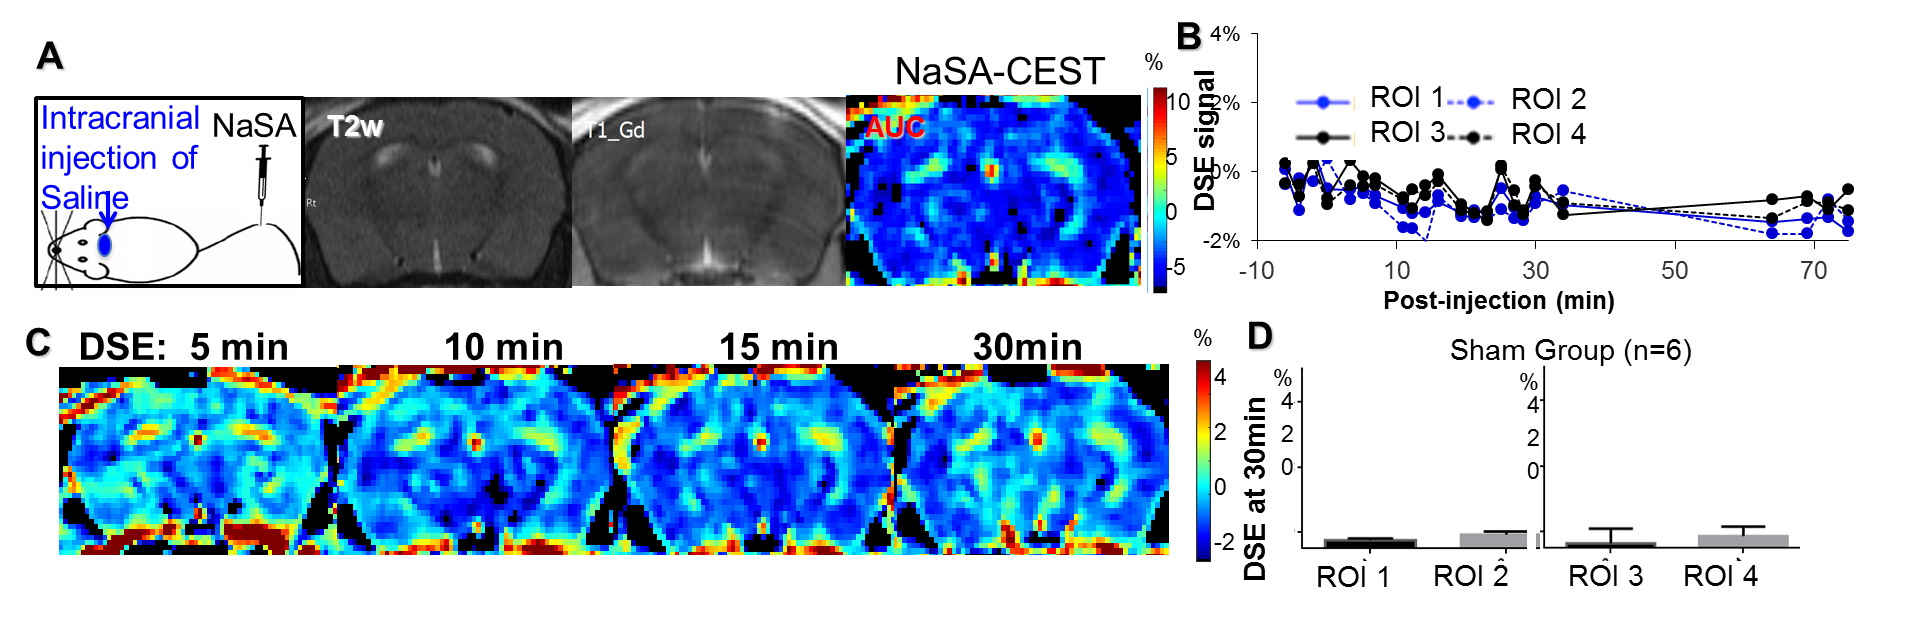
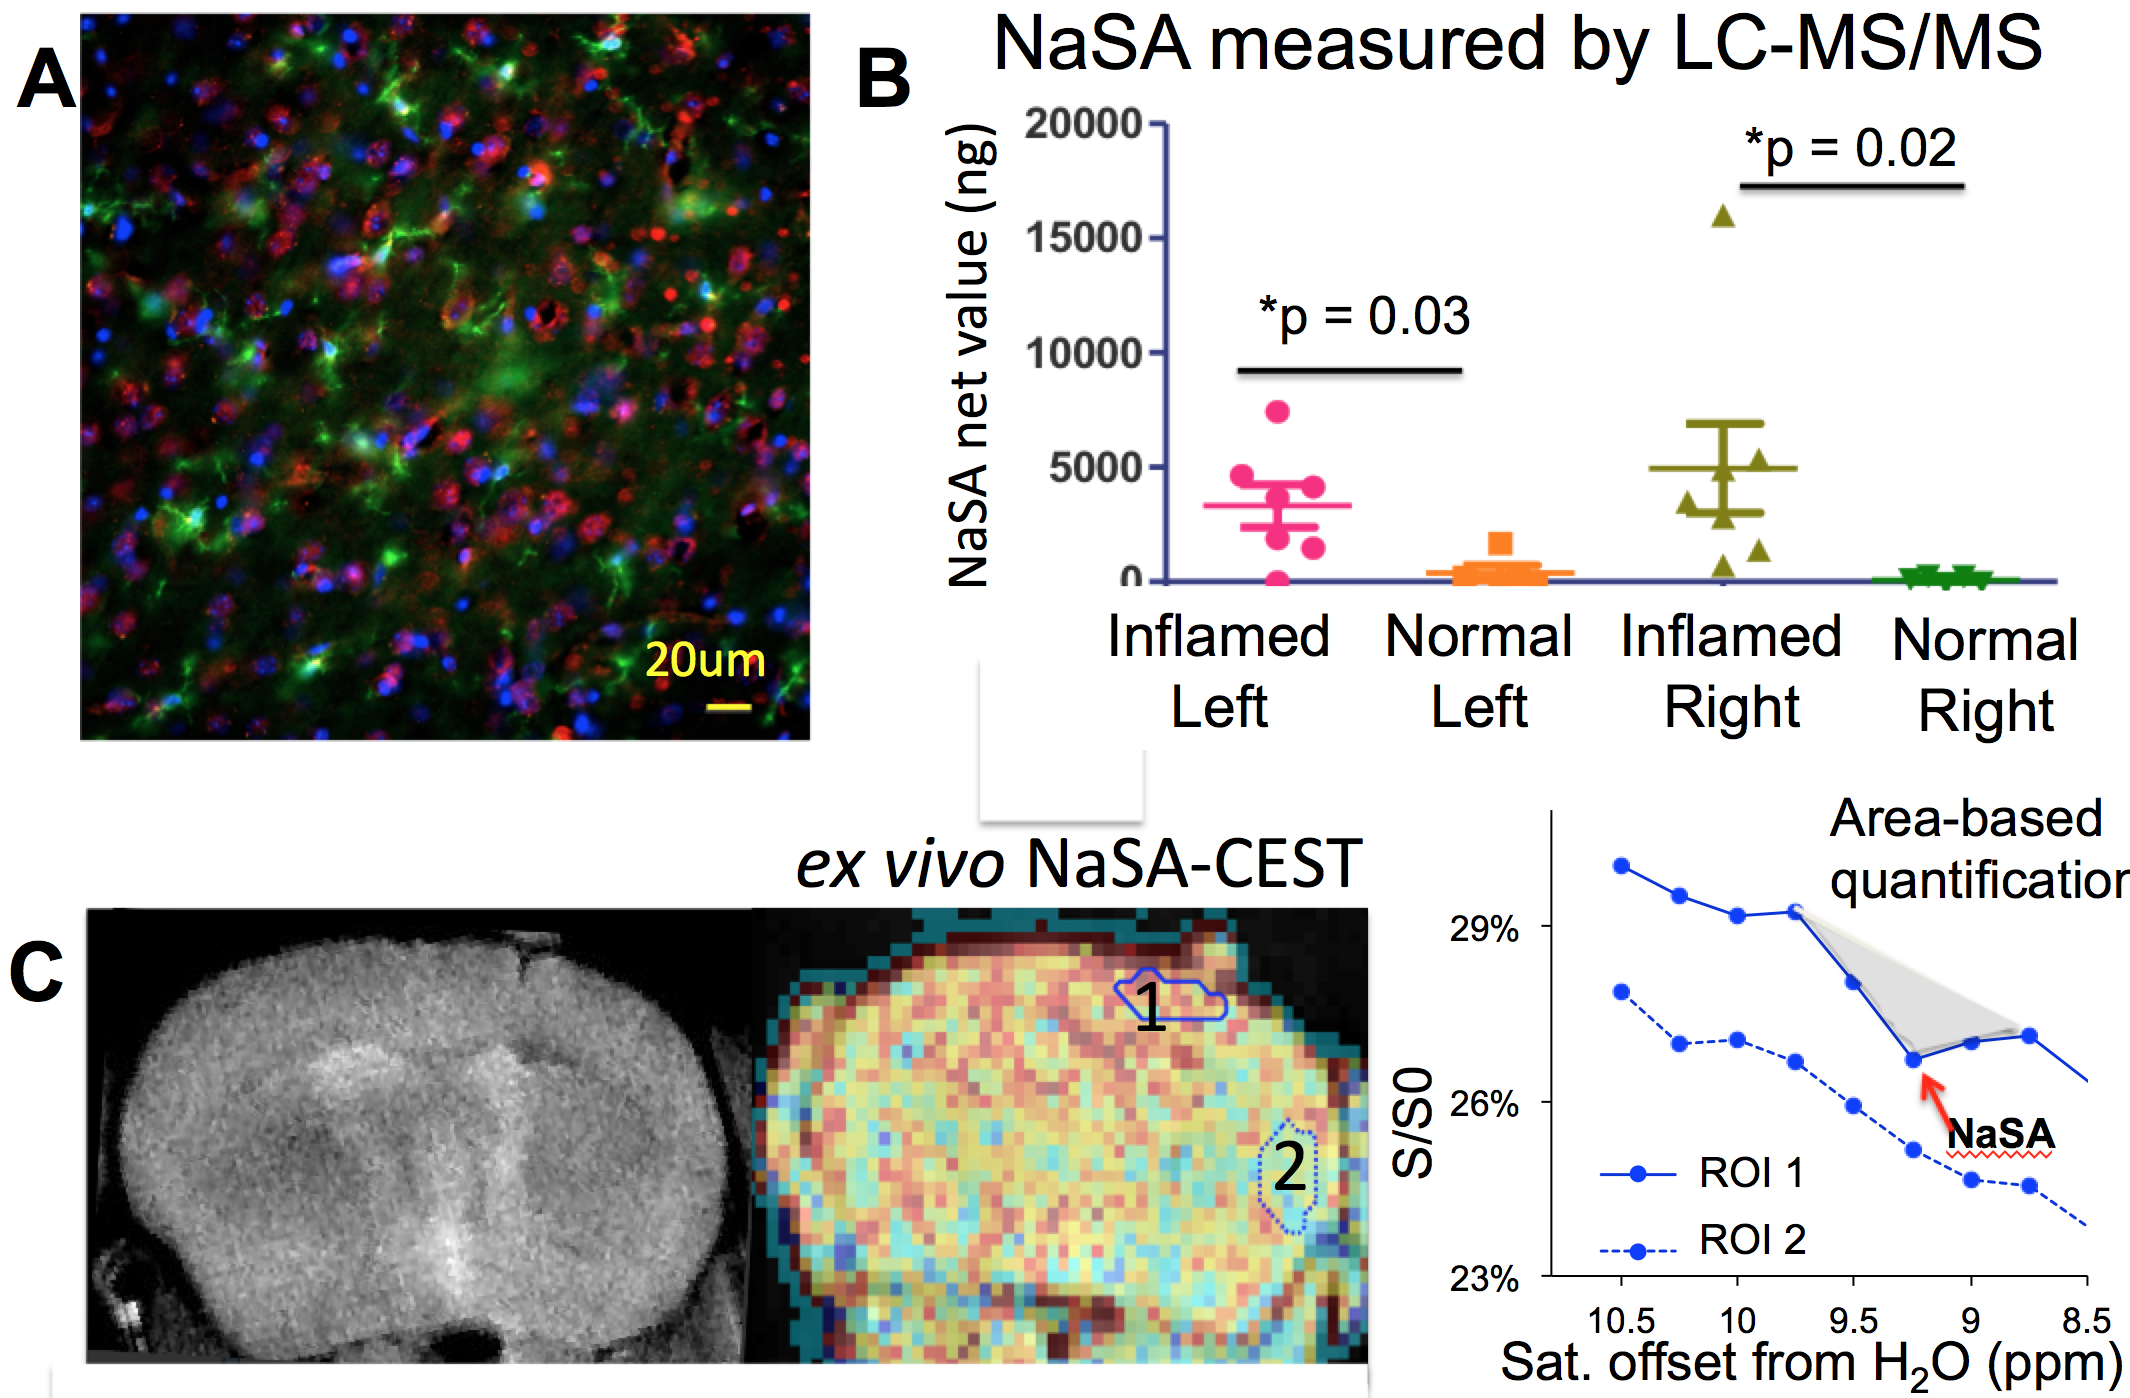
Focal neuroinflammation was induced by a unilateral intrastriatal injection of 2 ul of 5 mg/ml lipopolysaccharide (LPS) in C57/Bl6 mice (8-10 weeks, n=8)4. For another group of mice called sham mice, saline was injected instead of LPS using the same surgical procedure. 24 hours later, mice underwent MR scans on a 11.7 T horizontal scanner, with tail vein injection of 100 ul NaSA as CEST MRI contrast agent (100 mg/Kg body weight). A single-slice RARE sequence was used to acquire pre- and post-NaSA injection images, with a saturation frequency offset at 9.3 ppm (peak frequency for NaSA). Dynamic Salicylate Enhancement (DSE) at time-point t was quantified as DSE = [S(+9.3ppm, t)-S(+9.3ppm, 0)]/S0. DSE images from 10 min to 30 min post-injection of NaSA were pooled to form an area-under-the curve (AUC) image, representing the NaSA-CEST contrast4. At the end of the imaging experiment, Gd-enhanced T1-w images were collected to verify the blood-brain-barrier status. Post-mortem immunohistology was performed using H&E staining, microglia (anti-IBA1) staining, and anti-COX1 staining. To validate the accumulation of NaSA in inflamed brain, ex vivo 11.7 T CEST MRI and LC/MS-MS were performed on brain tissue, excised 30 min post-injection of NaSA. For LC/MS-MS, the two hemispheres were separated, and NaSA was quantified as previously described2. All image analysis was performed using MATLAB, and statistical analysis was performed using Prism and a non-parametric Wilcoxon signed rank test.Results
Inflamed mice exhibited an increase of ~8% NaSA-CEST signal on the AUC10-30min images. The enhanced region was more diffuse than the T2w or Gd-enhanced T1w lesions (Fig. 1A). Regions of interest (ROIs) were plotted on the enhanced cortex and striatum in the ipsilateral hemisphere as well as their contralateral counterparts. The DSE signals for all the four ROIs showed a similar trend, increasing at ~10–15 min post-injection of NaSA and a gradual decay after 40 min (Fig. 1B). The DSE images at different time points are shown in Fig. 1C. For all mice induced with LPS, the DSE signal at 30 min was significantly higher in ROI 1 compared to ROI 2 (Fig. 1D), but not between ROI 3 and ROI 4. In non-inflamed sham mice (Fig.2), which received saline instead of LPS, no NaSA-CEST signal could be observed following NaSA injection, and lesions were seen on T2w- and Gd-enhanced images except for the needle track. Inflammation was validated by immunohistochemical staining, showing the presence of (Iba1+) activated microglia (Fig.3A) and COX1 enzyme, which is one of the main molecules involved in the NaSA pathway. COX1 co-localized with the nuclei of many cell types including microglia, infiltrating lymphocytes, and neurons. LC-MS/MS measurements also indicated that the inflamed mouse brains contained more NaSA than non-inflamed sham mice (Fig.3B) Ex vivo CEST Z-spectra further validated that the region near LPS-injection site displays a peak at the NaSA saturation frequency offset (~9.3 ppm) while the lower cortex region did not (Fig. 3C). Similar to the in vivo DSE signal intensity at 30 min, the ex vivo NaSA-CEST images showed a ~4% enhanced region using the area quantification due to lack of pre-image. We also collected DSE images on the inflamed mice upon i.v. injection of saline, it does not show a signal trend like in Fig.1B. (not shown)Conclusions
Our NaSA-CEST MRI approach for mapping local inflammation uses a non-metallic, organic metabolite of an over-the-counter available anti-inflammatory agent (aspirin). These initial results, if further validated, could possibly lead to the development of inflammation-specific theranostics, where NaSA and similar compounds may diagnose and suppress inflammation simultaneously.Acknowledgements
NIH R21EB020905References
1. Brune K. Biodistribution of salicylates: a clue to the understanding of some effects and side effects. Agents and actions Supplements 1977;2:163-177.
2. Schaffhauser M. MA, Marx J, Bulte J, McMahon M, Fatemi A, Song X. Assessment of salicylate accumulation in LPS-treated organotypic mouse brain slices using CEST-MRI” , New York City. 2016; New York City. p 2493111.
3. Song X, Walczak P, He X, Yang X, Pearl M, Bulte JW, Pomper MG, McMahon MT, Janowski M. Salicylic acid analogues as chemical exchange saturation transfer MRI contrast agents for the assessment of brain perfusion territory and blood-brain barrier opening after intra-arterial infusion. J Cereb Blood Flow Metab 2016;36(7):1186-1194.
4. Xu X, Chan KW, Knutsson L, Artemov D, Xu J, Liu G, Kato Y, Lal B, Laterra J, McMahon MT, van Zijl PC. Dynamic glucose enhanced (DGE) MRI for combined imaging of blood-brain barrier break down and increased blood volume in brain cancer. Magn Reson Med 2015;74(6):1556-1563.
Figures