0413
Separation of the contribution of protein concentration and pH to measured APT signal changes in a preclinical model of brain metastases1Wellcome Centre for Integrative Neuroimaging, FMRIB, Nuffield Department of Clinical Neurosciences, University of Oxford, Oxford, United Kingdom, 2CRUK & MRC Oxford Institute for Radiation Oncology, University of Oxford, Oxford, United Kingdom, 3Institute of Biomedical Engineering, University of Oxford, Oxford, United Kingdom
Synopsis
Amide proton transfer (APT) studies usually attribute the altered APT signal in tumours to an increased cytosolic protein concentration. However, other concomitant changes in pH, T1, or water content make absolute quantification of protein concentration or pH from APT signals challenging. In this study, we separate the contributions of protein concentration and pH to APT signal differences in a preclinical model of brain metastases by combining in vivo and ex vivo measurements. We show that 66% of the observed APT signal difference was caused by protein concentration alterations, with the remaining 34% signal change reflecting an increase in tumour pH.
Introduction
Amide proton transfer (APT) MRI studies have usually attributed the altered APT signal in tumours to an increased cytosolic protein concentration[1,2]. However, other studies have instead attributed APT MRI signal changes in tumours to T1 relaxation time or water content differences[3]. Additionally, the metabolic phenotype of tumour cells tends to alter intra- and extracellular pH in their microenvironment[4]. These factors combine to make APT MRI of tumours at best a protein-weighted imaging modality, with limited scope for absolute quantification of protein concentration or pH changes, until the complex interplay between these four factors can be deconvolved.
In this study, we aim to separate the contributions of protein concentration and pH to APT signal differences in tumours using a preclinical model of brain metastases. In vivo APT MRI and ex vivo tissue characterisation were used in combination to elucidate the relative contribution of protein concentration and pH changes to measured APT signals.
Methods
Brain metastasis tumours were induced in 15 BDIX rats by intracerebral injection of ENU1564 cells. MRI was performed four weeks post-injection at 9.4T, consisting of CEST MRI (2s pulsed saturation, 40ms Gaussian, flip angle 184°, duty cycle 50%, equivalent CW B1 0.55µT), followed by post-Gd T1-weighted imaging to evaluate tumour burden. CEST data were analysed using BayCEST in FSL[5] and the APT effect quantified using APTR*, which is sensitive only to amide concentration and exchange rate[6]. Regions of interest for infiltrating tumour rim, necrotic tumour core, and contralateral hemisphere were used to calculate the relative APTR* as rAPTR*=APTR*(Tumour)/APTR*(Healthy).
Following MRI, rats (n=10) were sacrificed, their brain tissue fixed by transcardial perfusion with periodate-lysine-paraformaldehyde (PLP) containing 0.025% glutaraldehyde, and the tissue cryosectioned for histological imaging. The remaining 5 rats were sacrificed and biopsies of the tumour and contralateral brain taken for subcellular fractionation and protein concentration quantification by BCA assay.
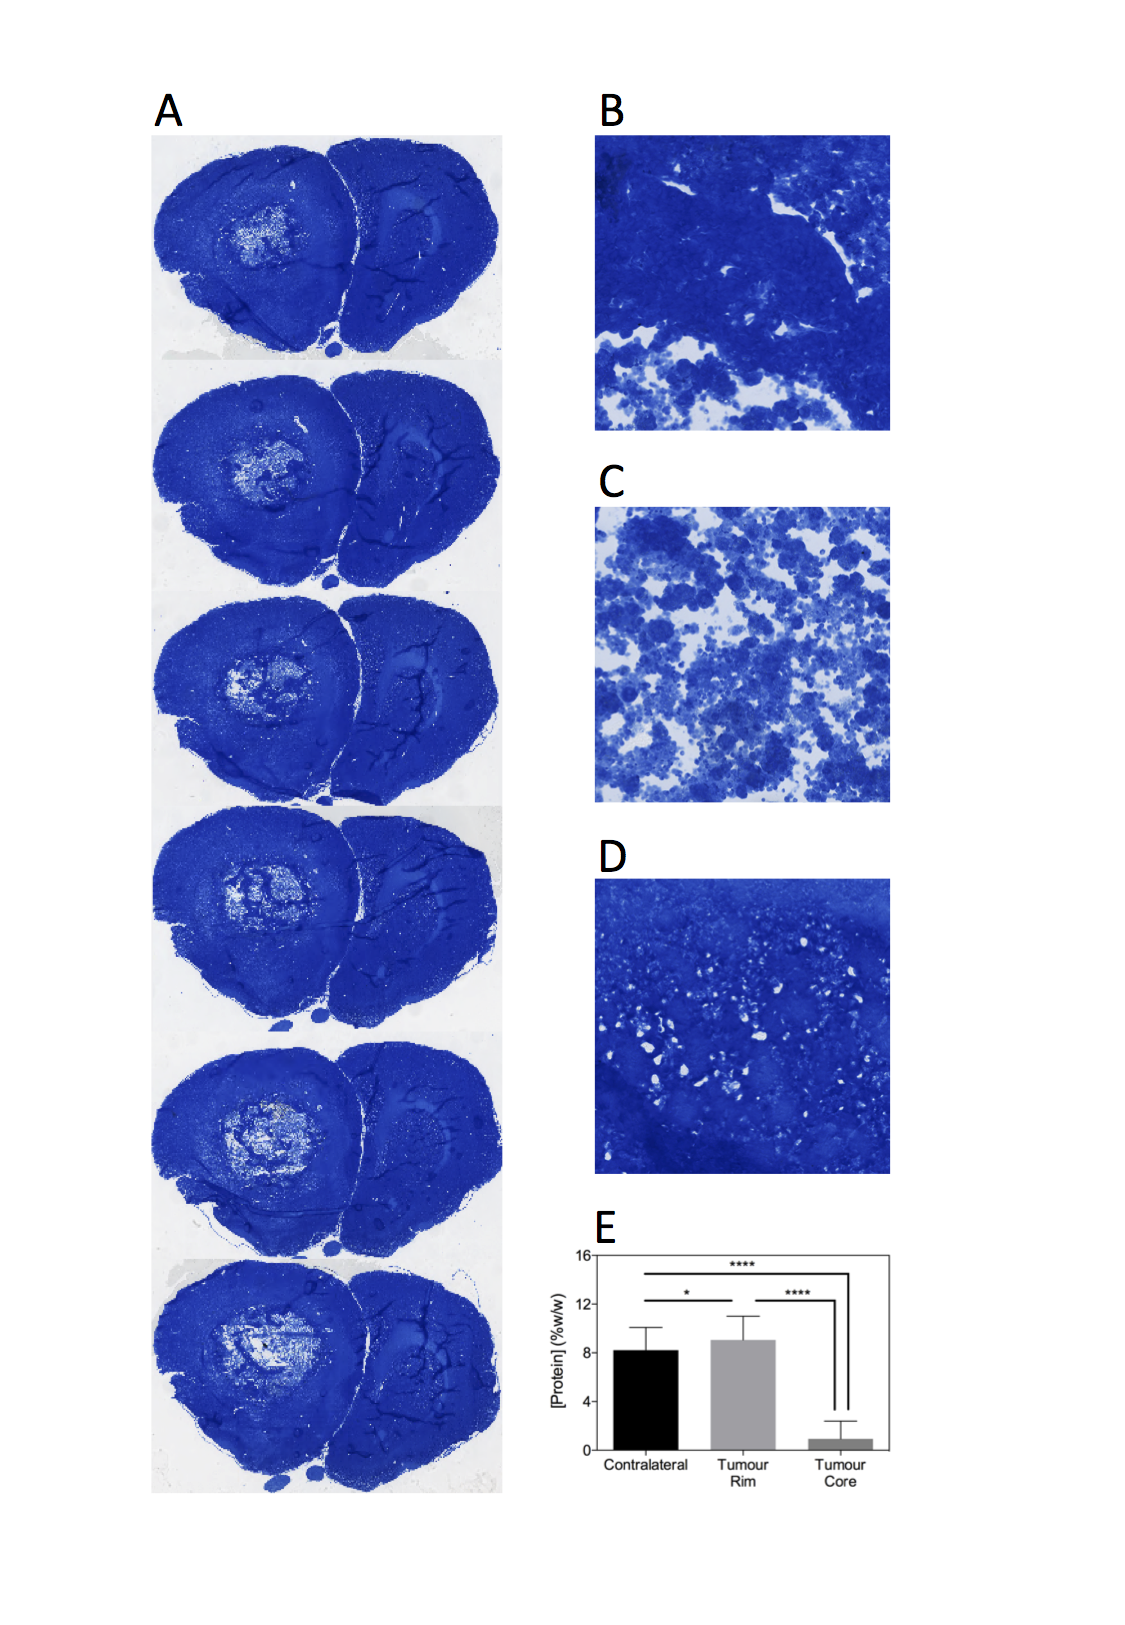
Histological imaging of protein concentration was achieved by staining the fixed and cryosectioned tissue with Coomassie[7]. To convert the blue stain from Coomassie into protein concentration measurements, homogenised samples of brain tissue were processed in a similar way to experimental tissue and serially diluted. The protein concentration of the dilutions was measured by both BCA assay and Coomassie staining to produce a standard curve.
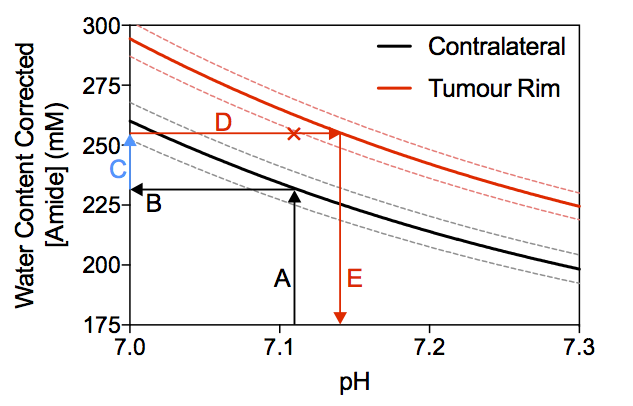
Ex vivo measurements of protein concentration and in vivo APTR* measurements were used in an isoAPTR* analysis[8] to determine the contribution of protein concentration to measured APTR* differences between tumour and normal tissue. In addition, isoAPTR* enabled estimation of tumour pH, assuming a healthy pH of 7.1 and a protein concentration difference between healthy and tumour tissue measured by Coomassie.
Results
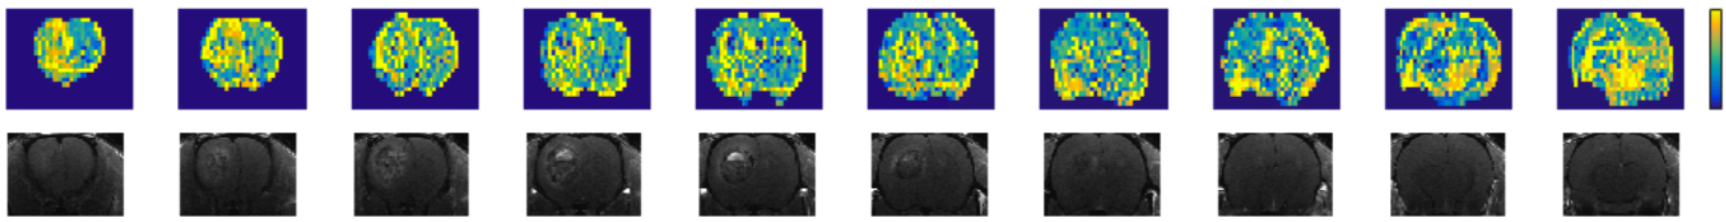
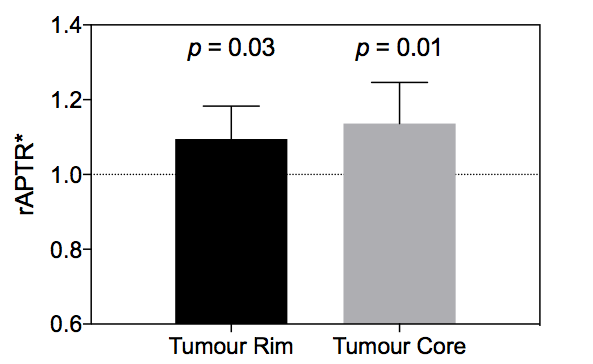
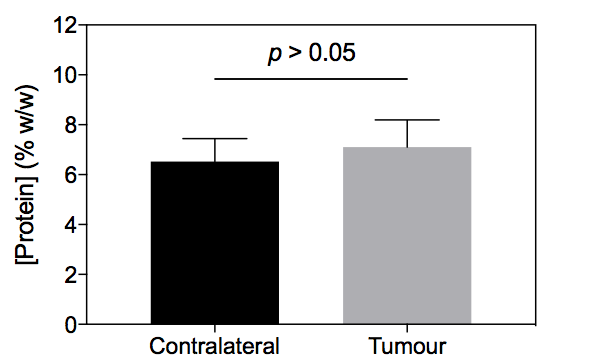
Post-Gd T1-weighted imaging shows heterogeneity typical of human disease, with an infiltrating rim and necrotic core (Figure 1). rAPTR* in both rim and core ROIs were significantly greater than 1, indicating increased APTR* values in tumour areas (Figure 2, rAPTR*(Rim)=1.10±0.09, rAPTR*(Core)=1.14±0.01, mean±95%CI). BCA-derived protein concentrations from the cytoplasmic fraction of tumour (7.0±1.0%w/w, mean±s.d.) and healthy tissue (6.5±0.9%w/w, mean±s.d.) showed no significant difference (unpaired t-test, p=0.35, Figure 3). The heterogeneity present in the post-Gd T1-weighted MRI was evident in the Coomassie histological imaging of protein concentration. A significant increase in protein concentration in the tumour rim was found (healthy 8±2%w/w, tumour 9±2%w/w, mean±s.d., p<0.05, Figure 4). Using the isoAPTR* method with the healthy and tumour tissue measured APTR* (healthy 3.43±0.10%M0, tumour 3.77±0.09%M0, mean±95%CI) and the measured protein concentration increase in the tumour rim (from Coomassie measurements), it was found approximately 66% of the APTR* change was caused by protein concentration (red cross in Figure 5). The remaining 34% signal change is owing to an increase in tumour pH to 7.14±0.01.Discussion
The increased APTR* in tumour rim and core agrees with previous clinical and preclinical APT MRI studies of tumours[2,3]. The non-significant difference in protein concentration of the cytoplasmic fraction of tumour and healthy tissue measured by BCA assay is likely a consequence of a mixture of tissue populations introducing a bias to the measurement. The Coomassie staining, on the other hand, accurately reflects the spatial heterogeneity of the tumour tissue, though in the tumour core it is likely that the proteins present in vivo have been lost during the tissue cryosectioning process since these tissue areas are acellular. The pH estimated using isoAPTR* is likely reflective of the intracellular space since APT MRI is weighted to this compartment. The pH estimated here agrees with previous measurements of an intracellular alkalosis in tumour cells[9].Conclusion
This study combined in vivo APT measurements with ex vivo histological measurements of protein concentration to determine that the proportion of APT signal change originating from changes in protein concentration is ca. 66%, with the remaining 34% originating from changes in tumour pH.Acknowledgements
Funding was provided by a Medical Research Council Studentship, the EPSRC & CRUK Cancer Imaging Centre - Oxford, and the Oxford NIH Biomedical Research Centre. The Wellcome Centre for Integrative Neuroimaging is supported by core funding from the Wellcome Trust.References
[1] Zhou, J., Payen, J.F., Wilson, D.A., et al. "Using the amide proton signals of intracellular proteins and peptides to detect pH effects in MRI" Nat. Med. 2003; 9(8): 1085-1090
[2] Yan, K., Fu, Z., Yang, C., et al. "Assessing Amide Proton Transfer (APT) MRI Contrast Origins in 9 L Gliosarcoma in the Rat Brain Using Proteomic Analysis" Molecular Imaging and Biology 2015; 17(4): 479-487
[3] Xu, J., Zaiss, M., Zu, Z., et al. "On the origins of chemical exchange saturation transfer (CEST) contrast in tumors at 9.4 T" NMR Biomed. 2014; 27(4): 406-416
[4] Hanahan, D., Weinberg, R.A. "Hallmarks of cancer: The next generation" Cell 2011; 144(5): 646-674
[5] Chappell, M.A., Donahue, M.J., Tee, Y.K., et al. "Quantitative Bayesian model-based analysis of amide proton transfer MRI" Magn. Reson. Med. 2013; 70(2): 556-567
[6] Ray, K.J., Larkin, J.R., Tee, Y.K., et al."Determination of an optimally sensitive and specific chemical exchange saturation transfer MRI quantification metric in relevant biological phantoms" NMR Biomed. 2016; 29(11): 1624-1633
[7] Miller, J.A., Curella, P., Zahniser, N.R. "A new densitometric procedure to measure protein levels in tissue slices used in quantitative autoradiography" Brain Res. 1988; 447(1): 60-66
[8]Ray, K.J., Larkin, J.R., Chappell, M.A., Sibson, N.R. "isoAPTR* - a novel method to measure tumour pHi using CEST MRI" Proc. Intl. Soc. Magn. Reson. Med. 2017; #1972
[9] Bhujwalla, Z.M., Aboagye, E.O., Gillies, R.J., et al. "Nm23-transfected MDA-MB-435 human breast carcinoma cells form tumors with altered phospholipid metabolism and pH: a 31P nuclear magnetic resonance study in vivo and in vitro." Magn. Reson. Med. 1999; 41(5): 897-903
Figures