0412
Amide proton transfer (APT) imaging of benign ovarian cystic lesions1Department of Clinical Radiology, Kyushu University, Fukuoka, Japan, 2Department of Obstetrics and Gynecology, Kyushu University, Fukuoka, Japan, 3Philips Research, Hamburg, Germany
Synopsis
It is important to diagnose benign ovarian cystic lesions as early and correctly as possible because some types of lesions have malignant potential. The objective of our study is to investigate whether amide proton transfer (APT) imaging is useful for evaluation of benign ovarian cystic lesions. We compared the APT signal in three different benign ovarian cystic lesions using three different durations of presaturation pulse.
Purpose
Serous cystadenoma (SCA), mucinous cystadenoma (MCA) and functional cyst (FC) are the most common types benign ovarian cystic lesions which do not contain fat or hemorrhagic component. It is difficult to differentiate them since they frequently appear as nonspecific cysts in conventional imaging techniques, however, SCA and MCA have malignant potential and can require surgical treatment whereas FC is basically harmless and can be observed1. Therefore, further imaging technique development to evaluate these nonspecific ovarian cystic lesions is needed to enable early therapeutic intervention. Amide proton transfer (APT) imaging is a novel magnetic resonance imaging (MRI) technique that reflects concentration of mobile proteins/peptides2. Previous studies have reported the clinical utility of APT imaging to estimate the aggressiveness or treatment effect of solid tumors3-6. Although there has been no report discussing the clinical potential of APT imaging for the evaluation of ovarian nor cystic lesion, we hypothesized that APT imaging might be useful for non-invasive histological diagnosis of these ovarian cystic lesion since the concentration of mobile proteins/peptides is assumed to be different among the cystic lesions. Our purpose was to investigate advantage of APT imaging in evaluation of ovarian cystic lesion.Materials and Methods
A total of 17 lesions in 16 patients (age = 46.8 ± 17.0 years) with benign ovarian cystic lesion were enrolled in the study (SCA: N=4, MCA: N=8, FC: N=5). All SCA and MCA cases were histologically confirmed after surgical resection. One FC case was also resected with uterine lesion and histologically confirmed. Other FC cases were confirmed by shrinkage on a follow-up scan. All MRI sessions were conducted in a 3.0-Tesla clinical MRI system (Achieva 3.0T TX, Philips Healthcare, Best, the Netherlands). T1-weighted images (T1WI), T2-weighted images (T2WI) and diffusion-weighted images (DWI) (b=0 and 1000 s/mm2) were obtained as a part of our clinical routine. On a single 5mm-slice delineating the maximum diameter of the lesion, APT imaging was performed as follows: 2D-TSE images with driven equilibrium refocusing were obtained following a presaturation pulse (B1 = 2.0 μT, duration = 0.5, 1.0 and 2.0 s) which was applied at 25 frequency offsets from 6 to -6 ppm with an interval of 0.5 ppm. Other imaging parameters were: TR/TE = 5000/6 ms, FOV = 230×230 mm2, resolution = 1.8×1.8×5 mm3. A control image was obtained with the presaturation pulse at -1560 ppm. δB0 maps were acquired separately for a δB0 correction. The z-spectra were fitted through all offsets on a pixel-by-pixel basis followed by the correction for δB0 inhomogeneity. MTR asymmetry (MTRasym) was defined as: MTRasym = Ssat(−offset)/S0−Ssat(+offset)/S0, where Ssat and S0 are signal intensities (SIs) on the images with presaturation pulse at 6 to -6 ppm and control (-1560 ppm), respectively. The calculated MTRasym map at the offset of 3.5 ppm is called the APT-weighted image. APT signals with presaturation pulse length of 0.5, 1.0 and 2.0 s were defined as APT0.5, APT1.0 and APT2.0, respectively. Signal intensity ratios of cyst to muscle calculated on T1WI and T2WI were defined as T1- and T2-ratios. Apparent diffusion coefficient (ADC) maps were generated referring to the SIs of DWI with b-values of 0 and 1000 s/mm2. Regions-of-interest were carefully placed within the cysts adjacent to their edges.Results
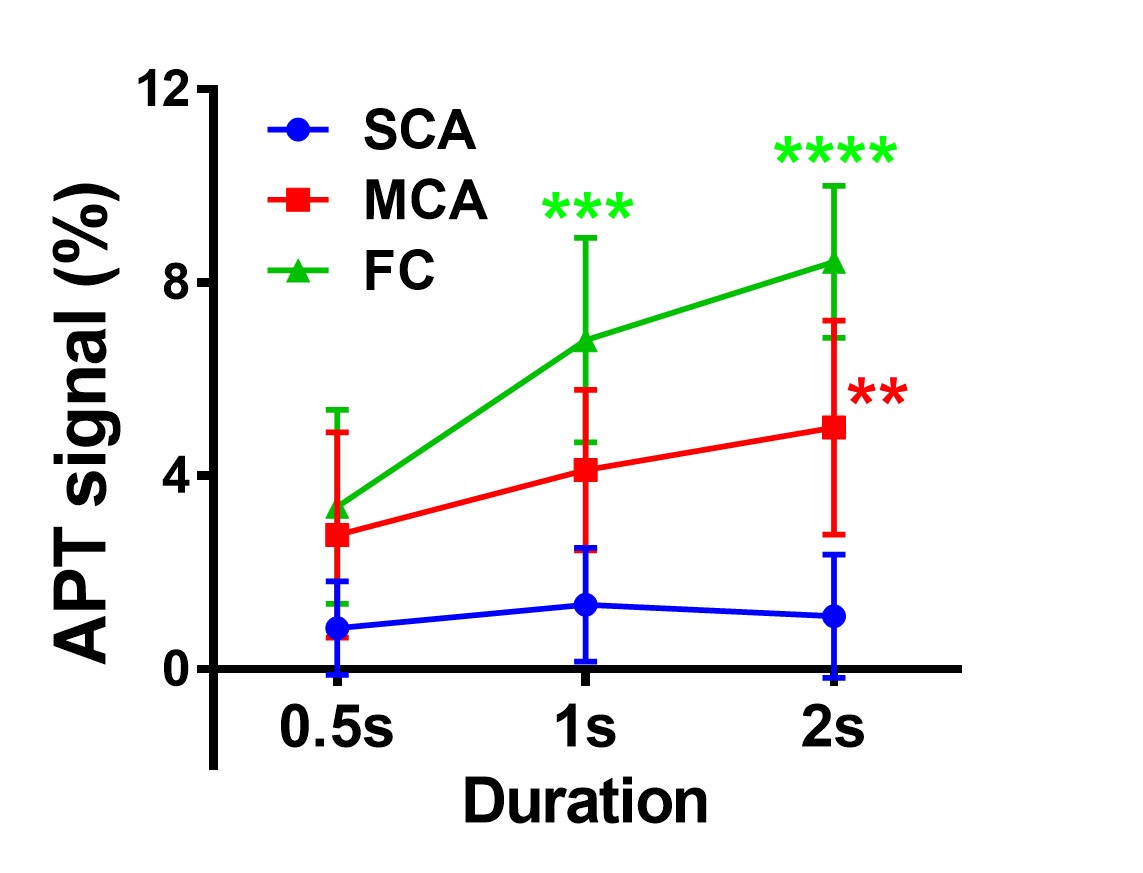
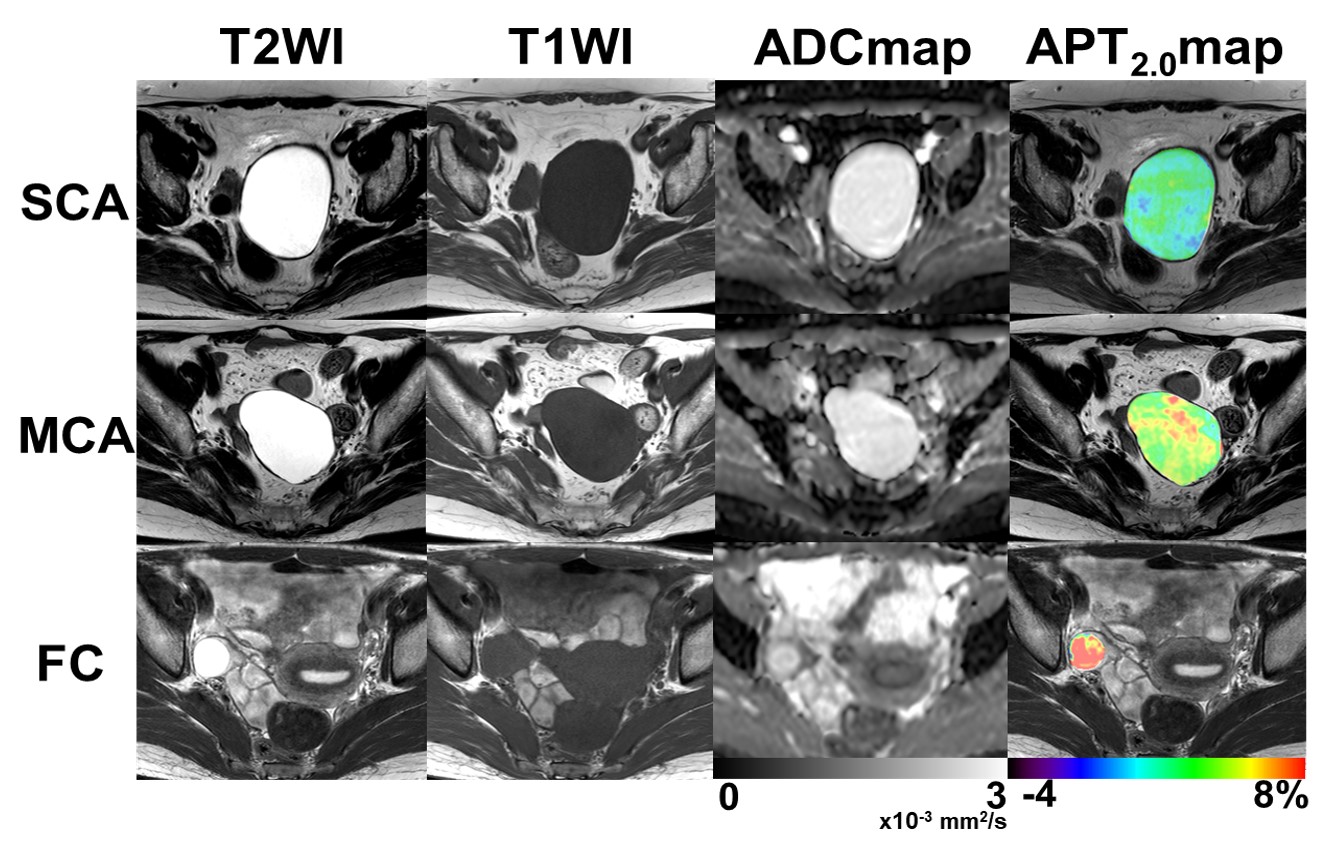
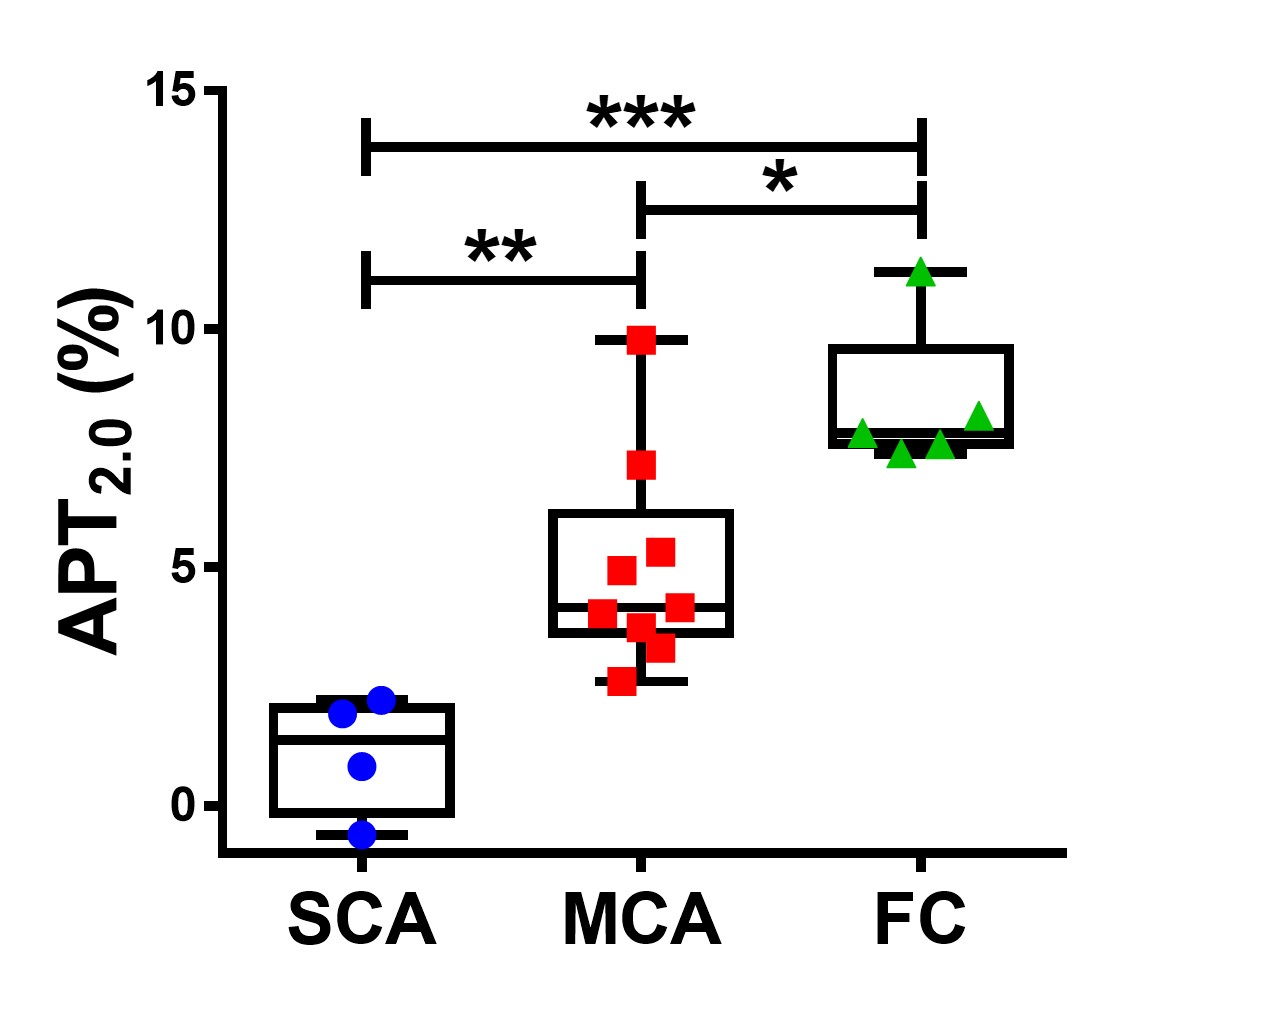
As the duration of presaturation pulse became longer, APT signals significantly increased in MCA and FC (Fig. 1). Figure 2 shows the typical T2WI, T1WI, ADC map and APT2.0 map in each group where the APT2.0 values are obviously different between the groups. The APT2.0 values were 1.1 ± 1.3% in SCA, 5.0 ± 2.2% in MCA and 8.4 ± 1.6% in FC. Significant differences in APT2.0 were observed between SCA and MCA (P < .01) and MCA and FC (P < .05), as well as between SCA and FC (P < .001, Fig. 3). On the other hand, there was no significant difference in T1-ratio, T2-ratio and ADC value among the groups.Discussion and Conclusion
The present study indicated that 1) higher APT signal can be observed as the duration of presaturation pulse becomes longer and that 2) APT signal showed significant difference between each pair when using longer duration of presaturation pulse on benign ovarian cystic lesions. Unlike solid tumor, liquid in the cystic lesion is less likely to be influenced by the magnetization transfer effect or nuclear Overhauser effect7. Therefore, APT imaging in the cystic lesion may reflect concentration of mobile protein or peptide more directly. Using longer presaturation pulse as possible, APT imaging may have a potential to provide an early and correct diagnosis without additional follow-ups on ovarian cystic lesions.Acknowledgements
No acknowledgement found.References
1.Lalwani N, Prasad SR, Vikram R, et al. Histologic, molecular, and cytogenetic features of ovarian cancers: implications for diagnosis and treatment. Radiographics. 2011;31(3):625-646
2. Zhou J, Payen JF, Wilson DA, et al. Using the amide proton signals of intracellular proteins and peptides to detect pH effects in MRI. Nat Med 2003;9(8):1085-1090
3. Togao O, Hiwatashi A, Yamashita K, et al. Amide proton transfer imaging of adult diffuse gliomas: correlation with histopathological grades. Neuro Oncol, 2014. 16(3): 441-448.
4. Sagiyama K, Mashimo T, Togao O, et al. In vivo chemical exchange saturation transfer imaging allows early detection of a therapeutic response in glioblastoma. Proc Natl Acad Sci U S A. 2014;111(12):4542-4547.
5. Takayama Y, Nishie A, Togao O, et al., Amide proton transfer (APT) magnetic resonance imaging of prostate cancer: comparison with Gleason scores. MAGMA, 2016. 29(4): 671-679.
6. Takayama Y, Nishie A, Togao O, et al. Amide Proton Transfer MR Imaging of Endometrioid Endometrial Adenocarcinoma: Association with Histologic Grade. Radiology. 2017; 30:170349. [Epub ahead of print]
7. Vinogradov E, Sherry AD, Lenkinski RE. CEST: from basic principles to applications, challenges and opportunities. J Magn Reson. 2013; 229:155-172.
Figures