0411
Quantifying the glucose CEST Effect in Patients with oropharyngeal squamous cell carcinoma at 3T in vivo using an oxygen challenge1Wellcome Centre for Integrative Neuroimaging, FMRIB, University of Oxford, Oxford, United Kingdom, 2Department of Oncology, University of Oxford, Oxford, United Kingdom, 3Oxford University Hospitals NHS Foundation Trust, University of Oxford, Oxford, United Kingdom, 4Institute of Biomedical Engineering, Department of Engineering Science, University of Oxford, Oxford, United Kingdom, 5MR Applied Sciences Lab, GE Healthcare, Menlo Park, CA, United States
Synopsis
Characterizing tumor treatment response is an ongoing radiological challenge as both the anatomical and physiological characteristics of the tumor are changing as the treatment course progresses. GlucoCEST imaging may provide an avenue towards understanding the evolving tumor metabolic environment over the course of treatment. In this preliminary assessment, we show that an oxygen challenge can highlight changes in the vasculature of tumors post radiotherapy.
Introduction
Chemical Exchange Saturation Transfer (CEST) is an MRI technique sensitive to the presence of low concentration mobile protons exchanging with water, such as the hydroxyl molecules within glucose. Studies have recently shown that measuring glucose (glucoCEST) uptake in tumors in animal models1 and in humans2 can provide indices of the metabolic activity within the tumor, thus providing a measure for tumor response to treatment, however, no human studies have evaluated the longitudinal glucoCEST effect in response to therapy.
The glucoCEST effect is also sensitive to changes in T1 and T2, as these properties will influence the extent of direct water saturation effects on the CEST z-spectrum3,4. To this end, we introduced an oxygen challenge to enhance the glucoCEST effect while under hyperoxia. We provide preliminary results of the glucoCEST effect in a patient with oropharyngeal squamous cell carcinoma at 3T, at baseline and after two weeks of radiotherapy.
Methods
A patient (69,M) with a tonsillar tumor was imaged in a 3T GE Signa MRI scanner (GE, USA) at baseline, and again during week two of radiation therapy (Transmit: single-channel body coil, Receive: 8-channel neurovascular coil). The CEST protocol consisted of a single-shot EPI sequence, two-second CEST pulse train (twenty, 50-ms Gaussian pulses, 50% duty cycle, 2.1μT peak B1) was acquired over 71 offsets, applied asymmetrically between ±5 ppm (glucose resonances oversampled at 1.2, 0.8 ppm), with two reference scans. The CEST experiment was repeated four times with and without an 0.08-mL/s, 20% glucose infusion, preceded by a 50ml, 50% glucose bolus, with and without inhalation 15-L oxygen via a non-rebreathe mask (min trough exhalation oxygen concentration = 80% ppO2). All CEST acquisitions used a FOV=200x200x10-mm3 over one slice, acquisition matrix=64x64, and TR/TE/αEX=4-s/21-ms/90°. A dynamic contrast-enhanced (DCE) image - gradient-echo, fat-suppressed sequence (LAVA) (TR/TE/αEX=2.77-ms/1.22-ms/12°, FOV=380x222x90-mm3, 50 dynamics) - was used to generate Ktrans maps for comparison. A 3D, high-resolution, T2-weighted scan (FOV: 260x150x180-mm3, matrix: 384x224) was also acquired.
Each CEST acquisition was registered (FLIRT, FSL5,6) to the reference no-glucose, air scan. Signal intensities were fit to a three-pool model - water, glucose (offset relative to water: 1.2 ppm), and semisolid (Lorentzian, symmetric about water7,8) - of the Bloch-McConnell equations using Bayesian inference9. CEST parameter maps for each voxel were generated from the fitted data, and the MTR* (a measure of CEST effect size correcting for direct saturation using the model fitted parameters9) and the dynamic glucose enhanced (DGE) ($$$MTR^*_{Glucose}-MTR^*_{noGlucose}$$$) effect10 were calculated. The DCE data was processed using Quantiphyse11.
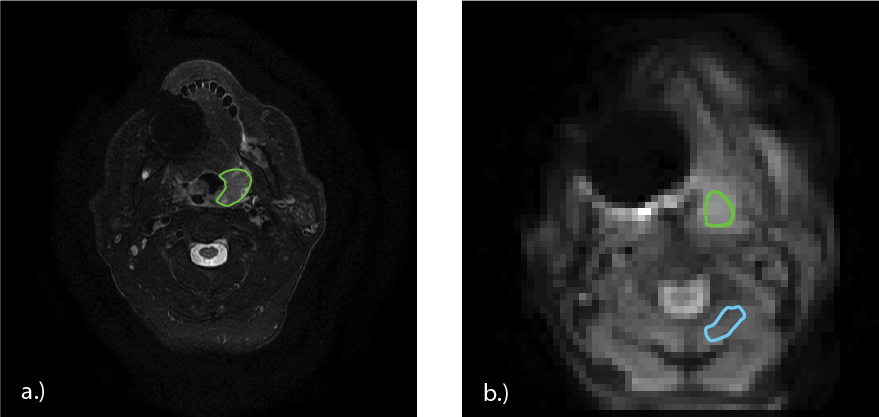
A trained radiologist (NT) drew regions of interest (ROIs) over the tumor volume for both scan visits (Figure 1a). Using custom scripts developed in MATLAB (Mathworks, USA), the T2 image was transformed into CEST image space, and registered to the reference, no-glucose, air CEST scan; these transformations were applied to the ROI (Figure 1b). An ROI in healthy muscle was drawn on the CEST scans (Figure 1b) to compare glucose uptake outside the tumor volume. Mean MTR* values were calculated in each tissue for each CEST acquisition over both visits.
Results
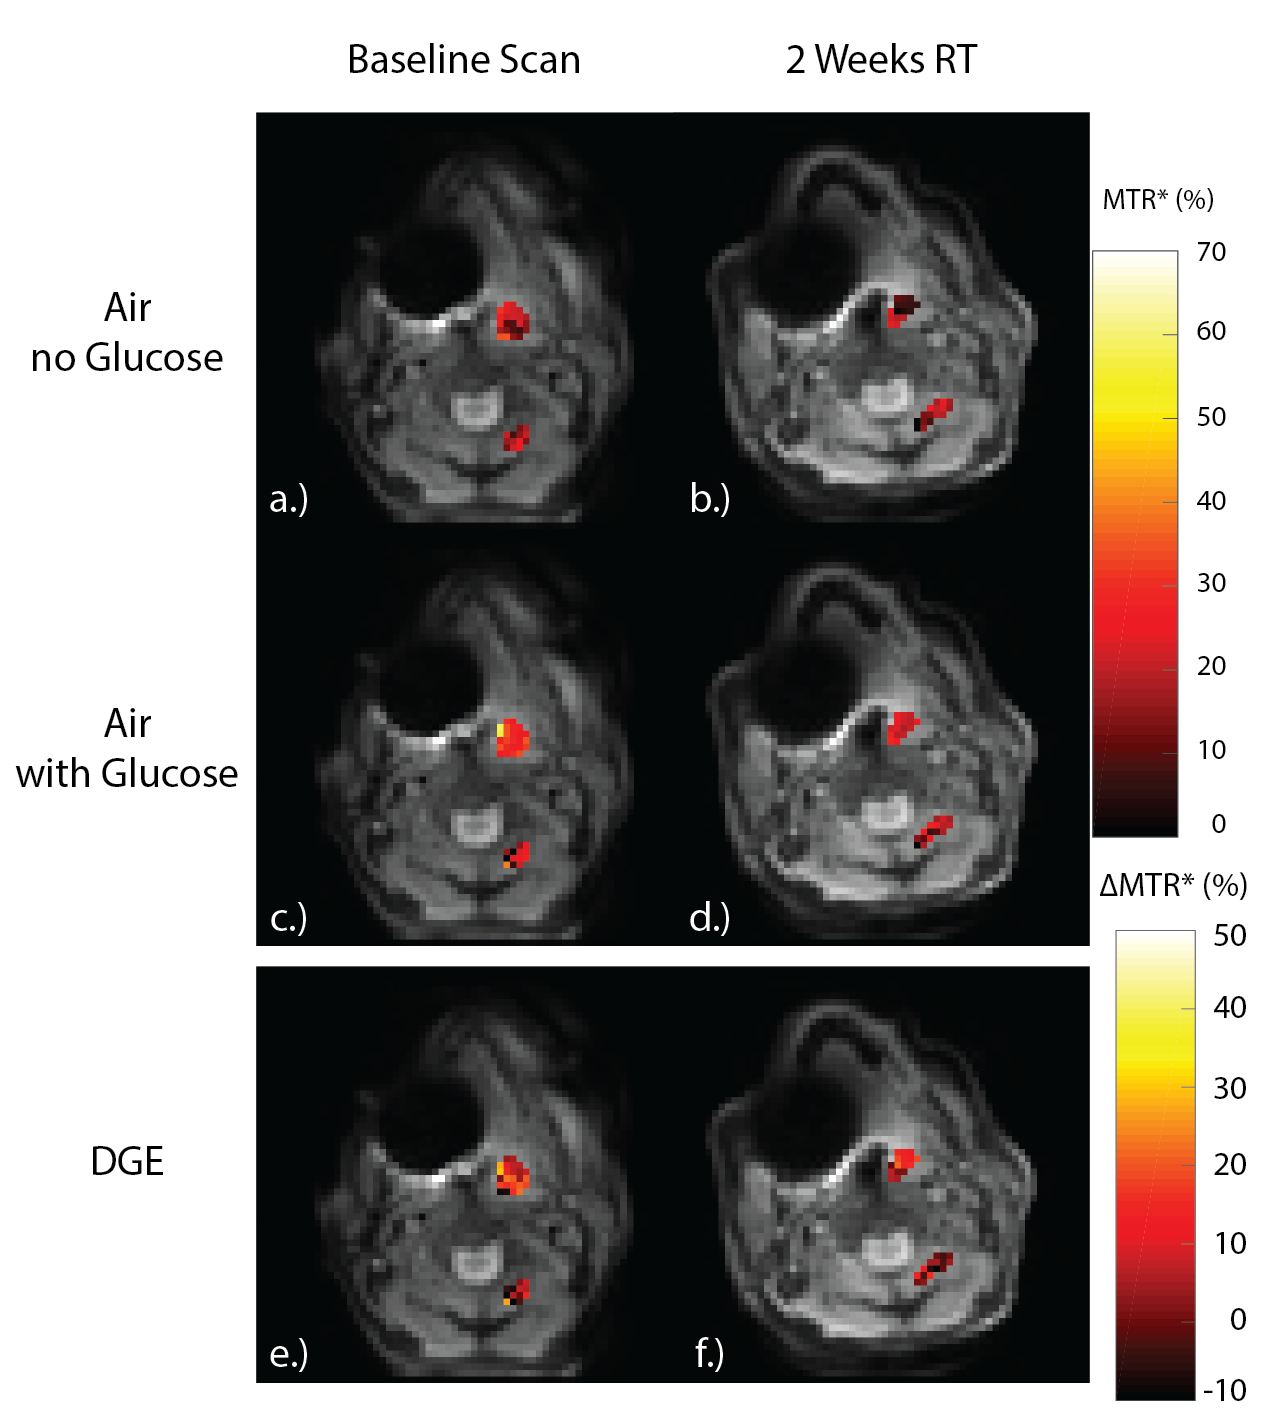
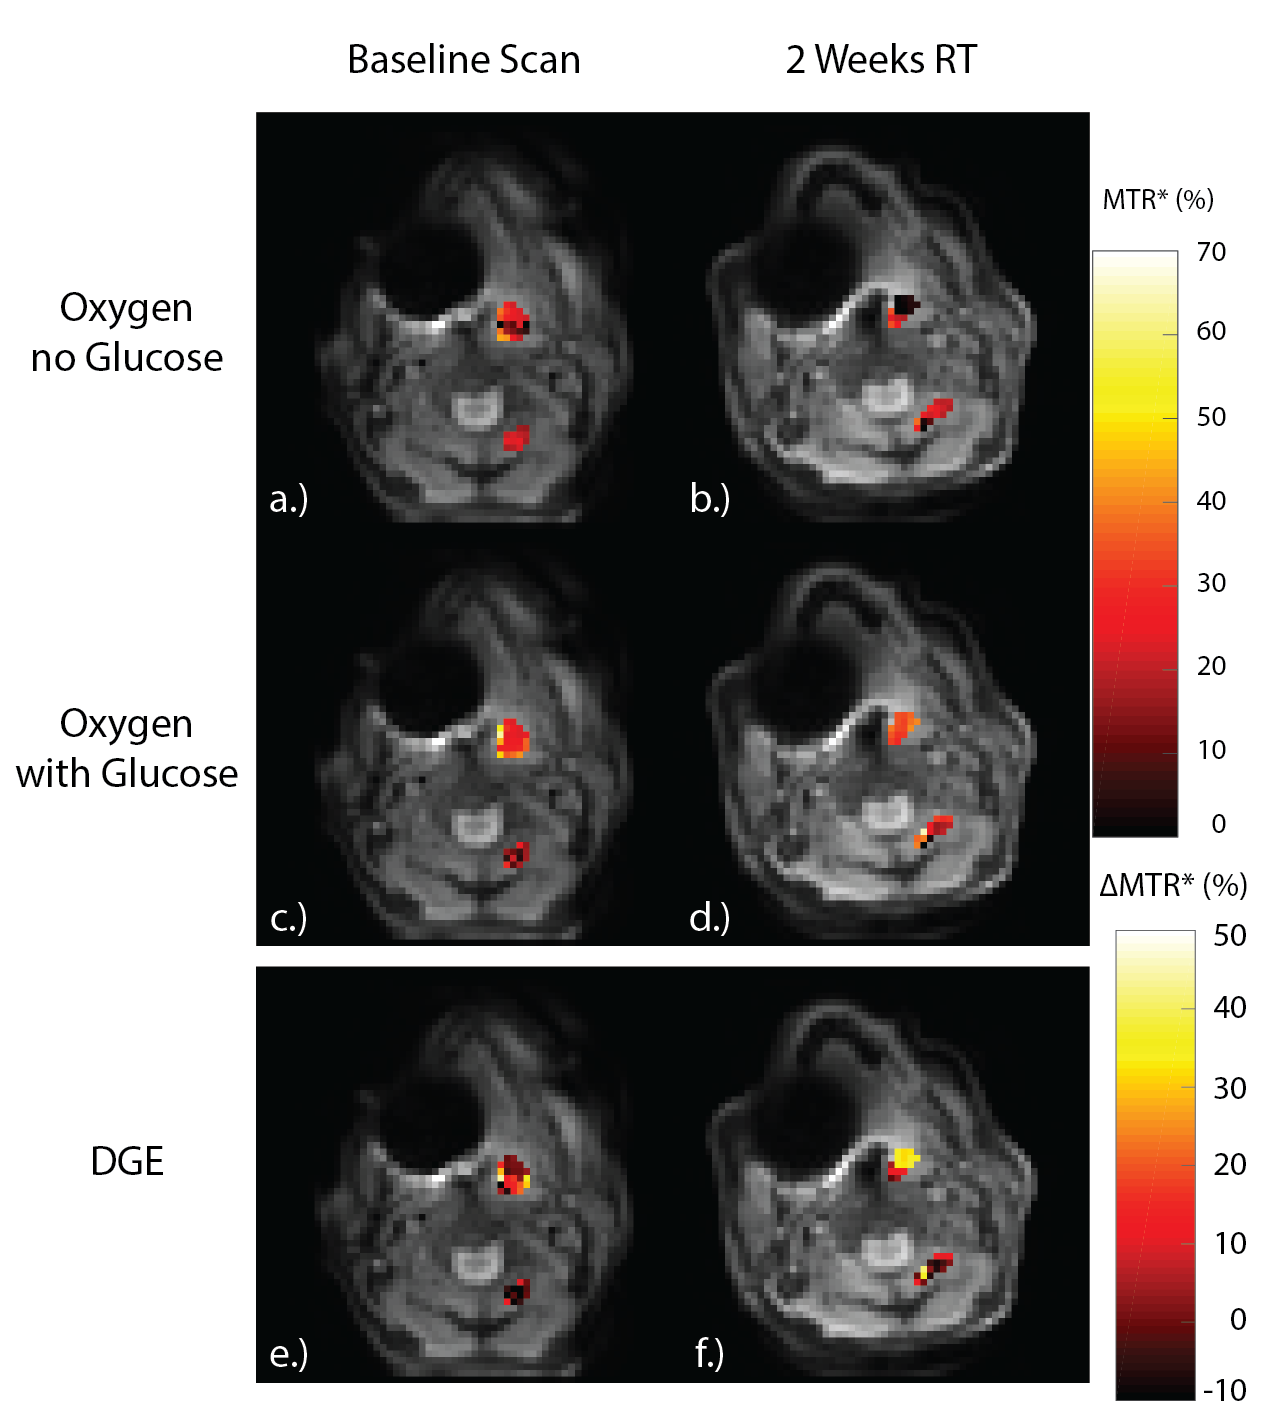
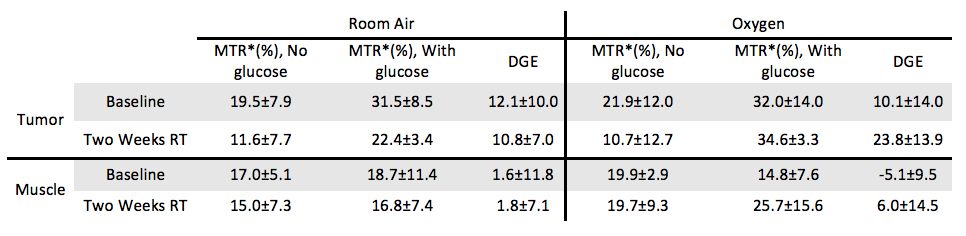
Figures 2 and 3 display the MTR* for the baseline scans (Figure 2, 3a,c,e) and during week two of radiotherapy (Figure 2, 3b,d,f) for the tumor and muscle ROIs while the patient was breathing room air, and while the patient was administered oxygen, respectively. Table 1 shows the mean±SD MTR* and DGE values for each ROI in each CEST acquisition.
Figure 2e,f shows the DGE while on room air. The tumor volume shows a clear increase in MTR* when glucose is administered, relative to the no glucose scans (DGE=12.1%±10.0%), which is not seen in the muscle tissue (DGE=1.6%±11.8%). Additionally, there is no decrease in the DGE after two-weeks of radiotherapy relative to the baseline while on room air.
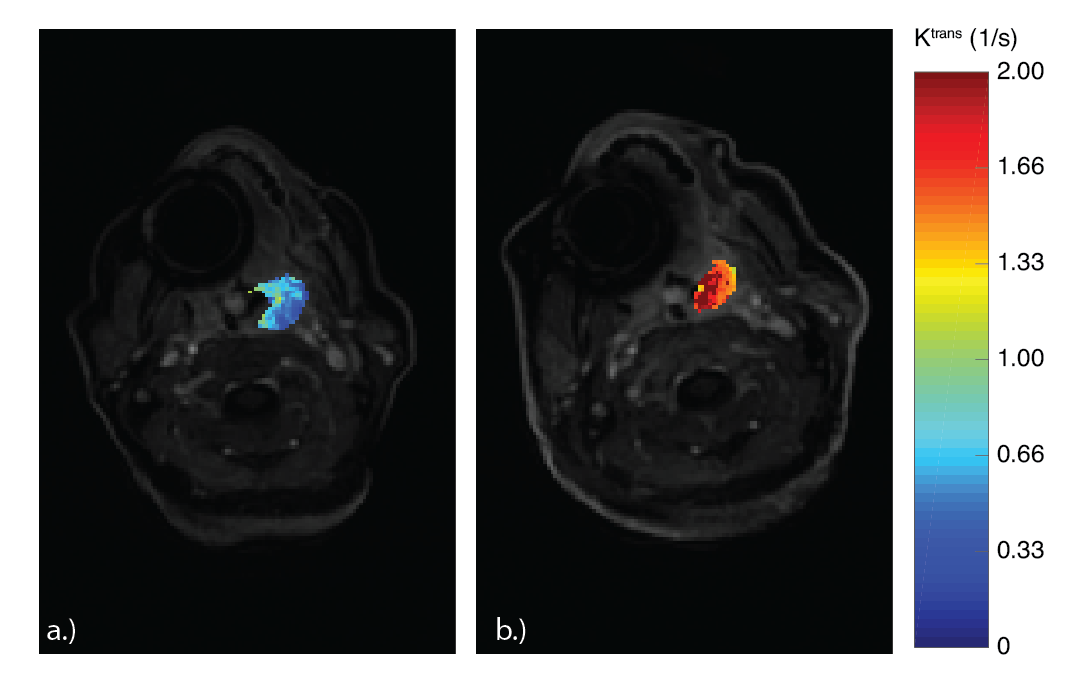
During the oxygen challenge, there is a visual increase in MTR* in the tumor when comparing the scans with and without glucose infusions (Figure 3e,f). However, there is a significant increase in the DGE at two-weeks radiotherapy relative to the baseline scan, correlating with the increase in tumor Ktrans seen in Figure 4. This may signal an increase in tumor vascularity over the course of treatment as increased molecular oxygen will increase the $$$T_2^*$$$11, increasing the glucoCEST effect.
Conclusions
These results demonstrate the first use of glucose CEST using both a bolus and infusion of glucose, and the first glucoCEST experiment under hyperoxia. We have shown the potential for an oxygen challenge to increase the sensitivity of glucoCEST to changes in the vasculature of tumors post radiotherapy. Future work includes scanning the patient post-radiotherapy, and imaging more patients.Acknowledgements
Funding provided by: Whitaker International Program Fellowship, St. Hilda’s College JRF, the UK Medical Research Council, the Oxford Cancer Imaging Centre, the UK Department of Health, the Oxford Health Services Research Committee. Support was also provided by The CRUK Oxford Cancer Research Centre and The Oxford National Institute for Health Research Biomedical Research Centre, with assistance by the Oxford University Hospitals NHS Foundation Trust.References
1. Walker-Samuel, S., et al. In vivo imaging of glucose uptake and metabolism in tumors. Nature medicine 19, 1067-1072 (2013).
2. Wang, J., et al. Magnetic Resonance Imaging of Glucose Uptake and Metabolism in Patients with Head and Neck Cancer. Scientific reports 6, 30618 (2016).
3. Smith, S.A., Bulte, J.W. & van Zijl, P.C. Direct saturation MRI: theory and application to imaging brain iron. Magnetic resonance in medicine : official journal of the Society of Magnetic Resonance in Medicine / Society of Magnetic Resonance in Medicine 62, 384-393 (2009).
4. Stanisz, G.J., et al. T1, T2 relaxation and magnetization transfer in tissue at 3T. Magnetic resonance in medicine : official journal of the Society of Magnetic Resonance in Medicine / Society of Magnetic Resonance in Medicine 54, 507-512 (2005).
5. Jenkinson, M. & Smith, S. A global optimisation method for robust affine registration of brain images. Medical image analysis 5, 143-156 (2001).
6. Jenkinson, M., Bannister, P., Brady, M. & Smith, S. Improved optimization for the robust and accurate linear registration and motion correction of brain images. NeuroImage 17, 825-841 (2002).
7. van Zijl, P.C.M., Lam, W.W., Xu, J., Knutsson, L. & Stanisz, G.J. Magnetization Transfer Contrast and Chemical Exchange Saturation Transfer MRI. Features and Analysis of the Field-Dependent Saturation Spectrum. NeuroImage (2017).
8. Zhang, X.Y., et al. Accuracy in the quantification of chemical exchange saturation transfer (CEST) and relayed nuclear Overhauser enhancement (rNOE) saturation transfer effects. NMR in biomedicine (2017).
9. Chappell, M.A., et al. Quantitative Bayesian model-based analysis of amide proton transfer MRI. Magnetic resonance in medicine : official journal of the Society of Magnetic Resonance in Medicine / Society of Magnetic Resonance in Medicine 70, 556-567 (2013).
10. Xu, X., et al. Dynamic glucose enhanced (DGE) MRI for combined imaging of blood-brain barrier break down and increased blood volume in brain cancer. Magnetic resonance in medicine : official journal of the Society of Magnetic Resonance in Medicine / Society of Magnetic Resonance in Medicine (2015).
11. www.quantiphyse.org
12. Noseworthy, M.D., Kim, J.K., Stainsby, J.A., Stanisz, G.J. & Wright, G.A. Tracking oxygen effects on MR signal in blood and skeletal muscle during hyperoxia exposure. Journal of magnetic resonance imaging : JMRI 9, 814-820 (1999).
Figures