0410
Decoding IDH Genotype in Grade-II and -III Gliomas with Protein-based Amide Proton Transfer-Weighted (APTw) MRI1Department of Radiology, Zhujiang Hospital, Southern Medical University, Guangzhou, China, 2Department of Radiology, Johns Hopkins University, Baltimore, MD, United States, 3Department of Pathology, Zhujiang Hospital, Southern Medical University, Guangzhou, China, 4Center for Brain Imaging Science and Technology, Department of Biomedical Engineering, Zhejiang University, Hangzhou, China
Synopsis
We explored the possibility of using the APTw signal intensity as a surrogate marker to identify IDH mutation status in gliomas. 105 patients with newly diagnosed grade-II/III gliomas were included. APTw histogram data obtained from tumor burden was recorded. The Mean, Peak, 10th, 25th, 50th, 75th, 90th Percentiles of APTw signal histograms were significantly higher in the IDH-wildtype group than in the IDH-mutant group. The classification for 50th Percentile APTw to differentiate these two glioma groups was 78.1%. Preoperative APTW imaging may assist in predicting the IDH mutation status in gliomas.
Target audience:
Researchers and clinicians who are interested in clinical IDH diagnosis, APT imaging and radiogenomics.Purpose
The recent breakthrough in the understanding of genetic features in gliomas, such as isocitrate dehydrogenase (IDH) mutations, has resulted in a prompt reappraisal of the molecular oncogenesis of this group of diseases (1). For the first time, the most recent 2016 WHO classification of CNS tumors uses molecular parameters, in addition to histology, to define tumor entities (2). It reveals an unmet radiographic need in the molecular era—the ability to identify genetic biomarkers preoperatively. Notably, a new research direction in cancer imaging, referred to as radiogenomics or imaging genomics, has emerged that focuses on the relationship between imaging phenotypes and genomics (3-5). APTw imaging, a type of CEST imaging (6-9), is a novel molecular MRI technique that generates contrast mainly based on protein content and a few other factors (10). This technique has shown great diagnostic performance for grading tumor and assessing treatment response in patients with gliomas (11-13). The purpose of this study was to determine the capability of APTw-MRI to classify IDH1/2 mutation status in grade-II/III gliomas preoperatively.Methods
Subjects: This retrospective study was approved by the institutional review board, and written, informed consent was waived. 105 patients (confirmed histopathologically as grade-II or -III gliomas, received no radiotherapy or chemotherapy before imaging, had complete APTw and routine MRI data, with the IDH1/2 and 1p/19q lab test results) were continuously enrolled (Table 1).
MRI protocol: All patients were scanned on a Philips 3T MRI system. The sequences used for each patient included T1w, T2w, FLAIR, APTw imaging, and gadolinium contrast-enhanced T1w. A multi-offset, multi-acquisition imaging acquisition scheme (11) was used for APTw imaging (saturation power=2 μT; saturation time=800 msec; slice thickness=5 mm; scan time=3 min). APTw images were calculated using a magnetization transfer ratio asymmetry at ±3.5ppm.
Histopathological analysis: All specimens were reviewed by a neuropathologist (blinded to the imaging features) for tumor grading and IDH1/2 mutation status evaluation according to the 2016 CNS WHO. The IDH1-R132H mutation status was first assessed with immunohistochemical stain. For the negative stained samples, IDH1/2 alterations in the 12 hotspot codons R132 and R172 were further assessed, using bidirectional cycle sequencing of PCR-amplified fragments with the standard Sanger method.
Image analysis: For each patient, one large ROI covering the whole contour of hyperintensity on FLAIR was drawn by a neuroradiologist. The APTw signal intensities compared with the contralateral normal brain were reported. APTw intensity histogram metrics (Mean, STDV, Peak, 10th, 25th, 50th, 75th, 90th Percentiles, and Interquartile range (IQR)) were obtained.
Statistical analysis: All statistical analyses were performed using SPSS statistical software. The alpha level of all tests was set at P < 0.05 (two-tailed).
Results
Based on histopathology and molecular analysis, 43 patients were classified as IDH-wildtype gliomas, and the remaining 62 patients as IDH-mutant gliomas (Table 1). The IDH-wildtype group was significantly older than the IDH-mutant group. The IDH-wildtype group had significantly more WHO grade III, while the IDH-mutant group had significantly more WHO grade II.
IDH-wildtype gliomas (both WHO grade-II and -III) typically demonstrated relatively higher signal intensities on APTw images, compared to IDH-mutant gliomas (Fig. 1). Taking both WHO grade-II and -III together, the IDH-wildtype group had a right-shifted histogram, compared with the IDH-mutant group (Fig. 2). Quantitatively, Mean, Peak, 10th, 25th, 50th, 75th, 90th Percentiles of APTw signal intensities were significantly higher in the IDH-wildtype cohort than in the IDH-mutant cohort (Table 2). Logistic regression models proved that 50th percentile APTw intensity yielded the highest classification capability in predicting IDH1/2 mutation status after adjusting for age and WHO grade (Table 3).
Discussion
Since IDH-gene-encoded enzymes are closely involved in the energy-producing Krebs cycle as catalytic isozymes, mutations in IDH genes may cause widespread disturbances of cellular metabolism, including alteration of amino acid concentrations and enzymatic activity, and raise global DNA hypermethylation and global downregulation of protein expression as well (14, 15). Further, our results are consistent with a recent study by Xiong et al. (16), who reported that IDH mutations significantly correlated with a lower cell proliferation in grade-II oligodendroglial tumors, thus leading to a lower APTw signal.Conclusion
IDH-wildtype gliomas are typically associated with relatively higher APTw intensity, compared with IDH-mutant gliomas. APTw histogram signatures showed the valuable performance to reveal IDH genotype in WHO grade-II and -III gliomas.Acknowledgements
No acknowledgement found.References
1. Yan H, Parsons DW, Jin G, et al. IDH1 and IDH2 mutations in gliomas. N Engl J Med 2009;360:765-773.
2. Louis DN, Perry A, Reifenberger G, et al. The 2016 World Health Organization classification of tumors of the central nervous system: a summary. Acta Neuropathol 2016;131:803-820.
3. Diehn M, Nardini C, Wang DS, et al. Identification of noninvasive imaging surrogates for brain tumor gene-expression modules. Proc Natl Acad Sci (USA) 2008;105:5213-5218.
4. Pope WB, Chen JH, Dong J, et al. Relationship between gene expression and enhancement in glioblastoma multiforme: Exploratory DNA microarray analysis. Radiology 2008;249:268-277.
5. Choi C, Ganji SK, DeBerardinis RJ, et al. 2-hydroxyglutarate detection by magnetic resonance spectroscopy in subjects with IDH-mutated gliomas. Nat Med 2012;18:624-629.
6. Ward KM, Aletras AH, Balaban RS, et al. A new class of contrast agents for MRI based on proton chemical exchange dependent saturation transfer (CEST). J Magn Reson 2000;143:79-87. 7. Vinogradov E, Sherry AD, Lenkinski RE, et al. CEST: From basic principles to applications, challenges and opportunities. J Magn Reson 2013;229:155-172.
8. Kogan F, Hariharan H, Reddy R, et al. Chemical exchange saturation transfer (CEST) imaging: Description of technique and potential clinical applications. Curr Radiol Reports 2013;1:102-114.
9. Zaiss M, Bachert P, et al. Chemical exchange saturation transfer (CEST) and MR Z-spectroscopy in vivo: a review of theoretical approaches and methods. Phys Med Biol 2013;58:R221-R269.
10. Zhou J, Tryggestad E, Wen Z, et al. Differentiation between glioma and radiation necrosis using molecular magnetic resonance imaging of endogenous proteins and peptides. Nature Med 2011;17:130-134.
11. Wen Z, Hu S, Huang F, et al. MR imaging of high-grade brain tumors using endogenous protein and peptide-based contrast. NeuroImage 2010;51:616-622.
12. Togao O, Yoshiura T, Keupp J, et al. Amide proton transfer imaging of adult diffuse gliomas: correlation with histopathological grades. Neuro-Oncology 2014;16:441-448.
13. Oomman S, et al. Contemporary acupuncture in Canada--the McMaster approach. Acupuncture in medicine : journal of the British Medical Acupuncture Society 2006;24:35-36.
14. Noushmehr H, Weisenberger DJ, Diefes K, et al. Identification of a CpG island methylator phenotype that defines a distinct subgroup of glioma. Cancer Cell 2010;17:510-522.
15. Doll S, Urisman A, Oses-Prieto JA, et al. Quantitative Proteomics Reveals Fundamental Regulatory Differences in Oncogenic HRAS and Isocitrate Dehydrogenase (IDH1) Driven Astrocytoma. Mol Cell Proteomics 2017;16:39-56.
16. Xiong J, Tan W, Wen J, et al. Combination of diffusion tensor imaging and conventional MRI correlates with isocitrate dehydrogenase 1/2 mutations but not 1p/19q genotyping in oligodendroglial tumours. Eur Radiol 2016;26:1705-1715.
Figures
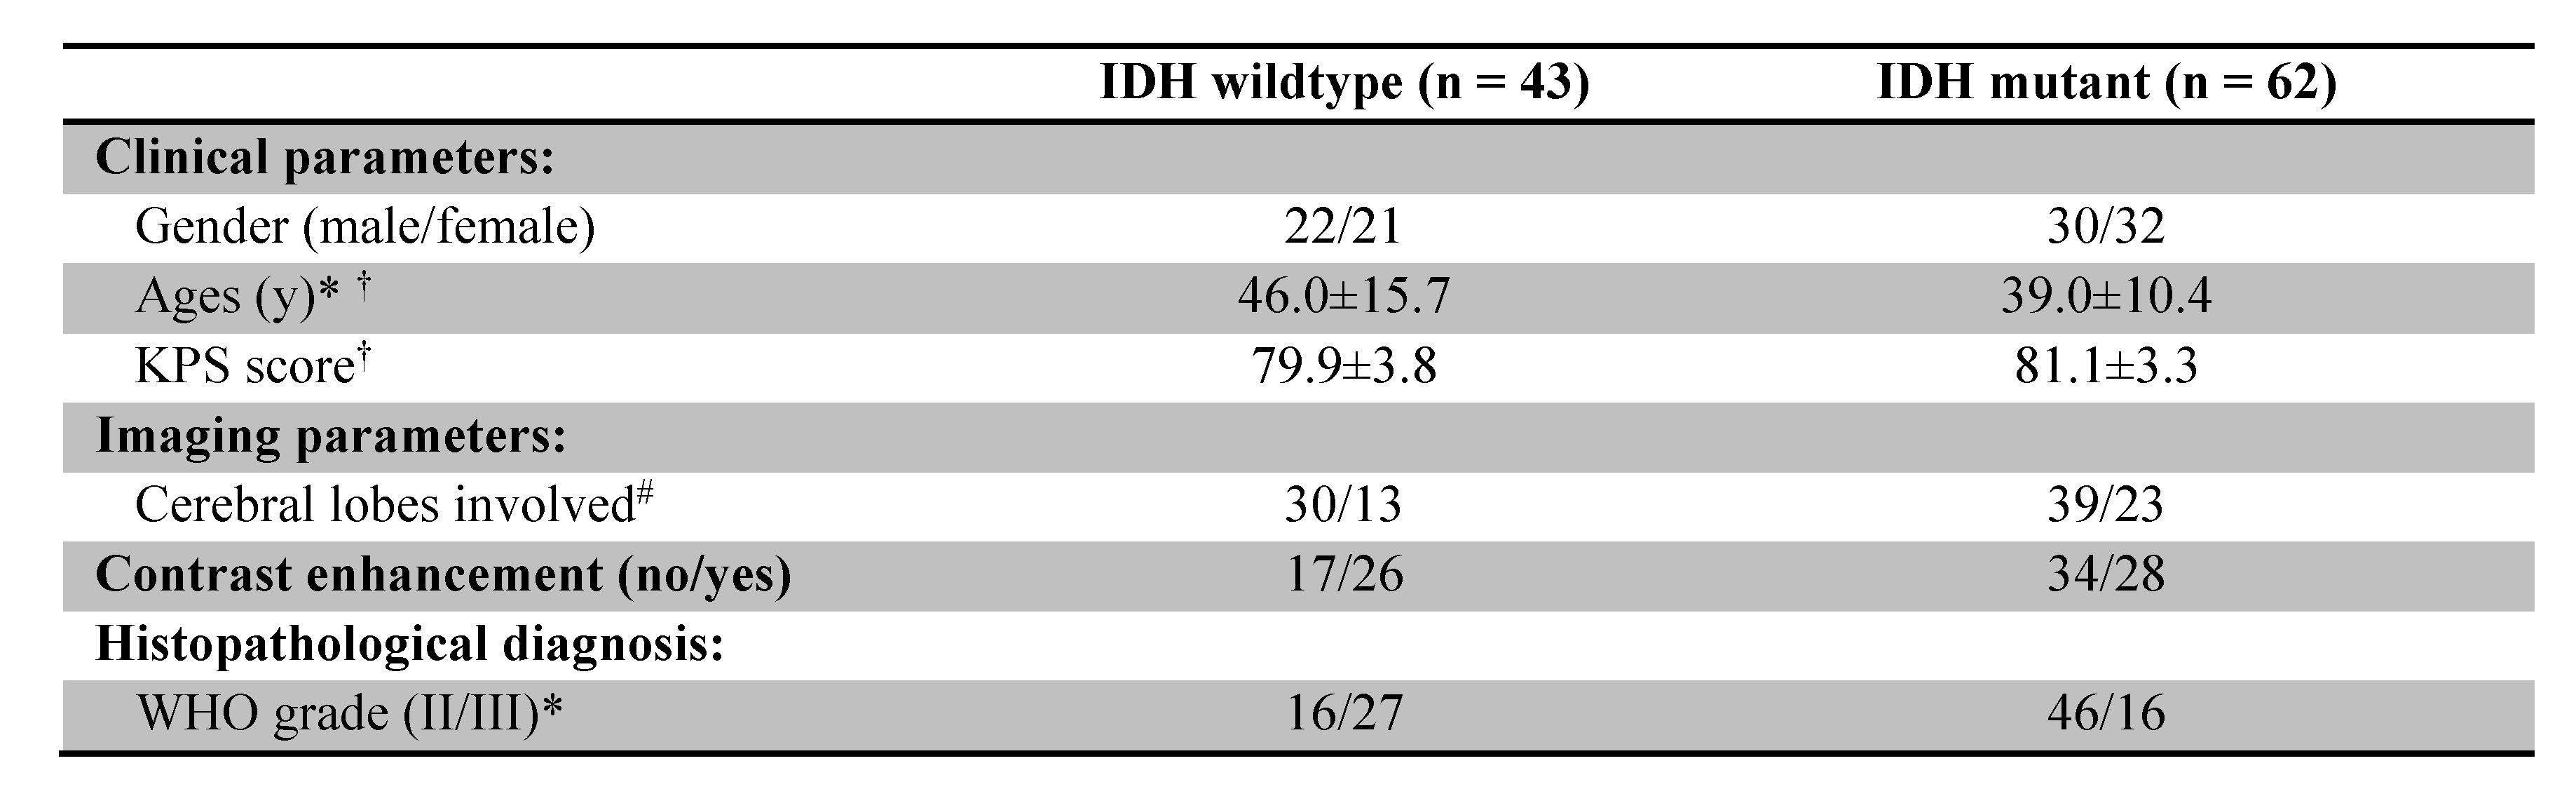
Table 1. Demography of patients. Note: Chi-square test and student t-test were used to evaluate the differences in the demographic and clinical characteristics of the patients between the IDH-wildtype and IDH-mutant groups. * p < 0.05; † Data are mean ± standard deviation; # One single lobe/multiple lobes involved.
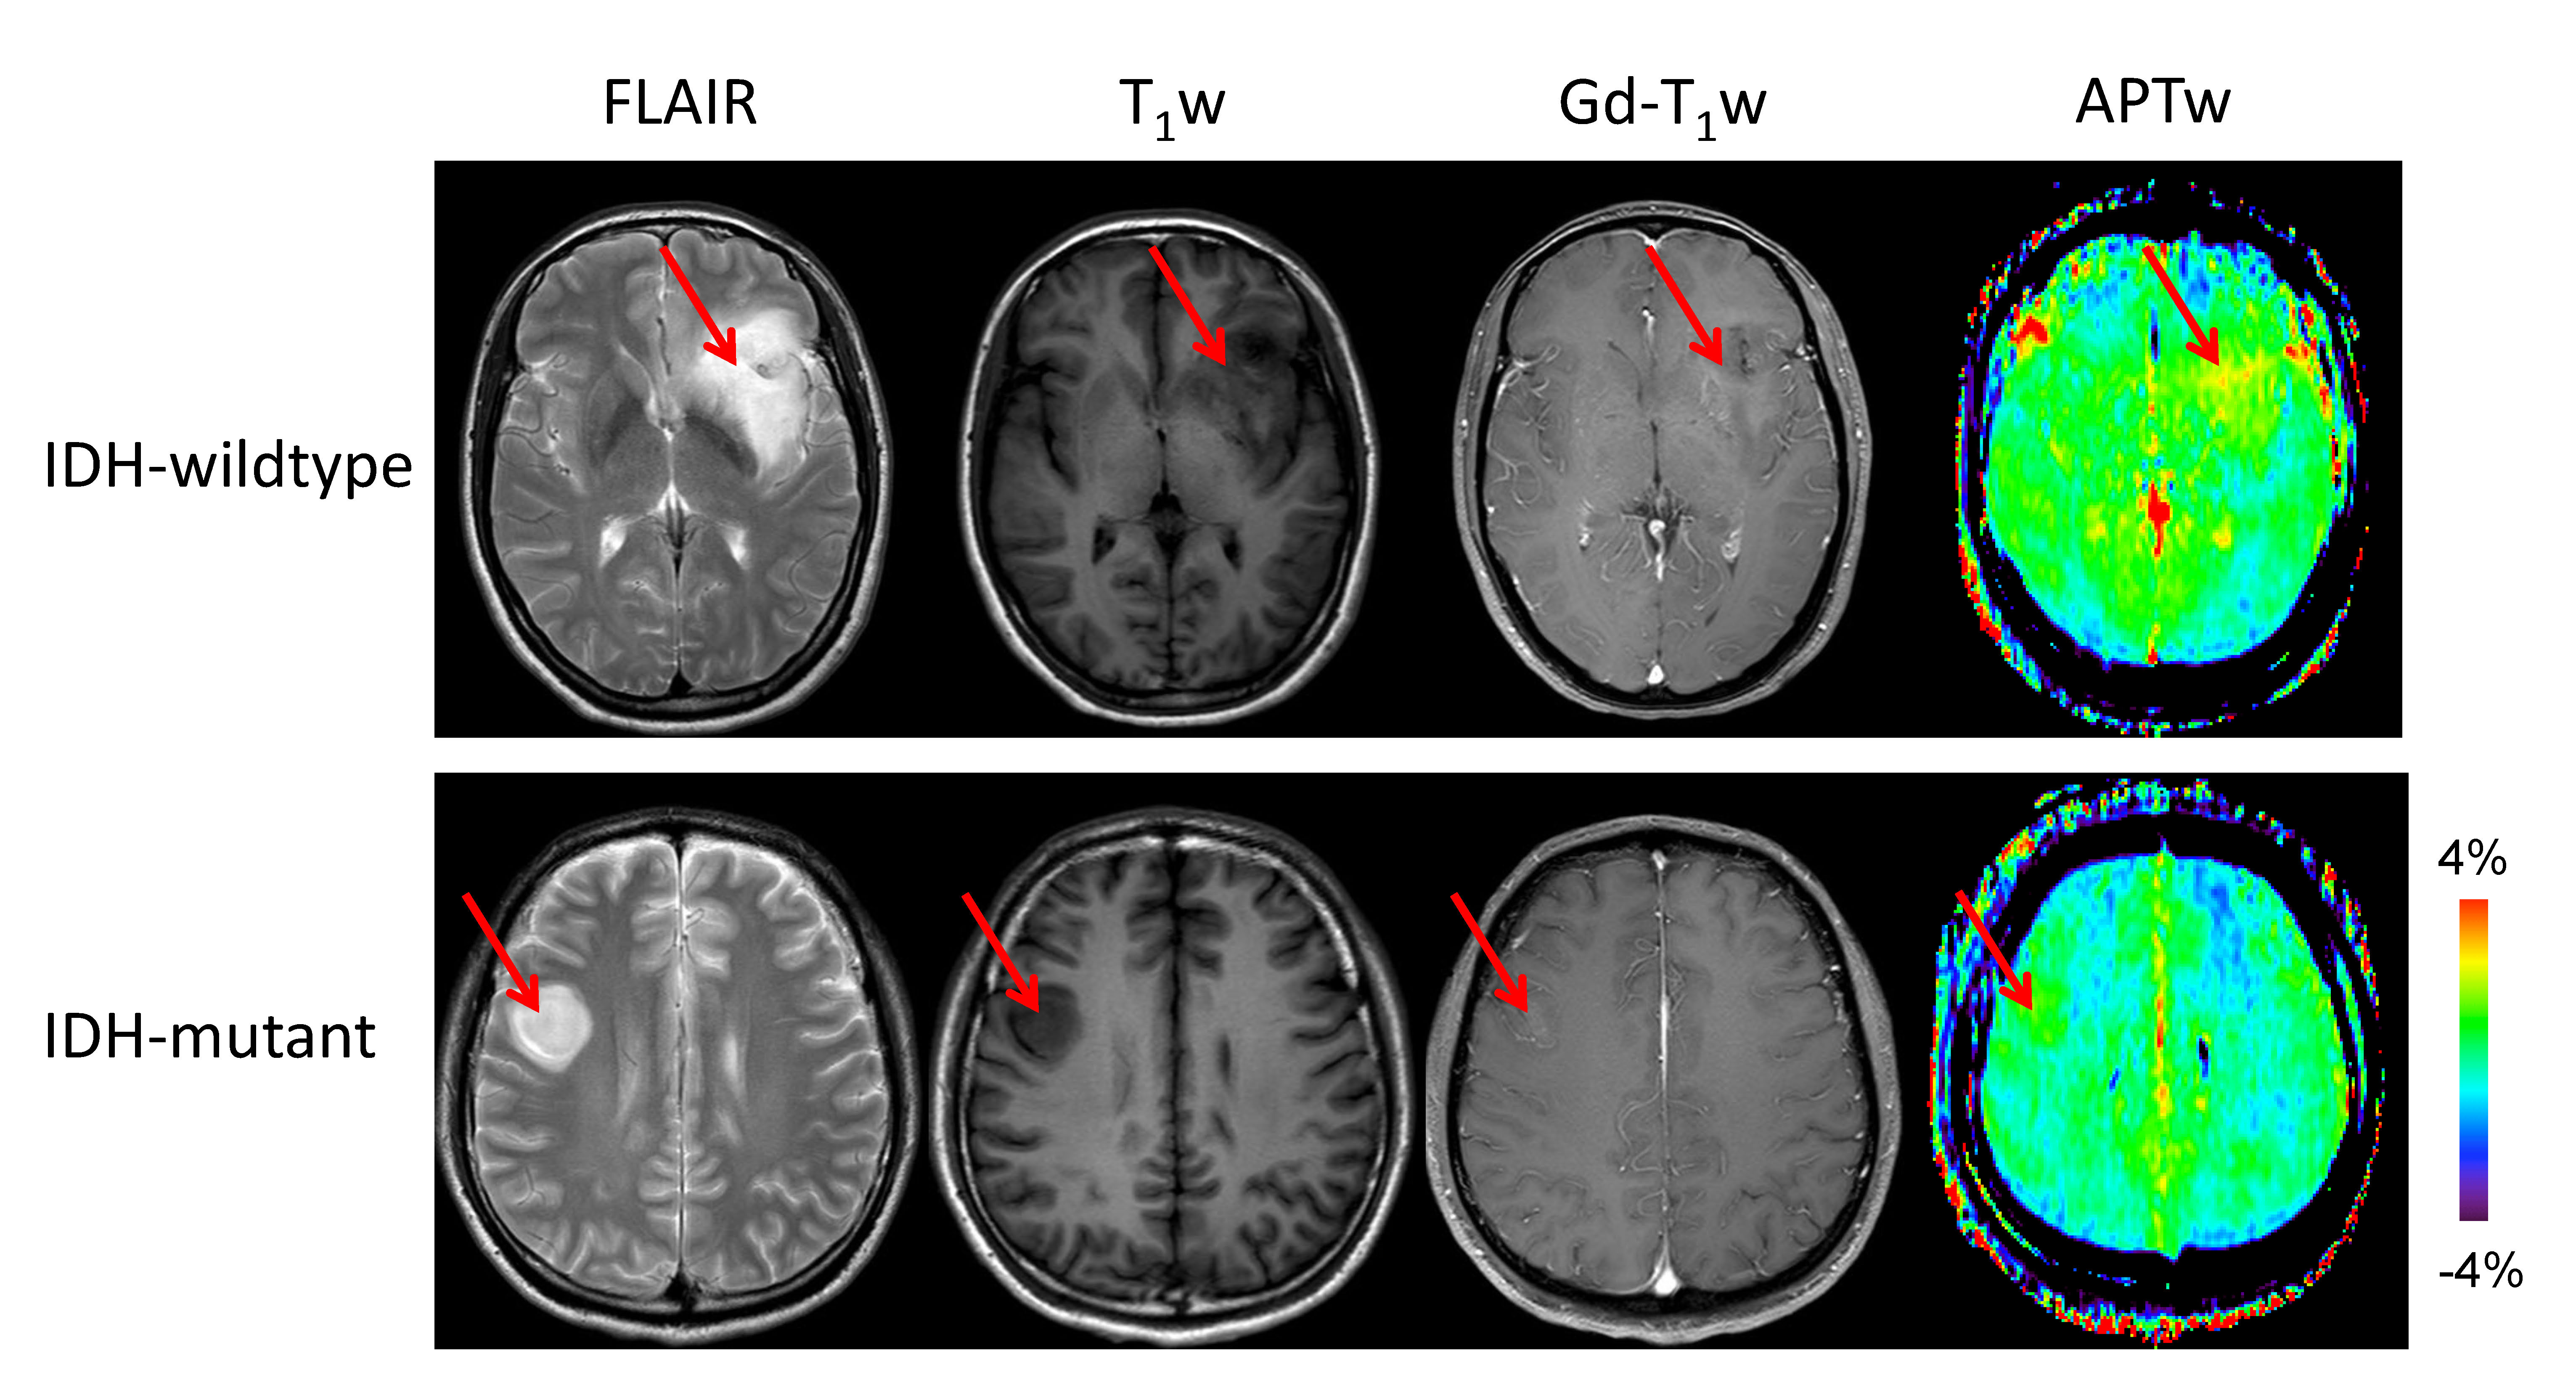
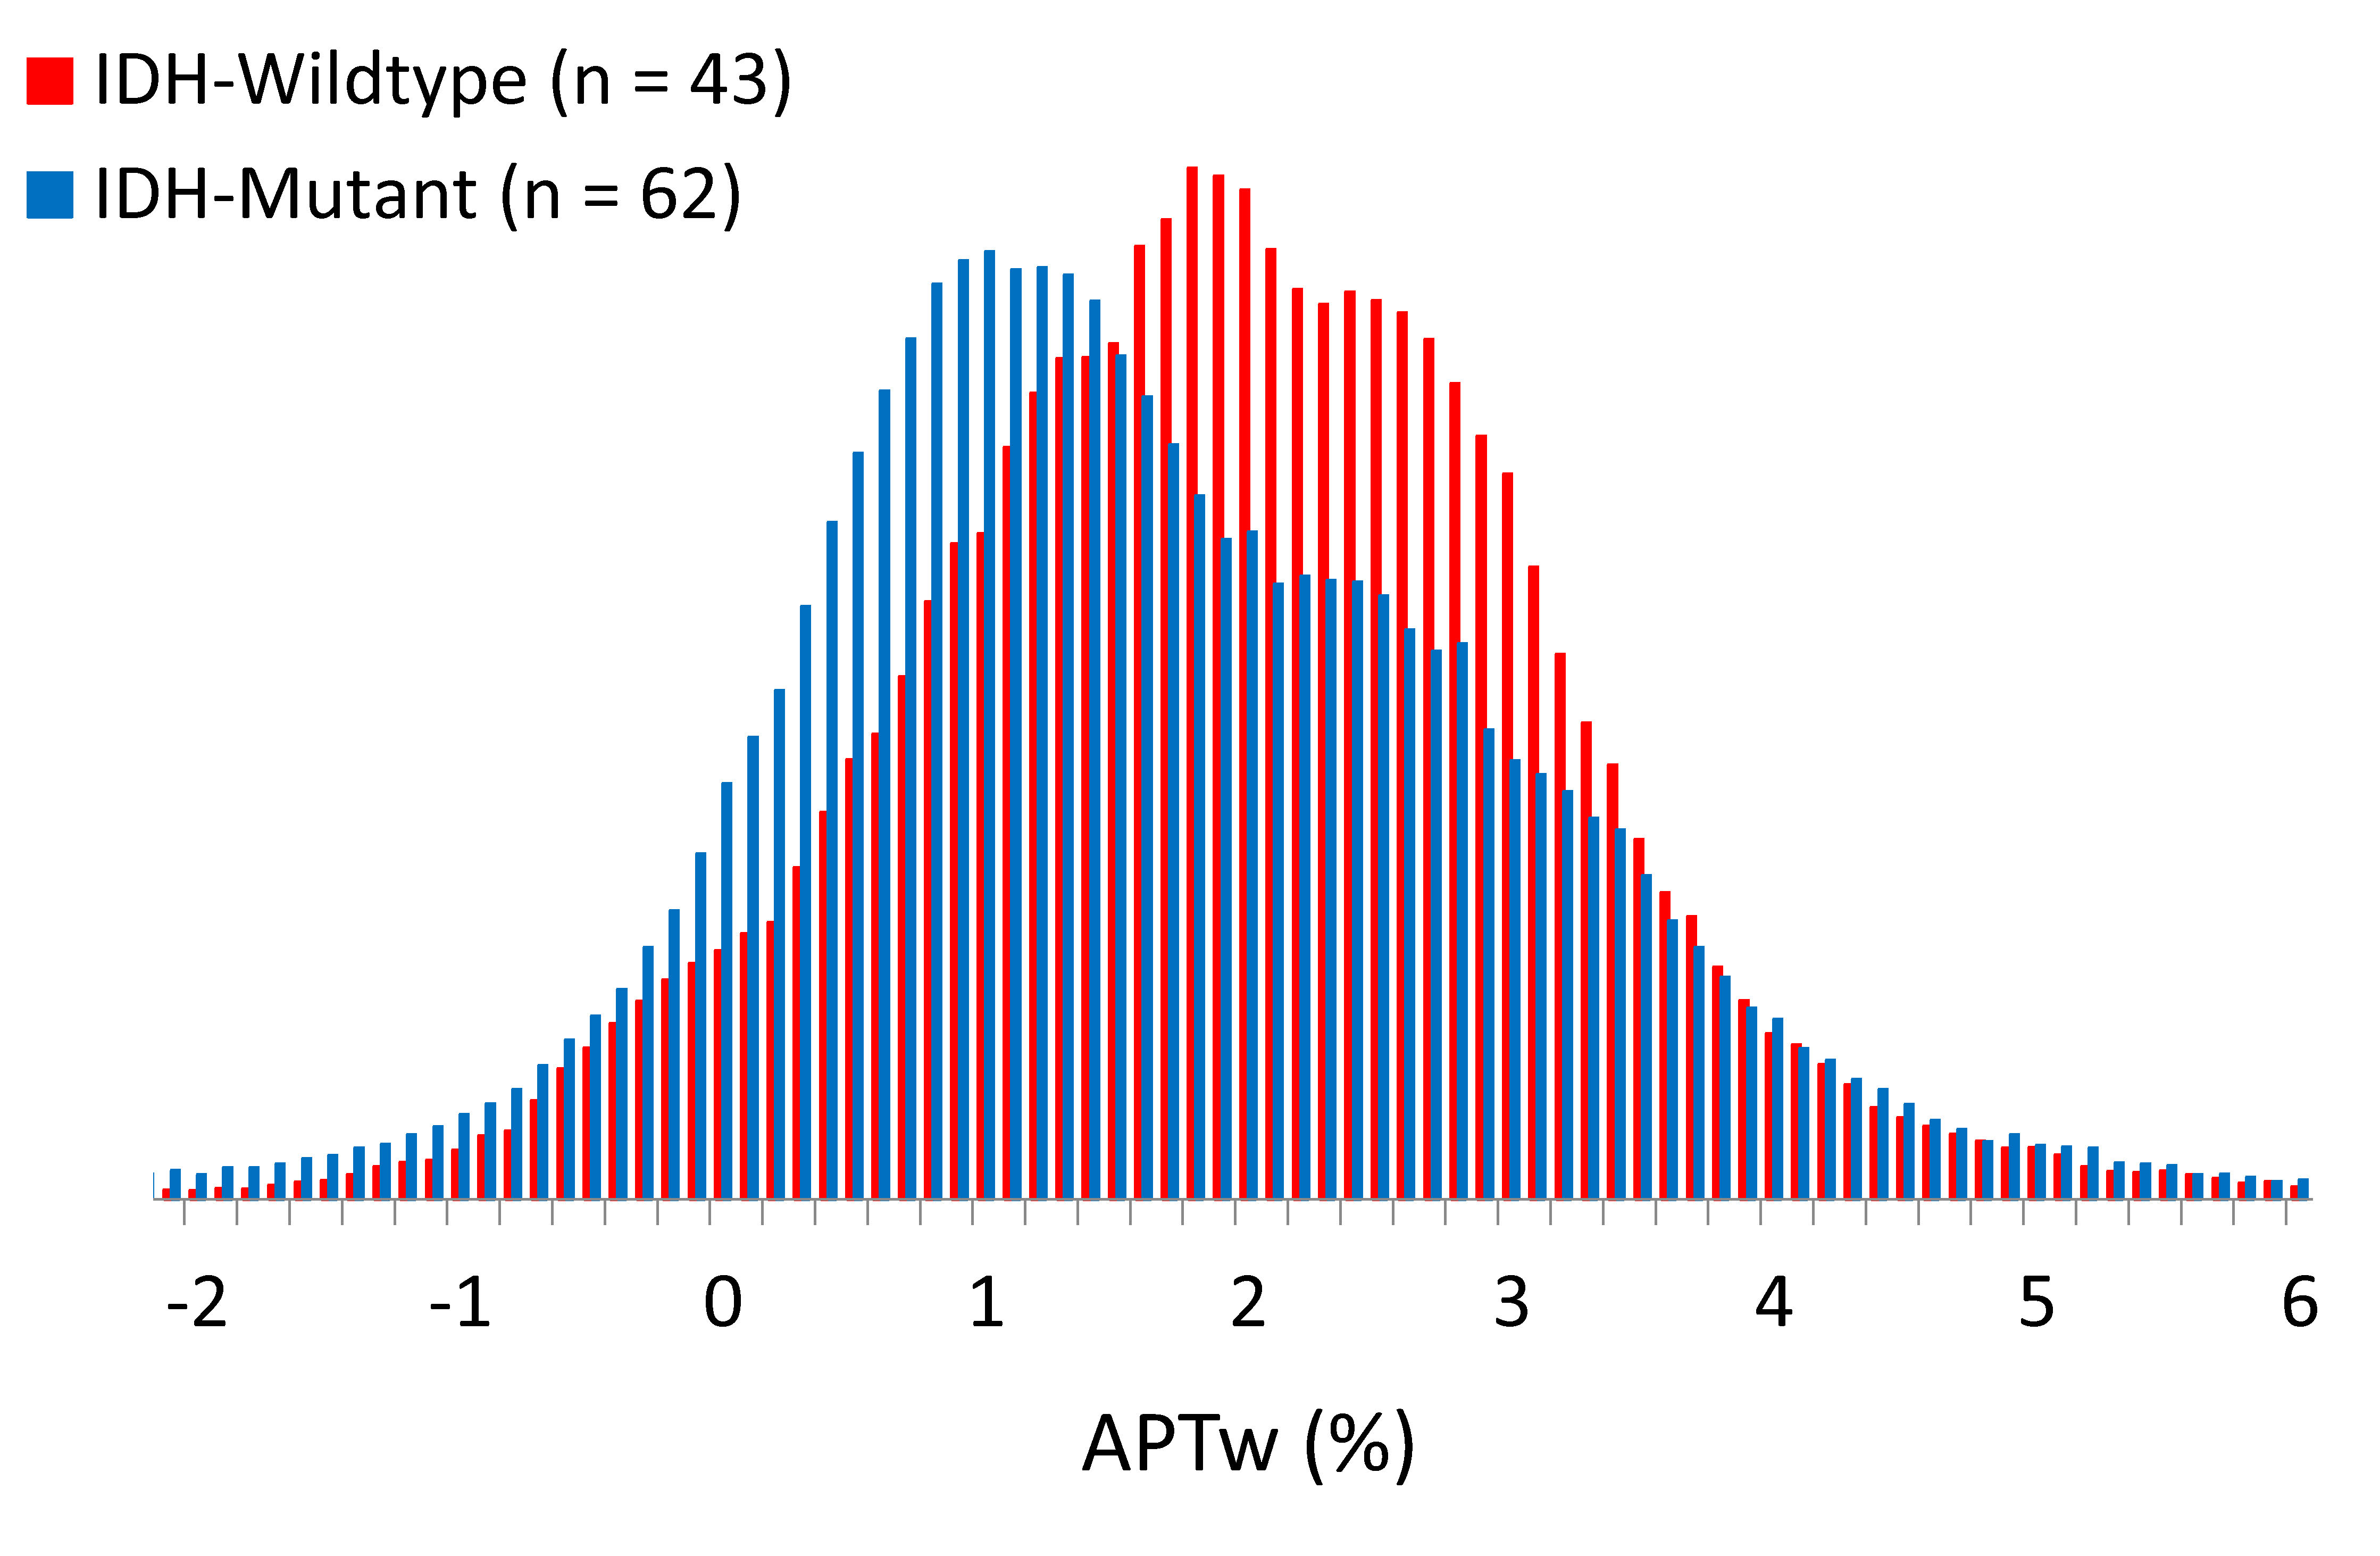
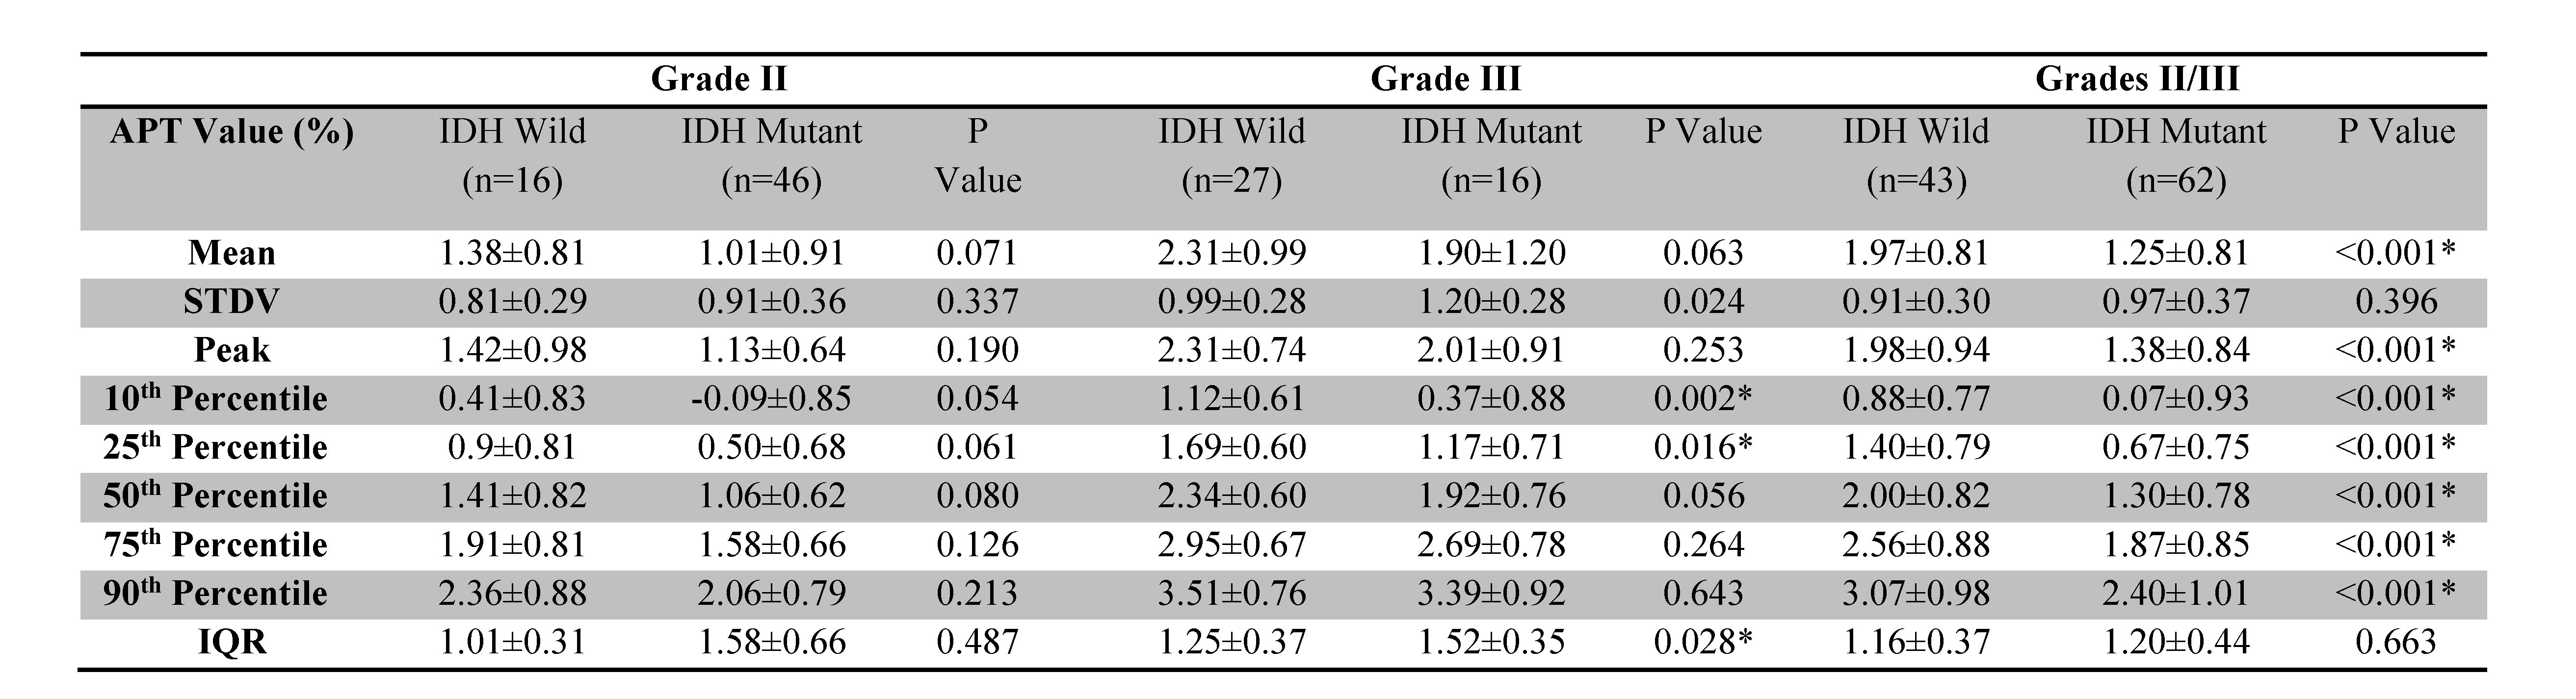
Table 2. Differences between APTw signal values for IDH-wildtype and IDH-mutant gliomas with grade II only, grade III only, and grades II/III. Data are showed as mean ± standard deviation. Note: Student t-test was used to examine the difference in each APTw histogram parameter between these two groups. * p < 0.05; IQR, Interquartile range.
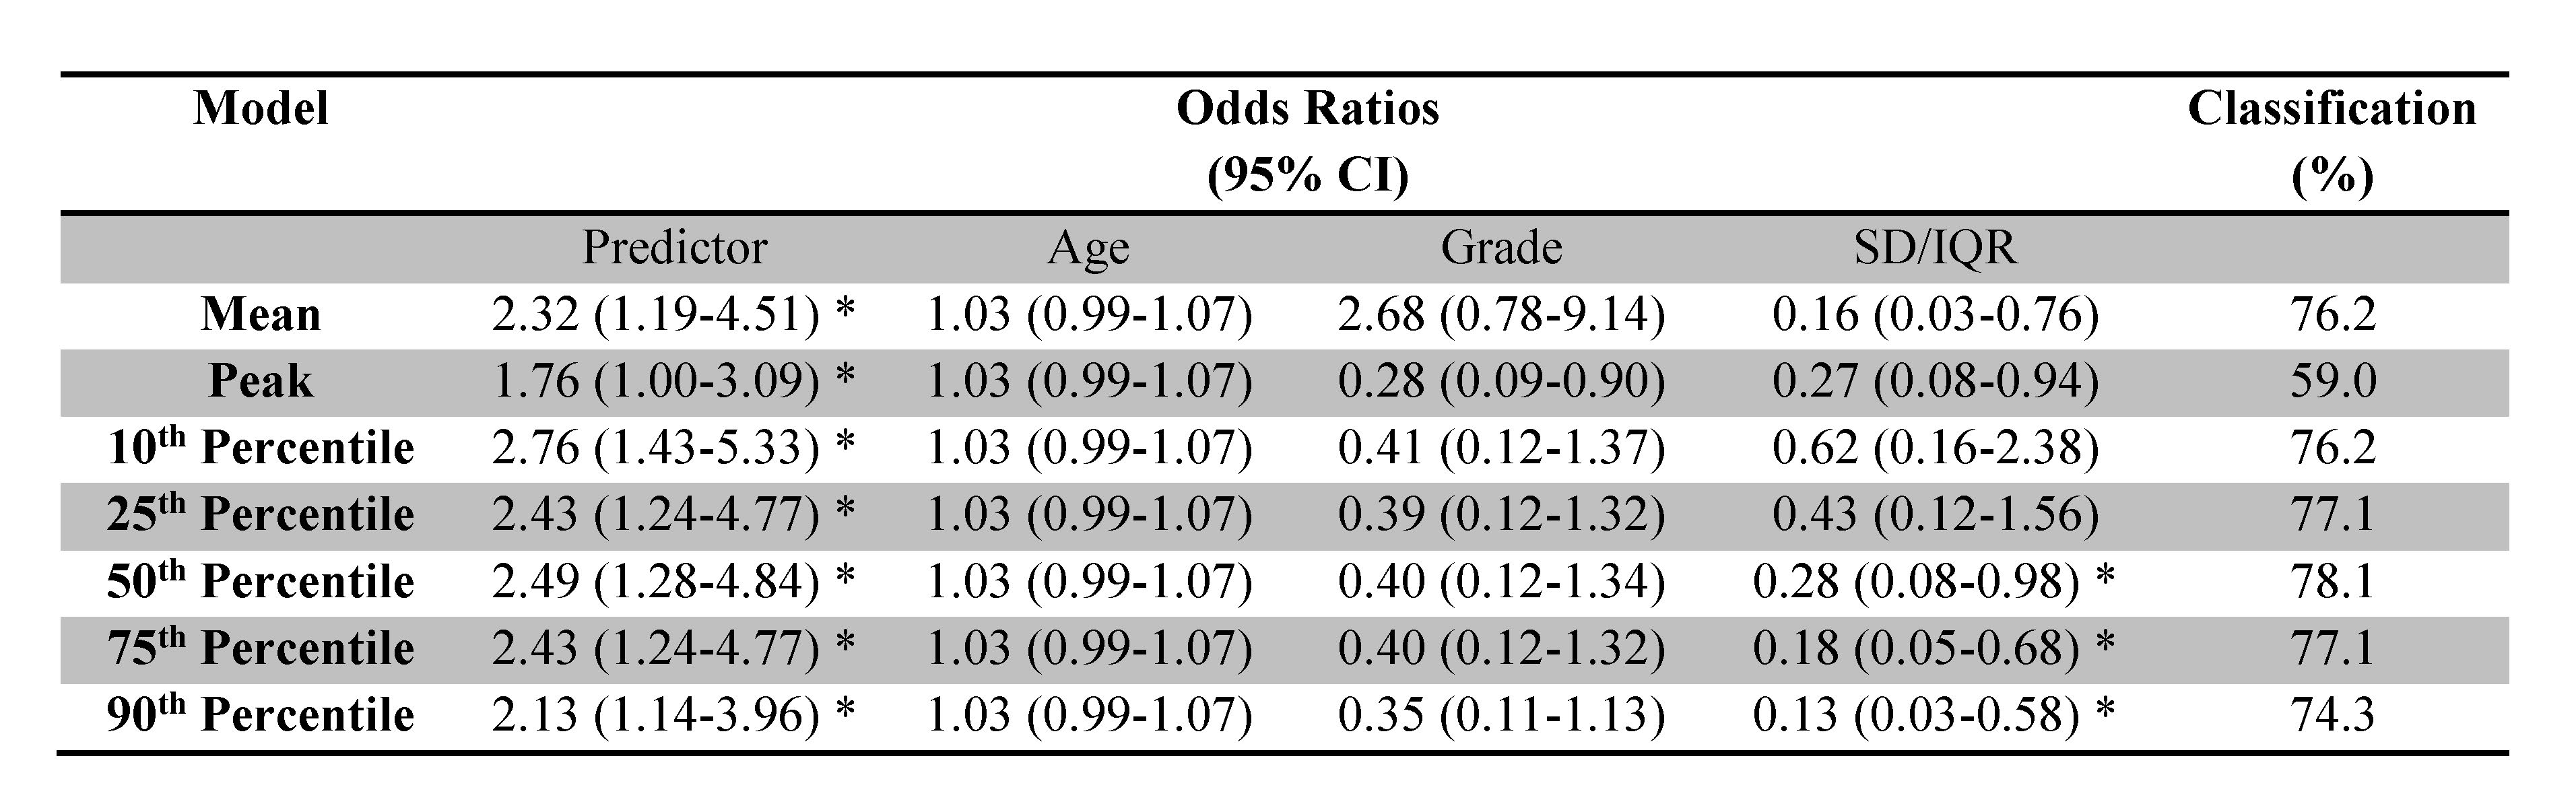
Table 3. Logistic regression models for APTw parameters to predict IDH1/2 mutant status in patients with grade-II and -III gliomas, adjusted for age, grade, and dispersion parameter†. Note: * p < 0.05; † The dispersion parameters were as follows: For Mean, standard deviation; for Percentiles and Peak, IQR.