0409
CEST-Dixon for human breast cancer characterization at 3T: a preliminary study1Department of Radiology, UT Southwestern Medical Center, Dallas, TX, United States, 2Advanced Imaging Research Center, UT Southwestern Medical Center, Dallas, TX, United States, 3Philips Research, Hamburg, Germany
Synopsis
Previous studies have demonstrated the application of CEST to breast malignancies and its potential to aid tumor characterization. However, artifacts can develop in breast CEST imaging due to strong lipid signals. In this work, CEST-Dixon sequence is used for fat free CEST imaging to characterize suspicious lesions in patients. The CEST effects are higher in the ER- IDC than the ER+ IDC, benign and normal groups. The results also indicate positive correlation of CEST with the Ki-67 level. Thus, CEST-Dixon has a potential for improved non-invasive characterization of breast lesions, potentially differentiating more aggressive from less aggressive tumors.
Introduction
CEST, especially APT neuroimaging, is emerging as a powerful tool in assessment and characterization of tumor aggressiveness and treatment response.1,2 Previous studies have demonstrated the application of CEST to breast malignancies and its potential to provide metabolic information to aid tumor characterization.3-6 However, artifacts are prone to develop in breast CEST imaging due to strong lipid signals. The goals of this work are to (i) develop and validate the CEST-Dixon imaging sequence for simultaneous water-fat separation and B0 mapping; (ii) use the CEST-Dixon method to characterize suspicious lesions in patients undergoing percutaneous biopsy.Methods
5 healthy female volunteers and 10 female patients prior to biopsy (later confirmed with 8 malignancies and 2 non-malignant lesions) were recruited. The confirmed malignancies included 6 Invasive Ductal Carcinoma (IDC), 1 IDC and Encapsulated Papillary Carcinoma (EPC), and 1 Invasive Mucinous Carcinoma (IMC). The non-malignant lesions included 1 Atypical Ductal Hyperplasia (ADH) and 1 Fibroadenoma. Two IDC patients were excluded from analysis due to the observable motion or the small size of lesion. The IMC patient was also excluded from the analysis because IMC and IDC are different tumor types. The local Institutional Review Board (IRB) approved the study.
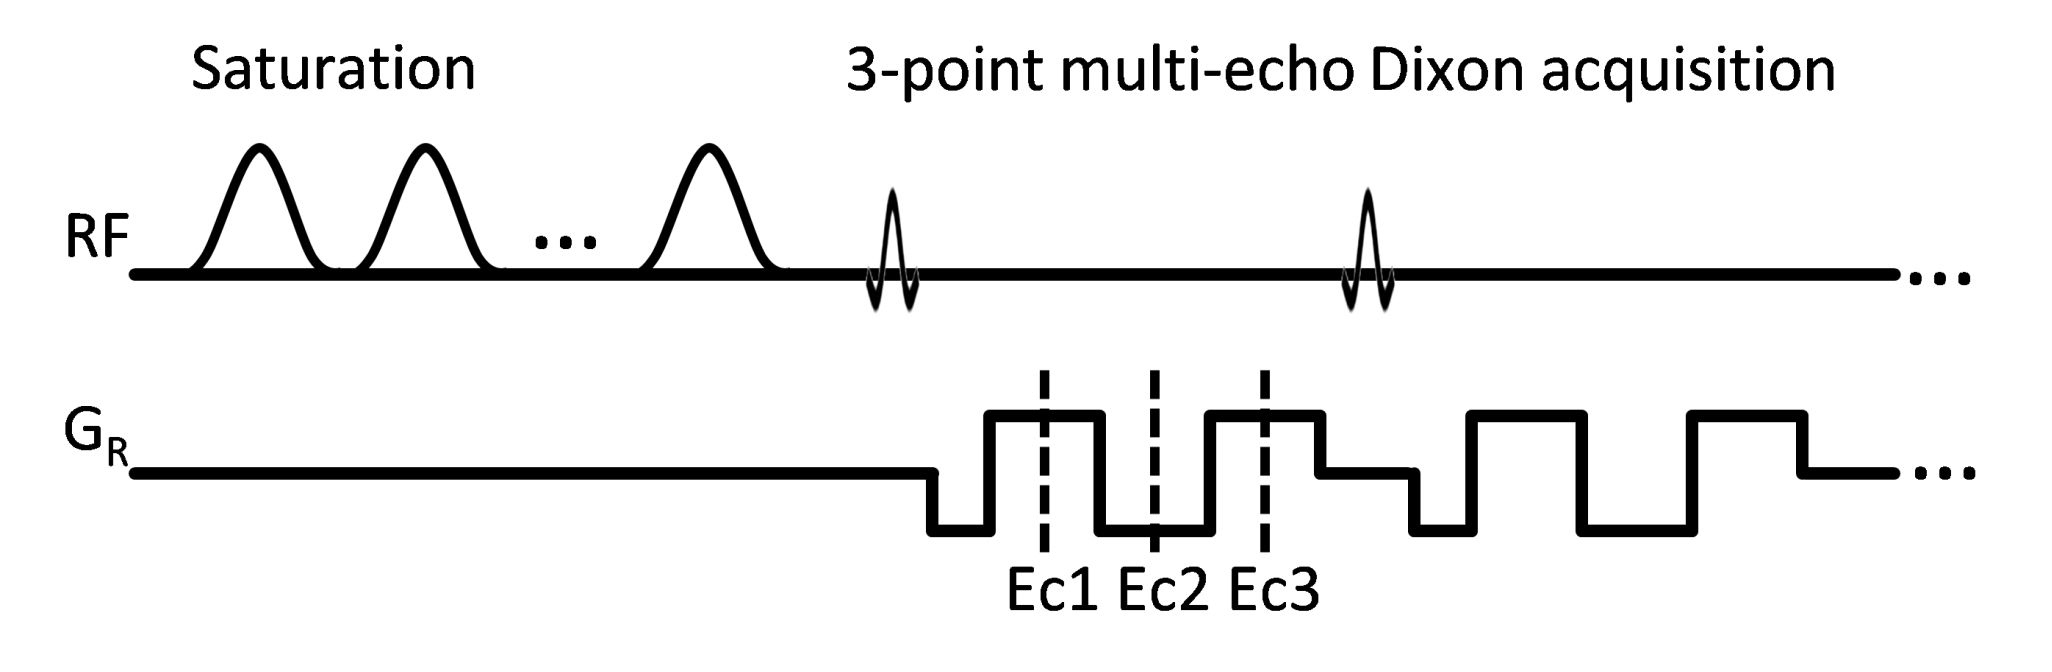
The scans were performed on a 3 T scanner (Ingenia, Philips Healthcare) using a 16-channel bilateral breast coil. The CEST images were acquired using a 2D multi-shot T1-weighted TFE sequence with 3-point multi-echo Dixon acquisition (Fig.1, TR/TE1/ΔTE=5.1/1.57/1.0 ms). The CEST saturation consisted of 10 hyperbolic secant pulses, 49.5 ms each, with inter-pulse delay 0.5 ms and B1rms=1.2 μT. 33 points in the Z-spectrum from -6 ppm to 6 ppm were acquired. Other imaging parameters included centric ordering, voxel size=2×2×5 mm3, FA=10°. After Dixon fat/water separation, water-only images were processed on a pixel-by-pixel basis. Field inhomogeneity was corrected using an averaged B0 map from all frequency offsets produced by mDixon post-processing. CEST maps were generated by integrating MTRasym in three ranges: (i) 0.8-1.2 ppm for hydroxyl groups, (ii) 1.8-2.2 ppm for amine groups and (iii) 3.3-3.7 ppm for amide groups. ROIs were placed manually on normal and/or malignant tissues identified by a fellowship trained breast-imaging radiologist. The patients are further stratified into three groups: ER-negative (ER-) IDC group (N=2), ER-positive (ER+) IDC group (N=3) and benign group (N=2). The ER- breast cancer lacks of the estrogen receptor, which is an index for sensitivity to endocrine treatment and is more aggressive than the ER+ breast cancer.7
Results
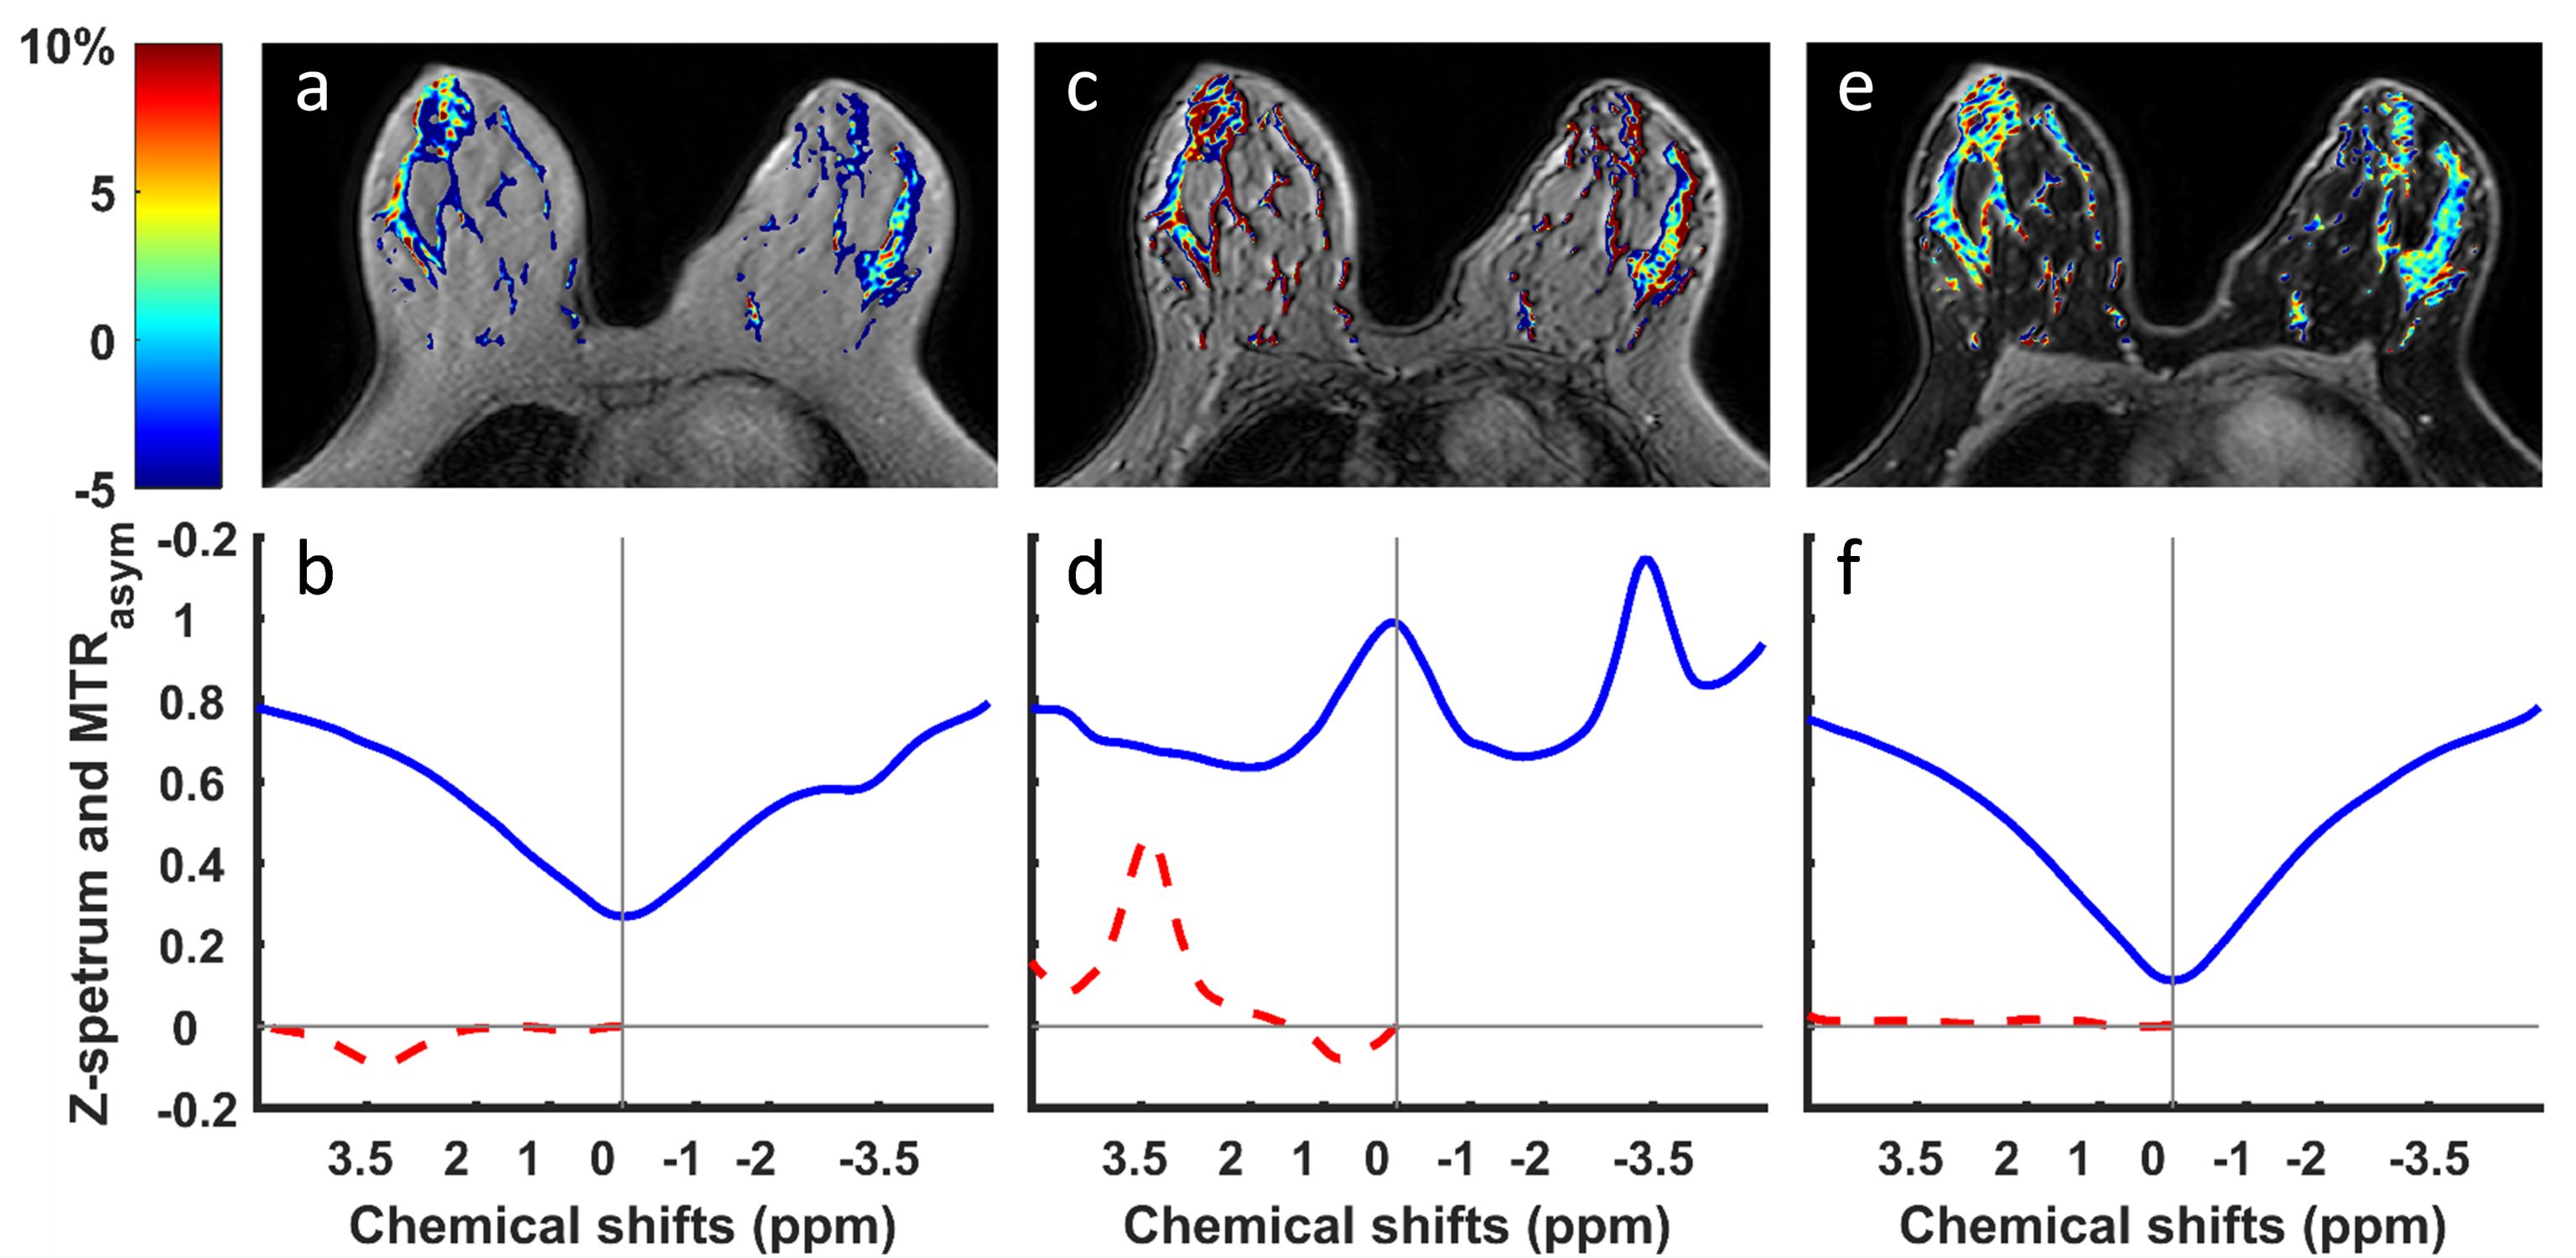
Figure 2 demonstrates that CEST-Dixon leads to much smoother Z-spectrum in the normal fibroglandular tissue and the overall influence of fat is removed. For comparison, Z-spectrum and APT maps using acquisition echoes close to In-Phase condition leads to large negative MTRasym at frequencies around 3.5 ppm (Fig. 2a,b). Z-spectrum using acquisition echoes close to Out-of-Phase is even worse (Fig. 2c,d). This complex behavior was discussed in an earlier publication.8 Moreover, the Z-spectrum from water-only images displays higher suppression levels near water resonance, almost zero, as should be expected (Fig. 2f).
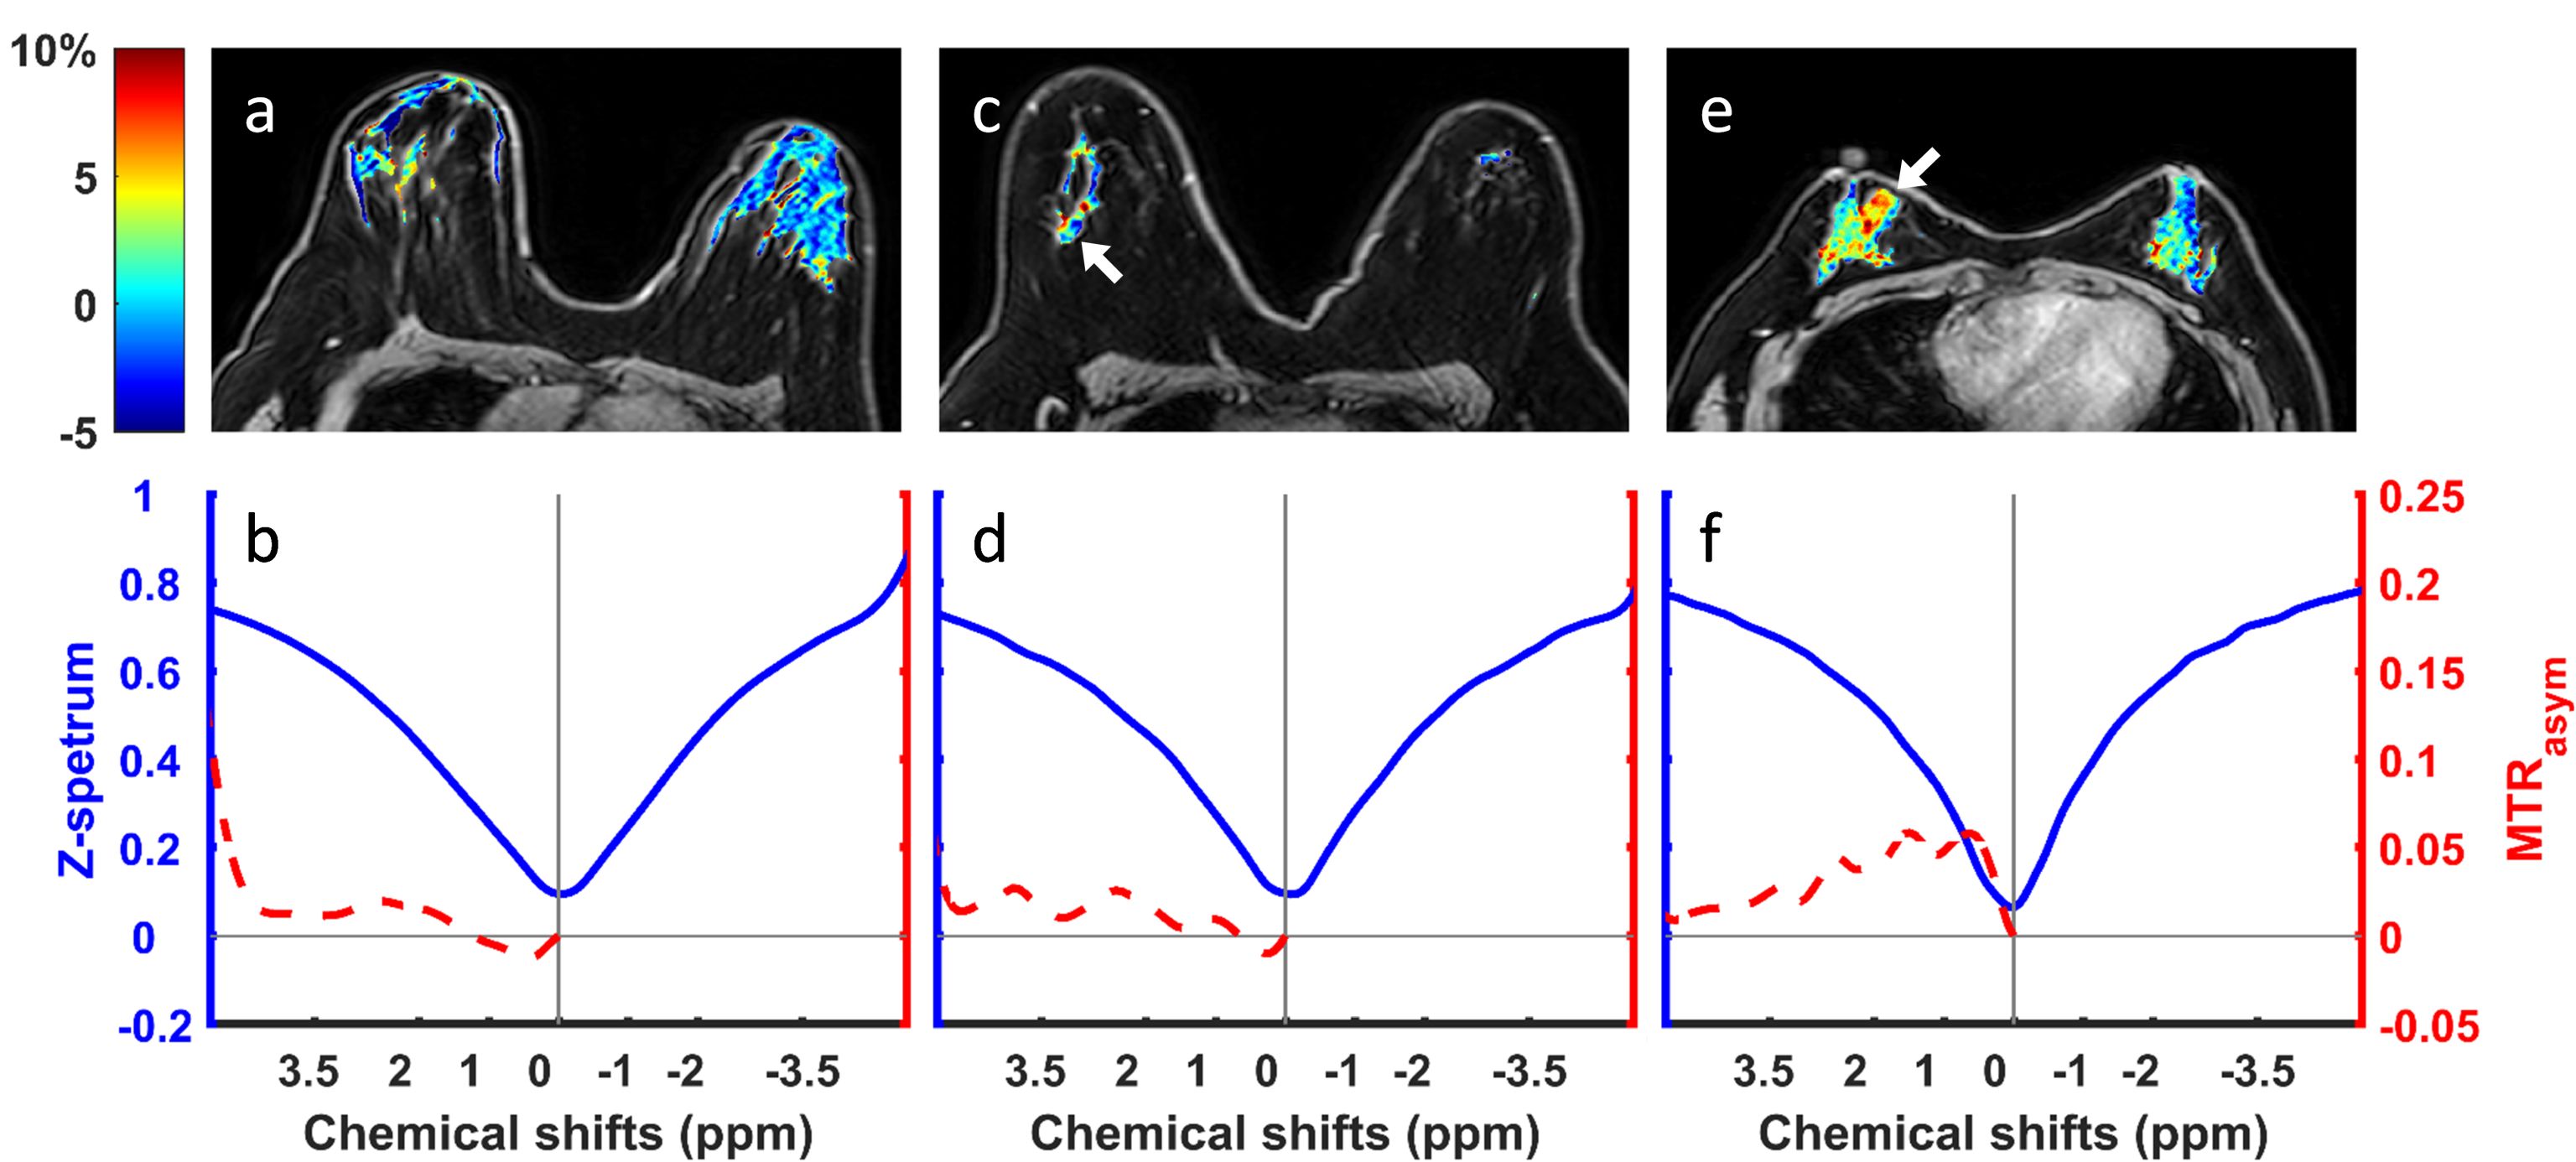
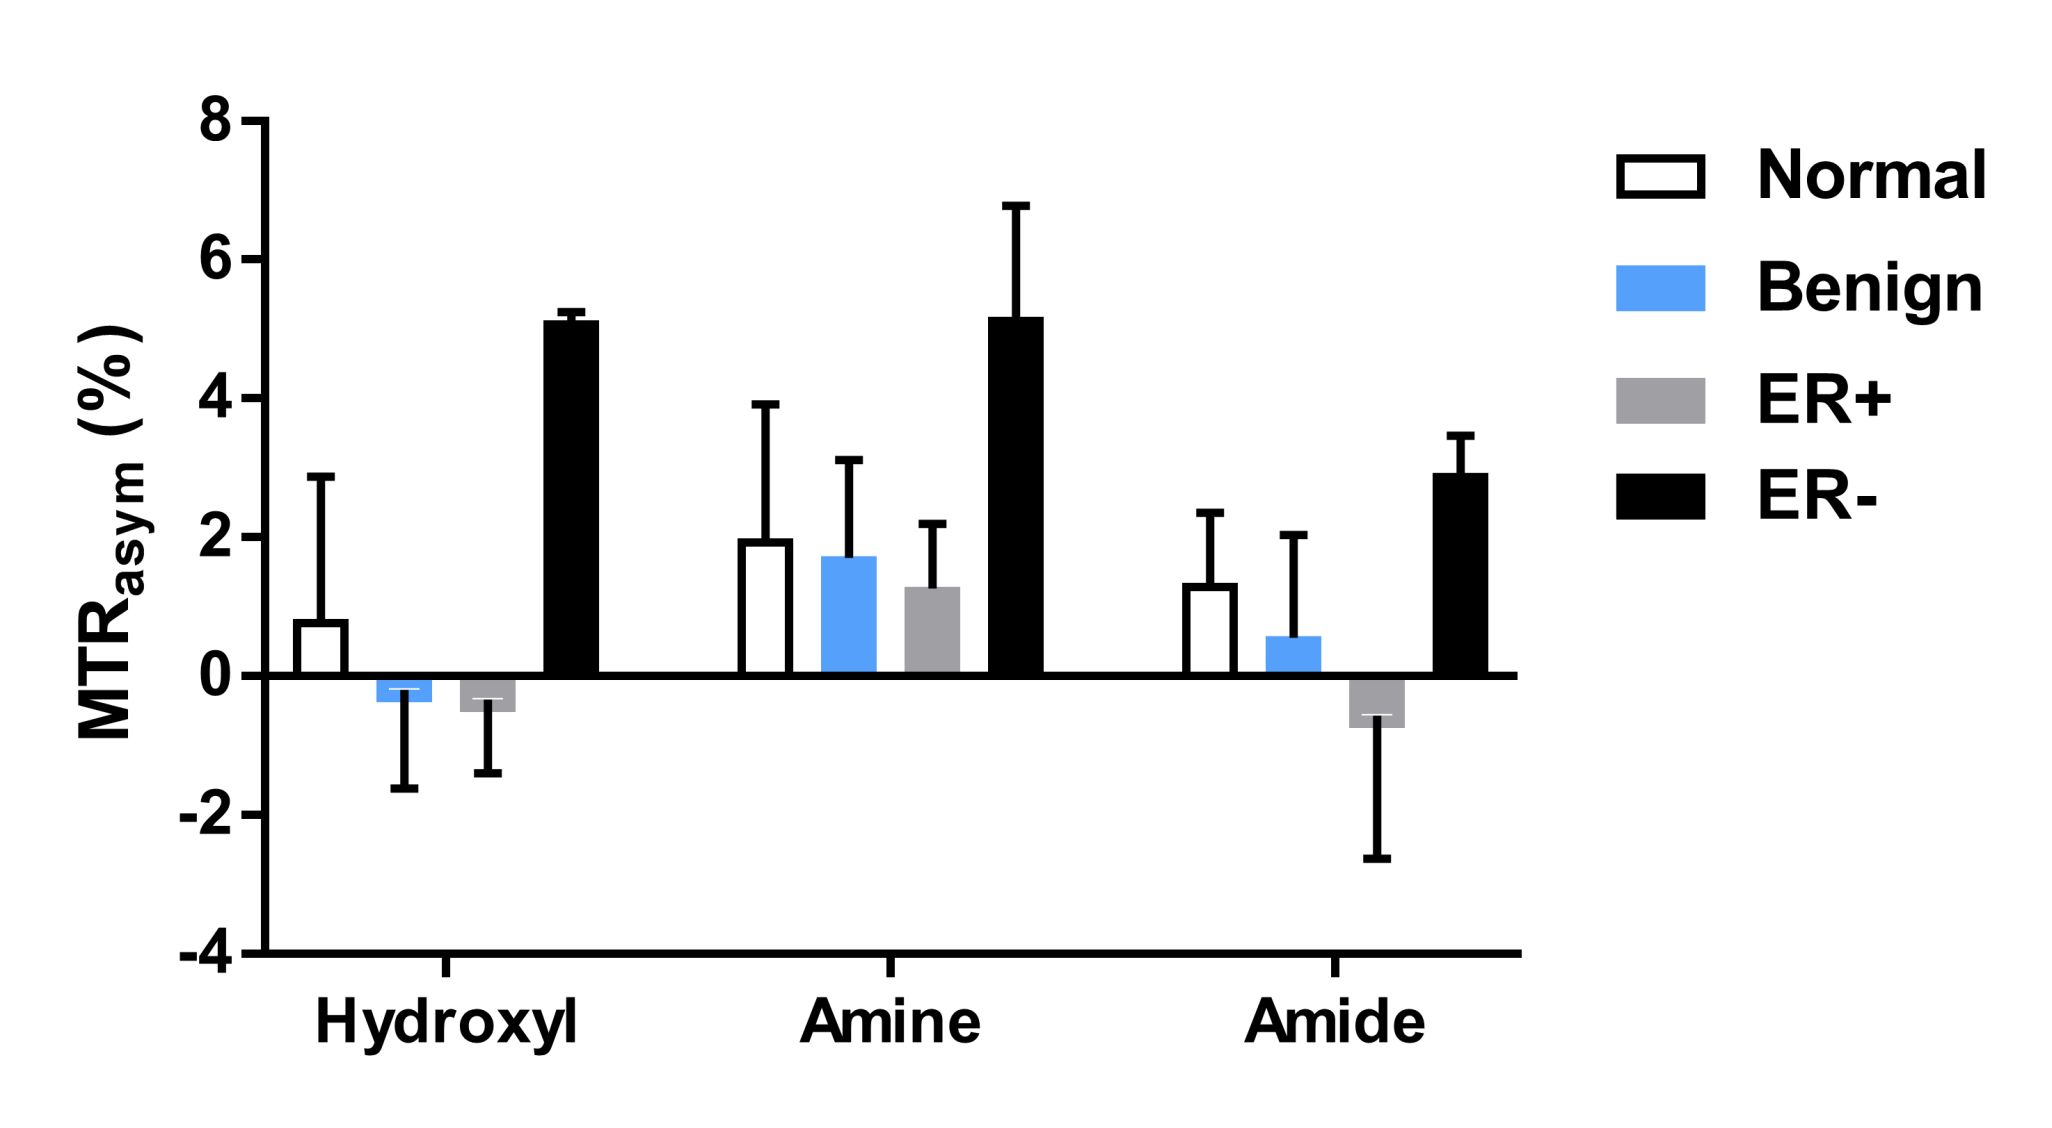
Figure 3 shows the representative hydroxyl CEST maps and ROI averaged Z-spectra and MTRasym for a healthy volunteer (Fig. 3a,b), a triple-negative IDC patient (Fig. 3c,d) and a non-triple-negative IDC patient (Fig. 3e,f). The MTRasym in the three CEST frequency ranges of all the subjects are summarized in Figure 4. It can be seen that the ER- IDC group results in higher CEST effects in all the three frequency ranges than the ER+ IDC, benign and normal groups. Moreover, the hydroxyl range has the largest difference between the ER- IDC and the other groups. However, the ER+ IDC, benign and normal groups tend to have similar CEST effects, which suggest that the ER+ IDC group is indistinguishable from normal and benign groups in the three frequency ranges.
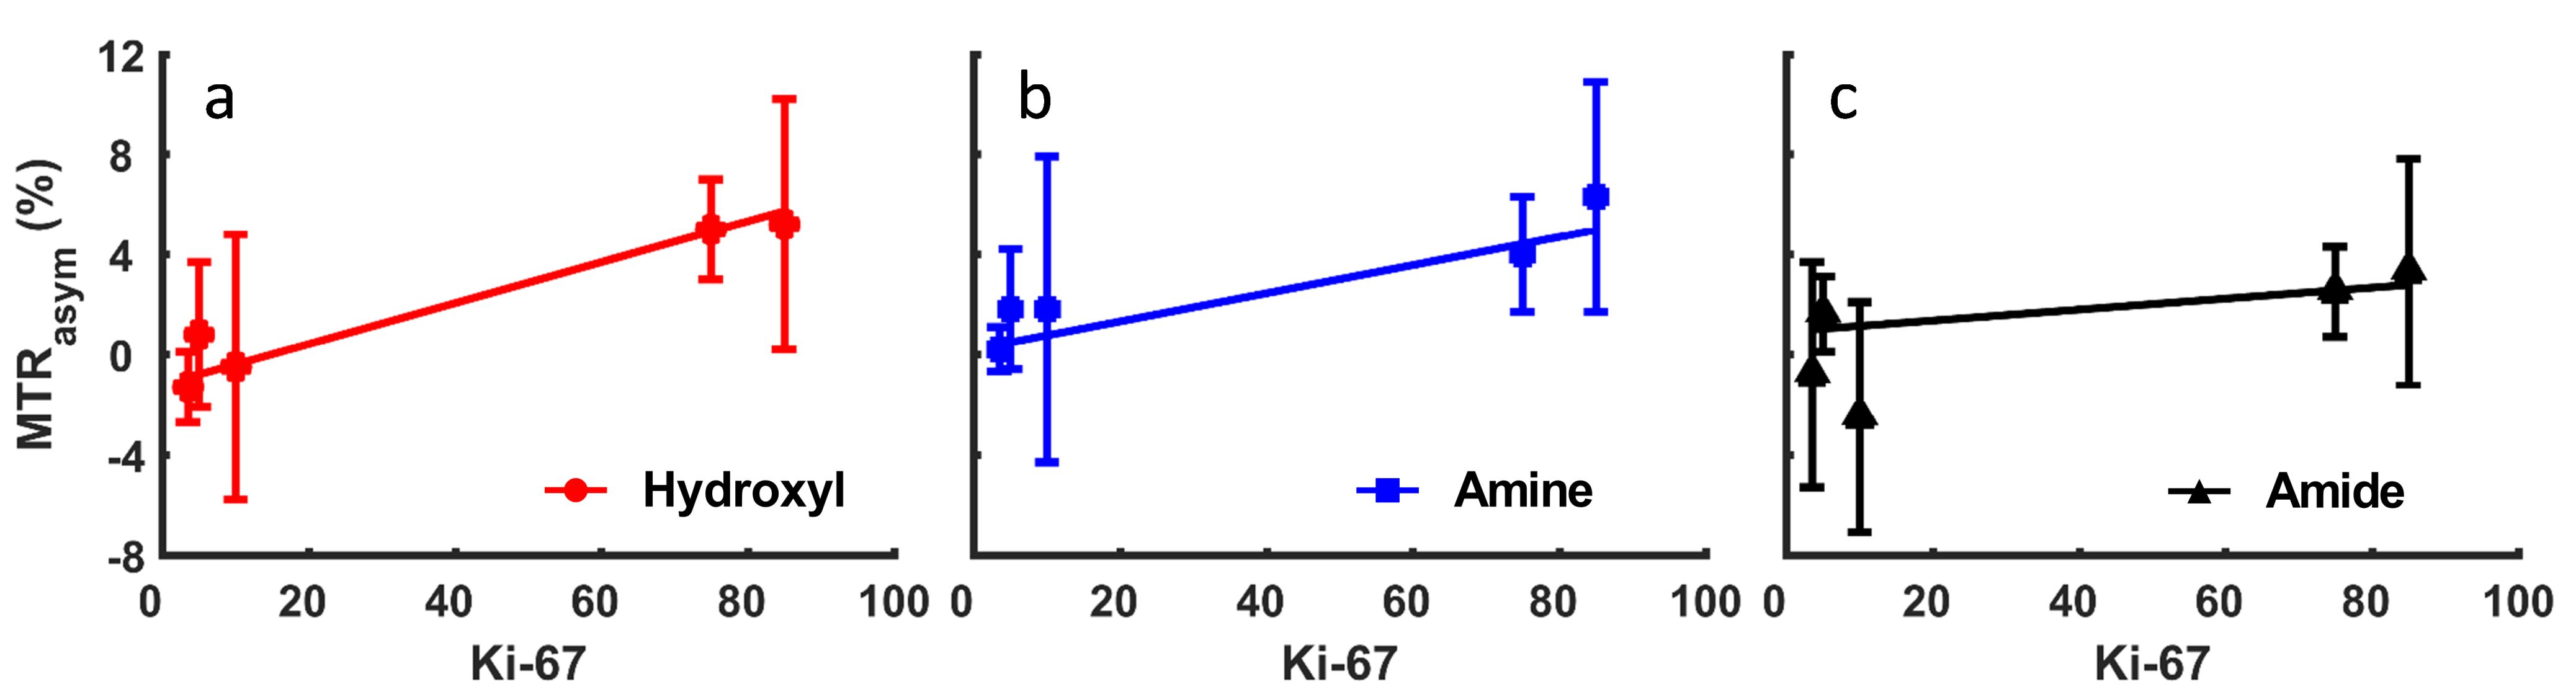
In Figure 5, the tumor MTRasym in the three frequency ranges are plotted against the Ki-67. It is evident that the MTRasym increases as Ki-67 level increases for all the frequency ranges. The R2 values were 0.95, 0.87 and 0.36 for hydroxyl, amine and amide frequency ranges, respectively. These results are one of the first correlations of CEST with Ki-67 in-vivo.
Conclusion
The CEST-Dixon method is promising for CEST MRI in breast at 3 T, reliably eliminating unwanted lipid artifacts. The CEST effects are higher in the ER- IDC than the ER+ IDC, benign and normal groups. The results also indicate correlation of CEST with the Ki-67 level. Thus, CEST-Dixon has a potential for improved non-invasive characterization of breast lesions, potentially differentiating more aggressive from less aggressive tumors.Acknowledgements
The research was supported by the NIH grant R21 EB020245 and the University of Texas Southwestern Medical Center Radiology Research fund.References
- Jones CK, Schlosser MJ, van Zijl P, et al. Amide proton transfer imaging of human brain tumors at 3T. Magn Reson Med. 2006;56(3):585-592.
- Zhou J, Tryggestad E, Wen Z, et al. Differentiation between glioma and radiation necrosis using molecular magnetic resonance imaging of endogenous proteins and peptides. Nat Med. 2011;17(1):130-134.
- Schmitt B, Trattnig S, Schlemmer H-P. CEST-imaging: A new contrast in MR-mammography by means of chemical exchange saturation transfer. Eur J Radiol. 2012;81:S144-S146.
- Dula AN, Arlinghaus LR, Dortch RD, et al. Amide proton transfer imaging of the breast at 3 T: establishing reproducibility and possible feasibility assessing chemotherapy response. Magn Reson Med. 2013;70(1):216-224.
- Song X, Airan RD, Arifin DR, et al. Label-free in vivo molecular imaging of underglycosylated mucin-1 expression in tumour cells. Nat Commun. 2015;6:6719.
- Chan KW, Jiang L, Cheng M, et al. CEST-MRI detects metabolite levels altered by breast cancer cell aggressiveness and chemotherapy response. NMR Biomed. 2016;29(6):806-816.
- Sheikh MS, Garcia M, Pujol P, et al. Why are estrogen-receptor-negative breast cancers more aggressive than the estrogen-receptor-positive breast cancers? Invasion Metastasis. 1994;14(1-6):329-336.
- Zhang S, Keupp J, Wang X, et al. Z-spectrum appearance and interpretation in the presence of fat: Influence of acquisition parameters. Magn Reson Med. 2017:doi: 10.1002/mrm.26900.
Figures