0408
NOE-mediated CEST Imaging of Glioma at 7 Tesla Aids Early Response Evaluation of Patients Undergoing Radio-Chemotherapy1Medical Physics in Radiology, German Cancer Research Center (DKFZ), Heidelberg, Germany, 2Radiation Oncology, Medical Faculty, University of Heidelberg, Heidelberg, Germany, 3Radiology, German Cancer Research Center (DKFZ), Heidelberg, Germany
Synopsis
Reliable biomarkers for an early assessment of treatment response are urgently needed. In this study, we investigated the rNOE-mediated CEST signals in patients undergoing radio- and chemotherapy at three different time points including pre and post treatment. The results were compared to the standard clinical determination of responders and non-responders (RANO criteria) and the relaxation compensated CEST contrast NOEAREX showed a statistically significant difference between the two groups directly after therapy. Hence, NOEAREX might potentially help determining early tumor response to therapy.
Purpose
Patients with newly diagnosed inoperable glioma receive a combination of radiotherapy and chemotherapy1. An early assessment of treatment response, in particular the determination of non-responders, would allow adjusting the treatment if necessary. Relayed nuclear Overhauser effect (rNOE) Chemical Exchange Saturation Transfer (CEST) signals associated with bulk mobile proteins and lipids have been reported to be decreased in glioma2–4 and to correlate with histopathological grade5. Thus, rNOE-CEST signals may be a promising contrast to assess radiotherapy-induced changes.Methods
Study design: Twelve patients with newly diagnosed glioma were included in this study. Each patient was measured 3 times in 6 week intervals. After the first measurement the patients received definitive radio-chemotherapy for a total of 6 weeks. The second measurement was performed within one week after the treatment (post treatment) and an additional measurement was performed 6 weeks later (follow-up), resulting in a total investigation time of 12-14 weeks. RANO (Response Assessment in Neuro-Oncology6) criteria were used to distinguish responders (defined as complete response, partial response, or stable disease) from non-responders (progressive disease). The study was approved by the local ethics committee of the Medical Faculty of the University of Heidelberg and written consent was received from all patients.
Imaging: Spectrally highly-resolved Z-spectra were obtained with a centric-reordered 2D GRE CEST sequence (three slices with resolution of 1.71x1.72x5 mm3) implemented on a Siemens MAGNETOM 7 T whole-body scanner using a 24-channel head coil for reception. For saturation, 150 Gaussian–shaped rf pulses with length tp = 15 ms and duty cycle DC = 50% were applied. This pulse train was applied with two saturation amplitudes of B1 = 0.6 and 1.0 μT. 59 adapted frequency offsets were acquired in the range from -300 to 300 ppm. T1–mapping was achieved by adiabatic inversion recovery GRE. High resolution T2–weighted (T2w) imaging of the whole brain was performed using a TSE sequence (resolution: 0.4x0.4x2 mm3). The WASABI sequence7 yielded maps of B0 and B1 field inhomogeneities.
Post processing: Image registration was
performed to the first measurement (pre treatment) using MITK software8. Lorentzian fit
analysis allowed the isolation of the CEST peaks in B1-corrected
Z-spectra9. Application of the
inverse metric at -3.5ppm yielded the relaxation-compensated CEST contrast NOEAREX4.
Results
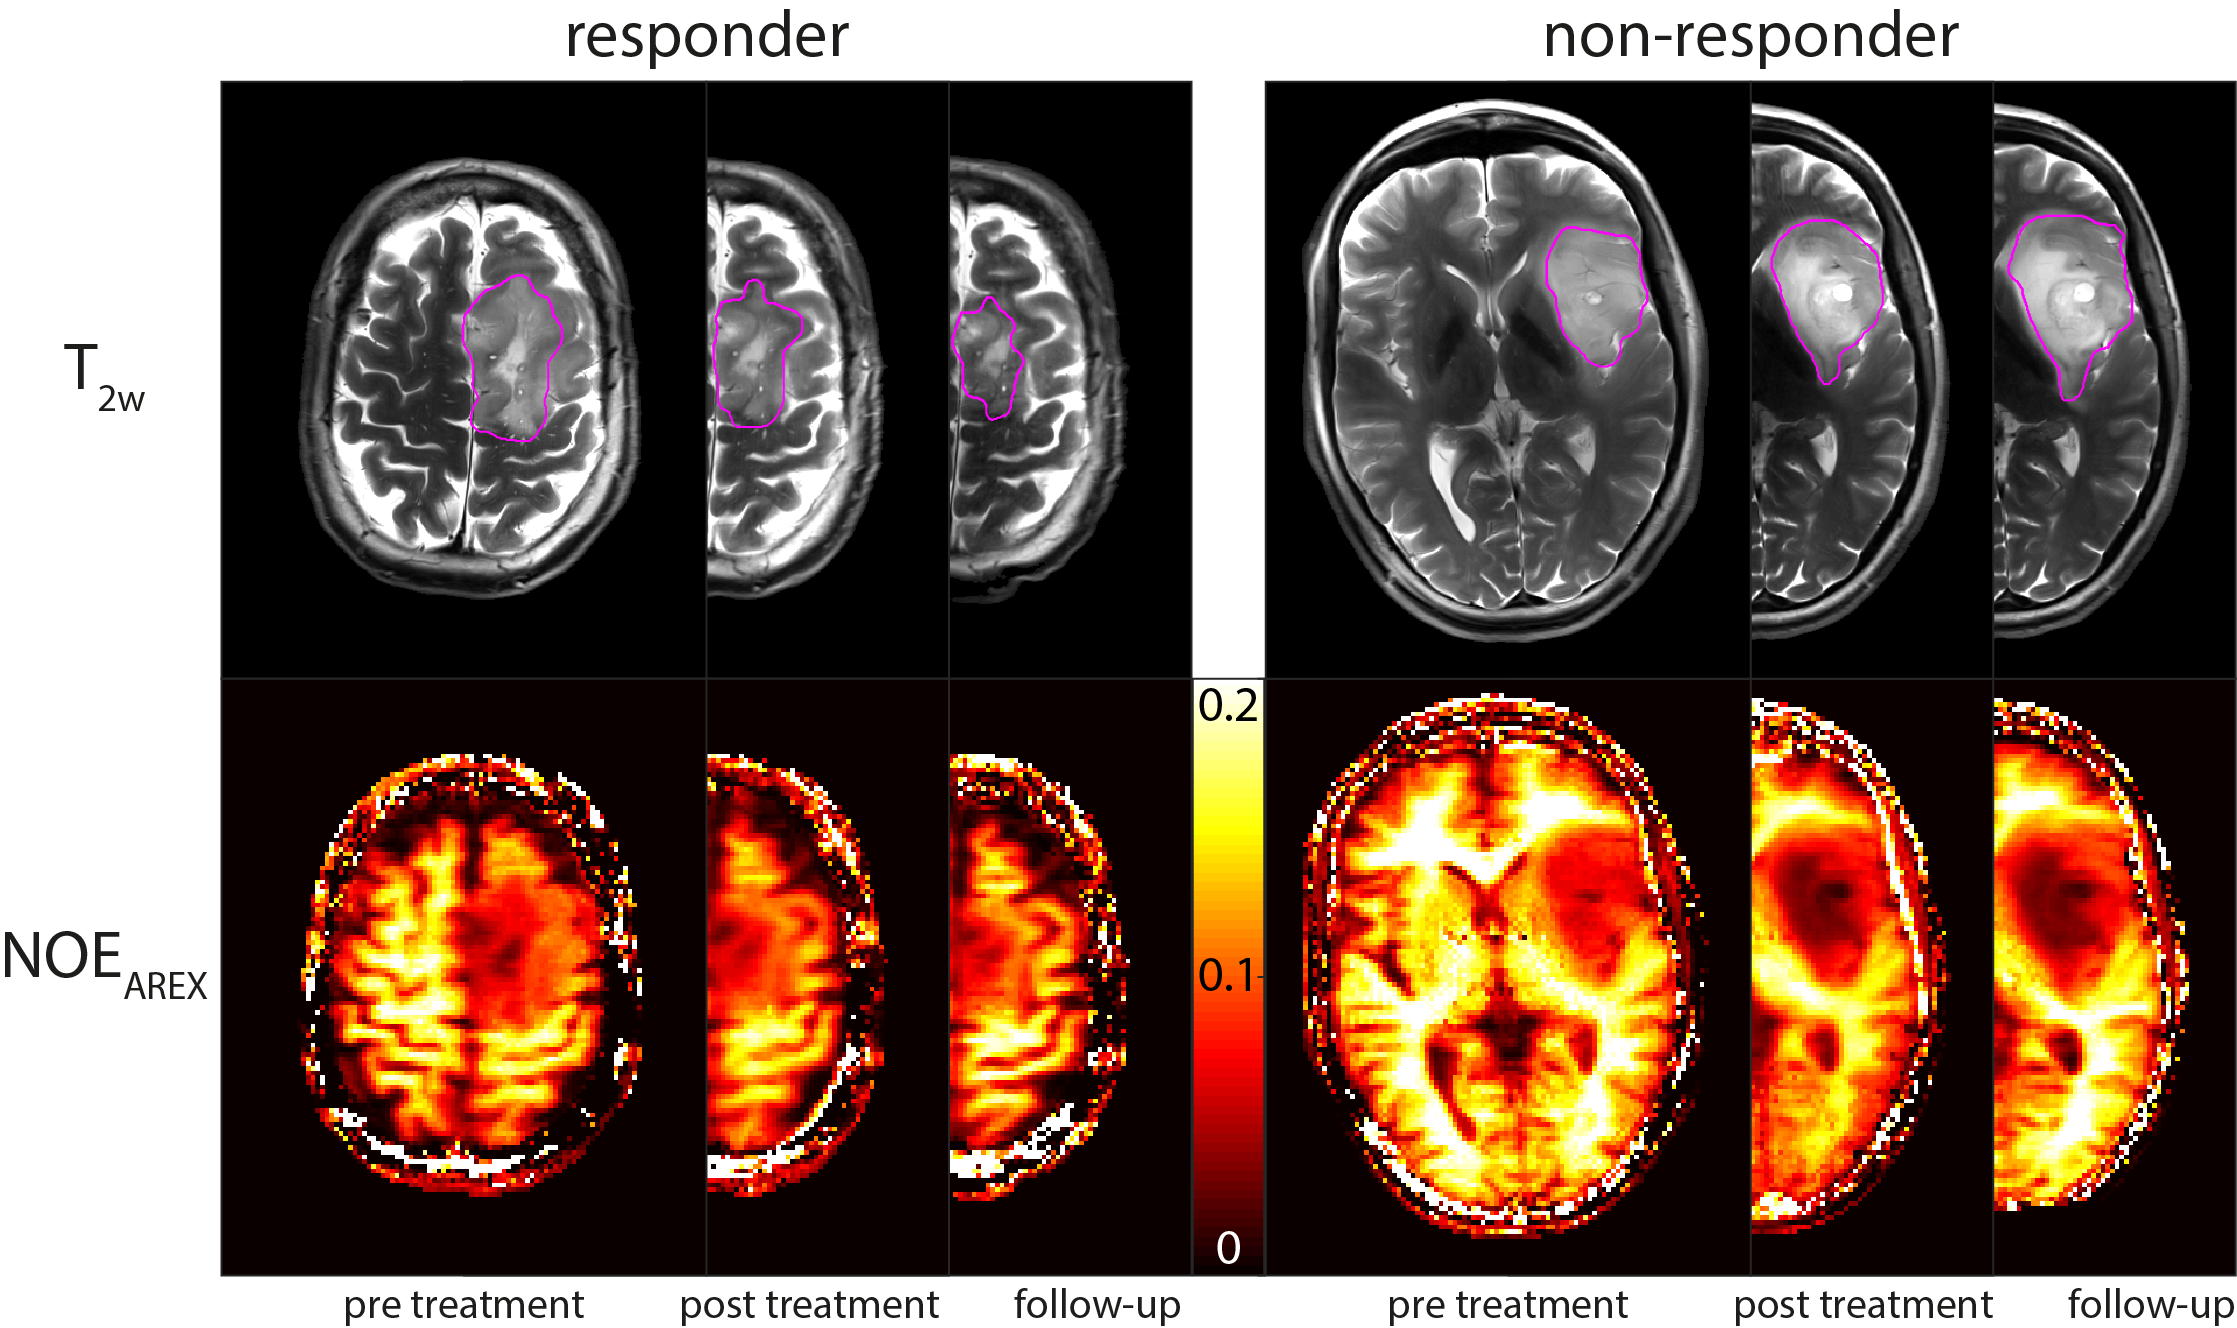
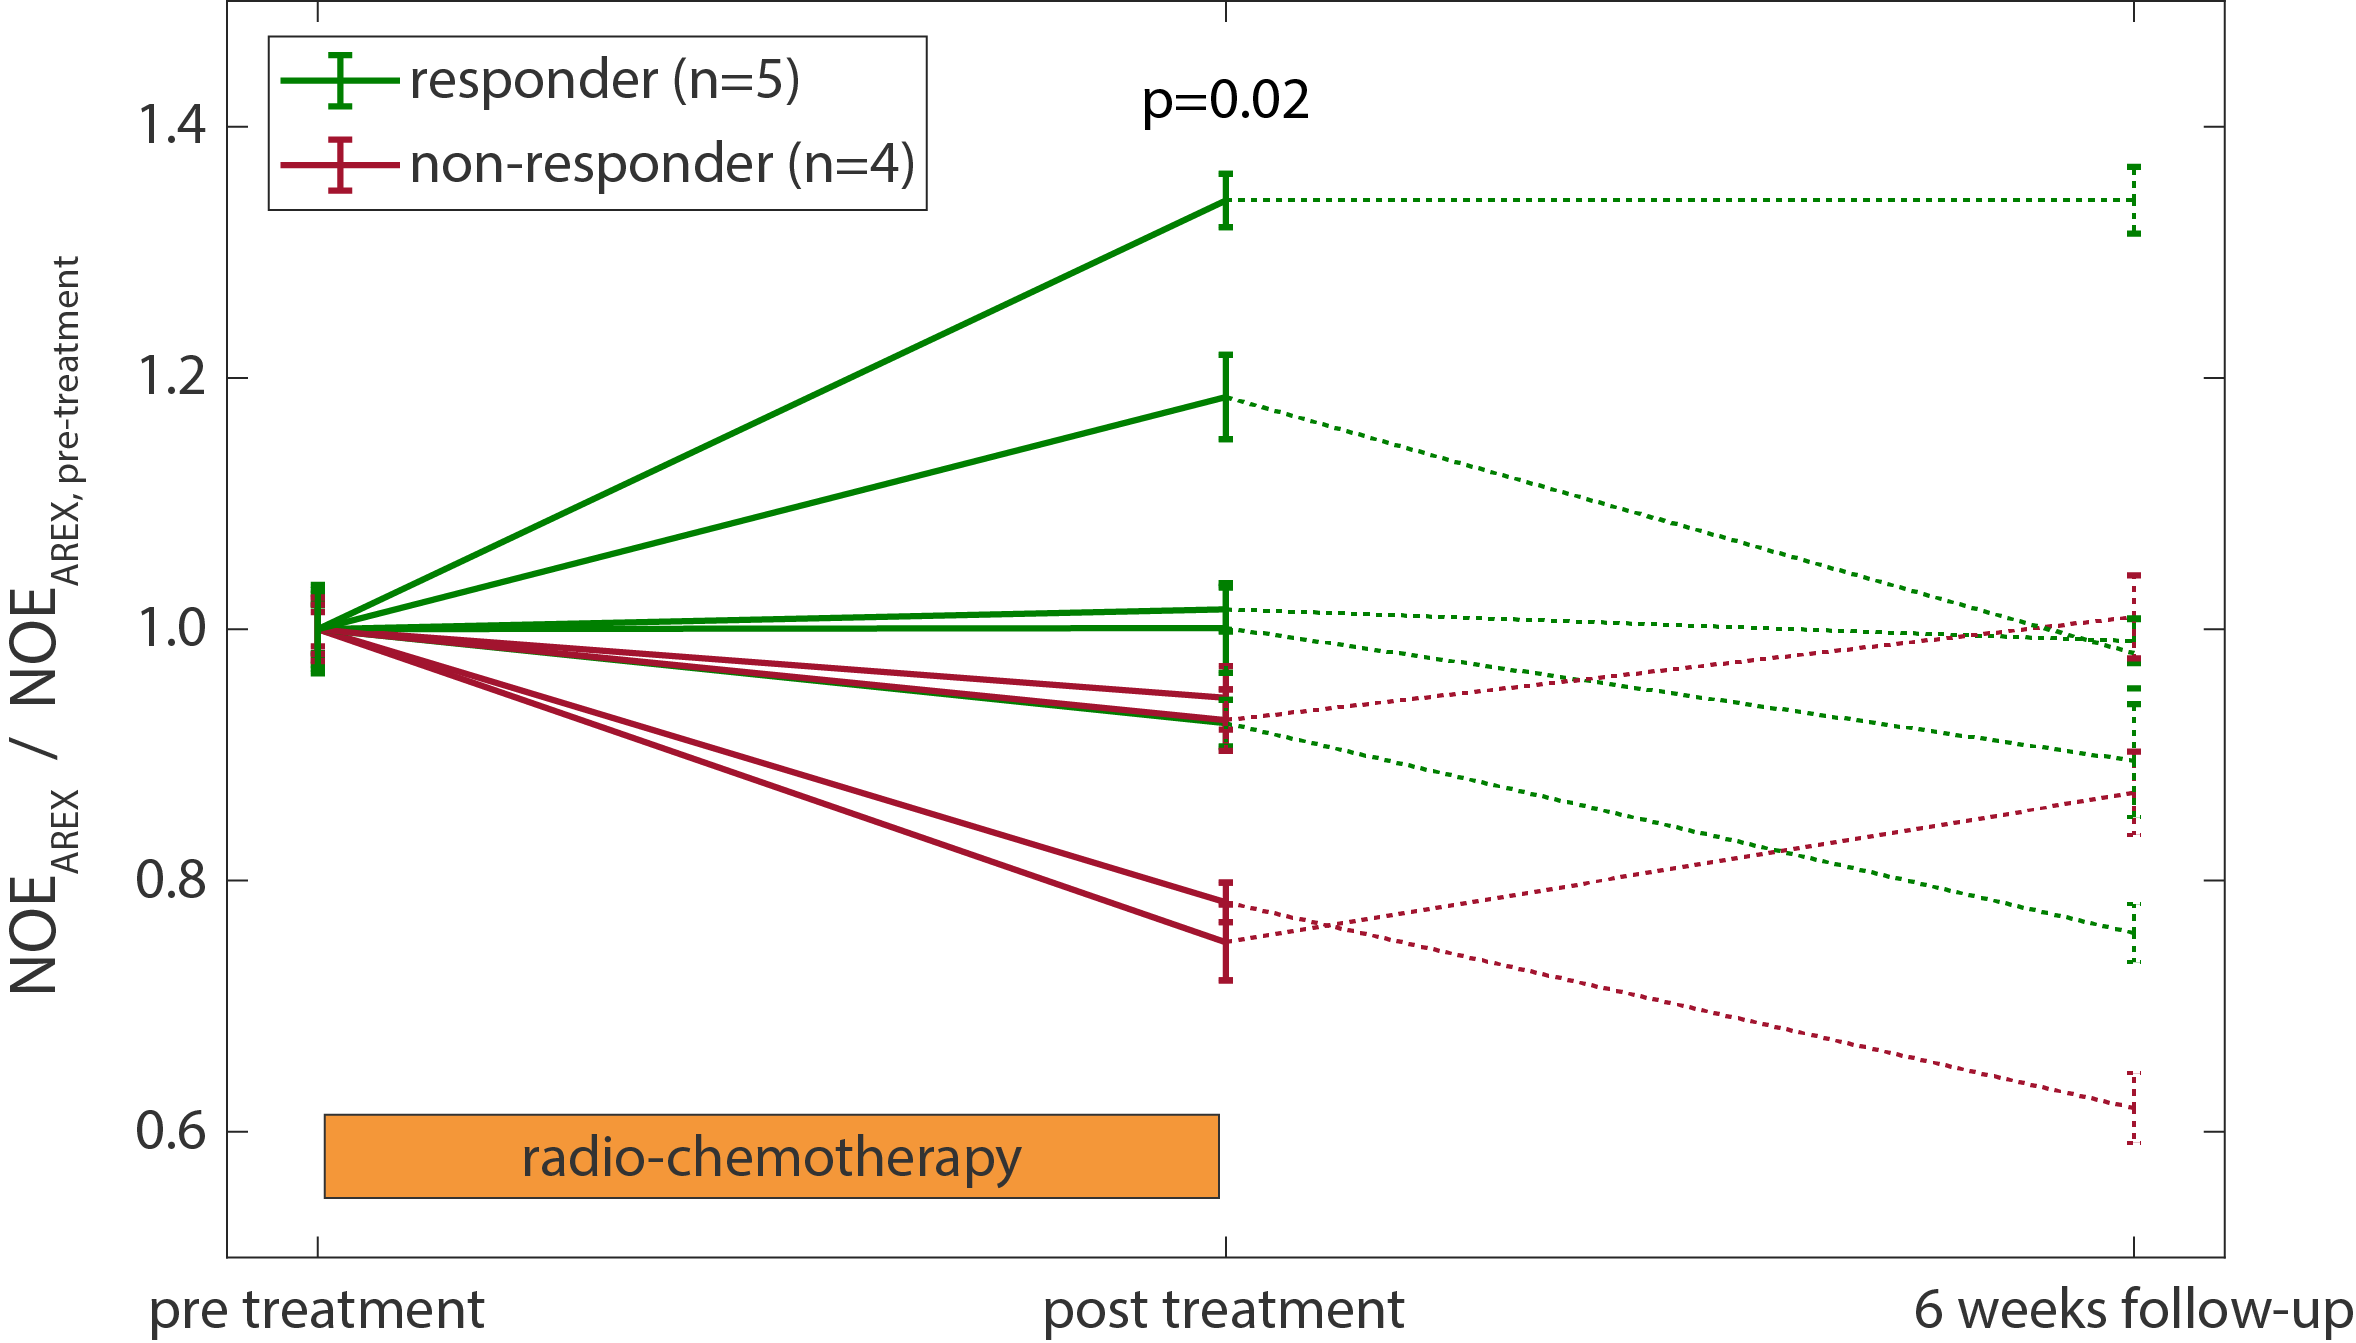
Three patients were not included in the statistical analysis since they only participated in the first MRI scan. According to the RANO criteria, five of the remaining nine patients were classified as responders, while four did not respond to the radio-chemotherapy. Figure 1 shows T2w images and the NOEAREX contrast of a responder (left) and a non-responder (right) for the three measurement time points. The tumor extent, excluding edema and necrosis, as visible on T2w (magenta), was used for statistical evaluation. The evolution of NOEAREX (normalized to pre treatment) is shown in Figure 2. While the NOEAREX of responders remains constant or increases under radio-chemotherapy, non-responders show a decrease of NOEAREX from pre to post treatment. The 6 week follow-up measurement shows a large heterogeneity in both groups. A two-tailed Wilcoxon rank sum test revealed statistically significant differences between responders and non-responders in the NOEAREX signal immediately after therapy (p=0.02), while there were no significant differences between the two groups prior to therapy (p=0.89).Discussion and Conclusions
Decreased NOEAREX signals in the tumor before treatment are in accordance with previous studies2–4. The NOEAREX signal directly after treatment allowed discrimination between responders and non-responders, which is 6 weeks earlier than the standard clinical evaluation. The continuing decrease of NOEAREX in non-responders might reflect tumor progression and could therefore aid the early response evaluation of glioma patients undergoing radio-chemotherapy.Acknowledgements
No acknowledgement found.References
1. Stupp, R. et al. Radiotherapy plus concomitant and adjuvant temozolomide for glioblastoma. N. Engl. J. Med. 352, 987–96 (2005).
2. Jones, C. K. et al. Nuclear Overhauser enhancement (NOE) imaging in the human brain at 7T. Neuroimage 77, 114–124 (2013).
3. Paech, D. et al. Nuclear overhauser enhancement mediated chemical exchange saturation transfer imaging at 7 tesla in glioblastoma patients. PLoS One 9, e104181 (2014).
4. Zaiss, M. et al. Relaxation-compensated CEST-MRI of the human brain at 7T: Unbiased insight into NOE and amide signal changes in human glioblastoma. Neuroimage 112, 180–188 (2015).
5. Heo, H.-Y. et al. Whole-brain amide proton transfer (APT) and nuclear overhauser enhancement (NOE) imaging in glioma patients using low-power steady-state pulsed chemical exchange saturation transfer (CEST) imaging at 7T. J. Magn. Reson. Imaging 44, 41–50 (2016).
6. Wen, P. Y. et al. Neuro-Oncology response assessment in clinical trials. J. Clin. Oncol. 35, (2017).
7. Schuenke, P. et al. Simultaneous mapping of water shift and B1(WASABI)-Application to field-Inhomogeneity correction of CEST MRI data. Magn. Reson. Med. 77, 571–580 (2016).
8. Nolden, M. et al. The medical imaging interaction toolkit: Challenges and advances: 10 years of open-source development. Int. J. Comput. Assist. Radiol. Surg. 8, 607–620 (2013).
9. Windschuh, J. et al.
Correction of B1-inhomogeneities for relaxation-compensated CEST imaging at 7
T. NMR Biomed. 28, 529–37 (2015).
Figures