0406
Renal pH Imaging Using Aspirin Analogs and CEST MRI1Russell H. Morgan Department of Radiology and Radiological Science, Johns Hopkins University School of Medicine, Baltimore, MD, United States, 2F. M. Kirby Research Center for Functional Brain Imaging, Kennedy Krieger Research Institute, Baltimore, MD, United States
Synopsis
Developing new tools that can be used to detect changes in renal tissue is of great interest for nephrologists. Indeed, standard measurements of blood-urea nitrogen and serum creatinine might not detect kidney injury until a 50% loss in function occurs. As kidneys play a preeminent role in controlling acid-base balance, pH mapping should enable early detection of changes in renal health. Here we propose administration of salicylate based diaCEST MRI agents to map renal pH. As we show, aspirin and three analogs: salicylic acid, 2,4-dihydroxy benzoic acid, 2,5-dihydroxy benzoic acid displayed promise in vitro and in vivo for pH mapping.
Target Audience:
Researchers, radiologists and nephrologists interested in CEST MRI and renal pH imaging.Purpose:
To find suitable diaCEST agents and develop novel CEST MRI methods for determining renal pH.Introduction:
Acute Kidney Injury (AKI) is a condition that is generally detected through measuring proteinuria or estimating the Glomerular Filtration Rate (eGFR), however better tools for monitoring this condition are desired to better predict clinical outcome. CEST MRI has gained much attention recently for its amplification of solute signal and sensitivity to pH, enabling production of high resolution pH maps. As one of the primary functions of the kidneys is to regulate acid base equilibrium, renal pH could be an excellent biomarker1. Conventionally, CEST pH maps are generated based on the ratio of saturation transfer for two exchangeable sites to discriminate changes in pH from changes in agent concentration2. We have identified a number of aspirin analogs which produce excellent CEST MRI contrast at 3T3 however, these analogs contain only one exchangeable site which necessitates development of new methods to acquire pH maps. We test three pH measurement techniques developed for agents with only one exchangeable proton.
Methods:
In vitro: Phantoms were prepared by dissolving 25 mM, 12 mM or 4 mM of 3 salicylates (sodium salicylate, 2,4-dihydroxy benzoic acid (2,4-DHB), 2,5-dihydroxy benzoic acid (2,5-DHB)) in PBS and adjusting to pH = 6.0, 6.3, 6.4, 6.6, 6.9, 7.2, 7.3 and 7.5. A RARE sequence with CW saturation pulse, (length = 3 sec, saturation field strength (B1) from 1.2 μT to 12 μT) was used to generate Z-spectra on an 11.7 T vertical bore Bruker Biospec scanner at 370C with images acquired by incrementing the saturation frequency every 0.5 ppm from -12 to 12 ppm (TR = 6 s, effective TE = 43.5 ms, RARE Factor = 16, matrix = 64 × 32, slice thickness = 1.0 mm).
In vivo: Adult female Lewis rats were anesthetized using 0.5-2.5 % of isoflurane and placed in a rat spinal cord coil. Their breath rate was monitored throughout the experiments. 1 ml of 150 mM salicylate was administered via tail vein, and CEST Images acquired on an 11.7 T horizontal bore Bruker Biospec scanner with 1.5 mm thick coronal slice using a modified CEST EPI pulse sequence to minimize motion artifacts. A navigator and trigger were incorporated into the pulse sequence to minimize motion effects. Using a CW saturation pulse (length = 3 s, B1 = 6 μT) CEST images were collected using 12 saturation offsets from -10.4 to -8.4 ppm and from 10.8 to 8.8 ppm with a 0.5 ppm increment, and ±0.3, 0.7 ppm. WASSER images were collected prior to administration using 42 offsets from -1.5 ppm to +1.5 ppm at B1 = 1.5 μT and for generating B0 maps.
Results and Discussion:
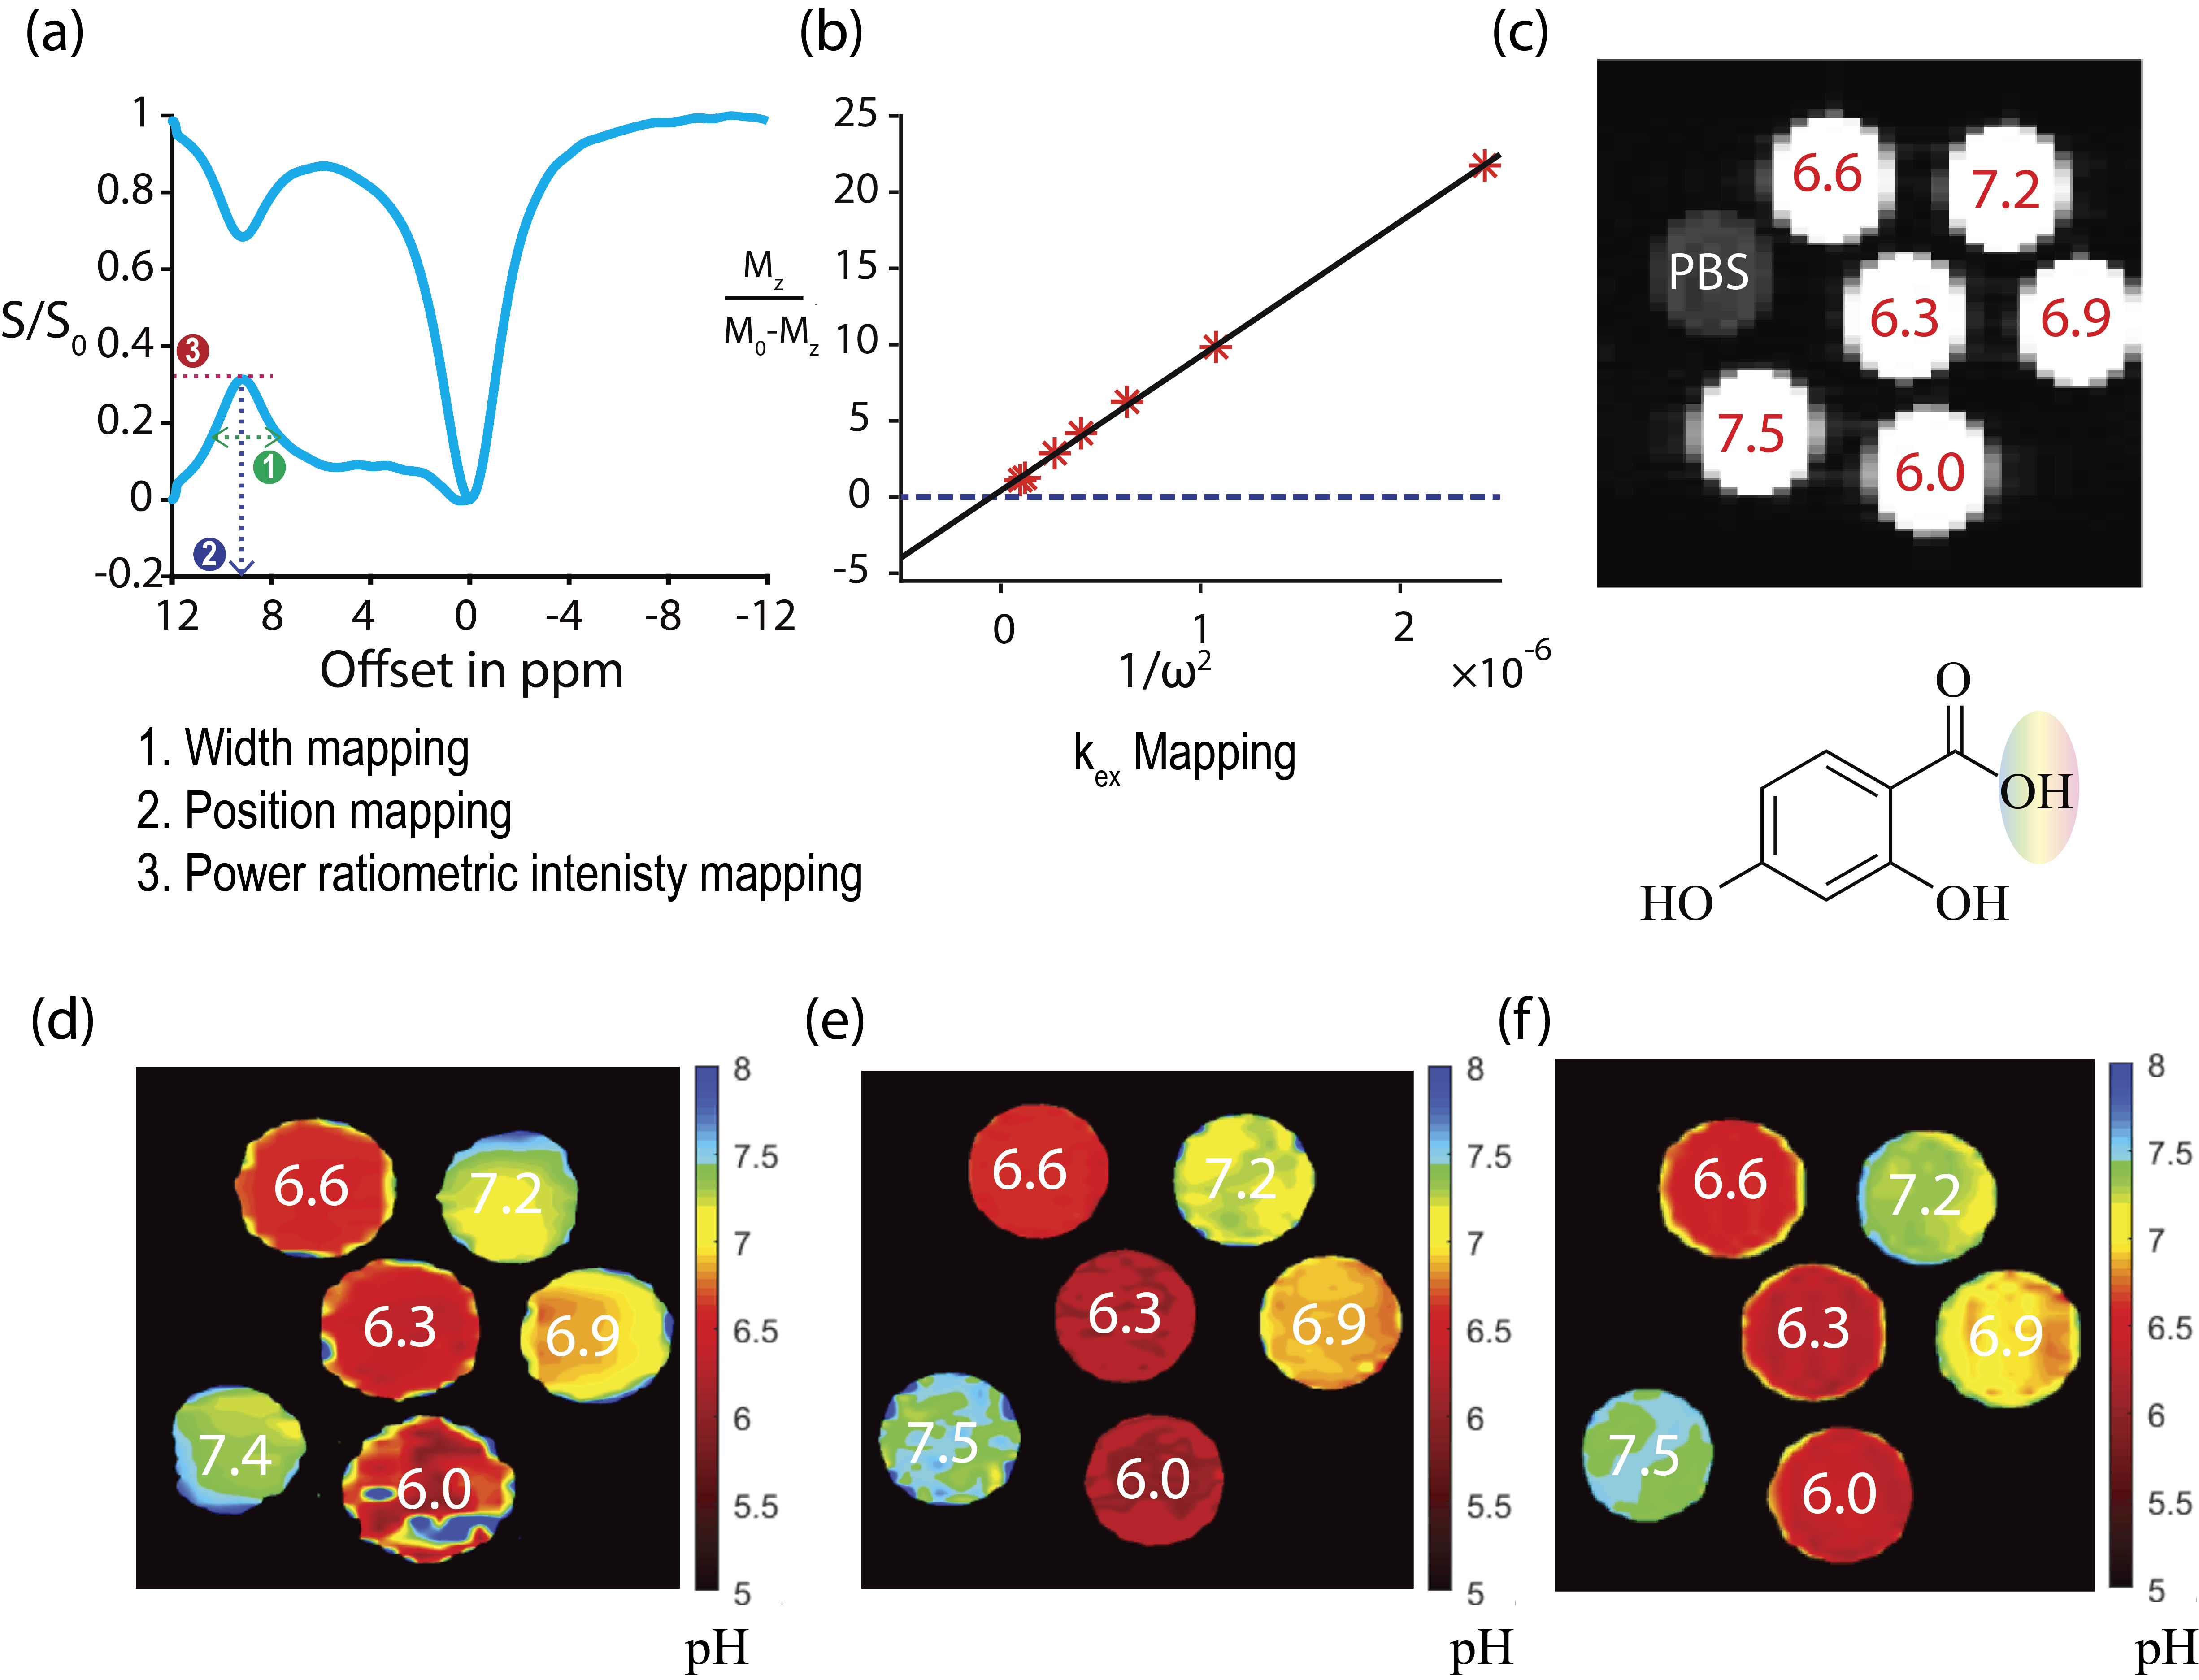
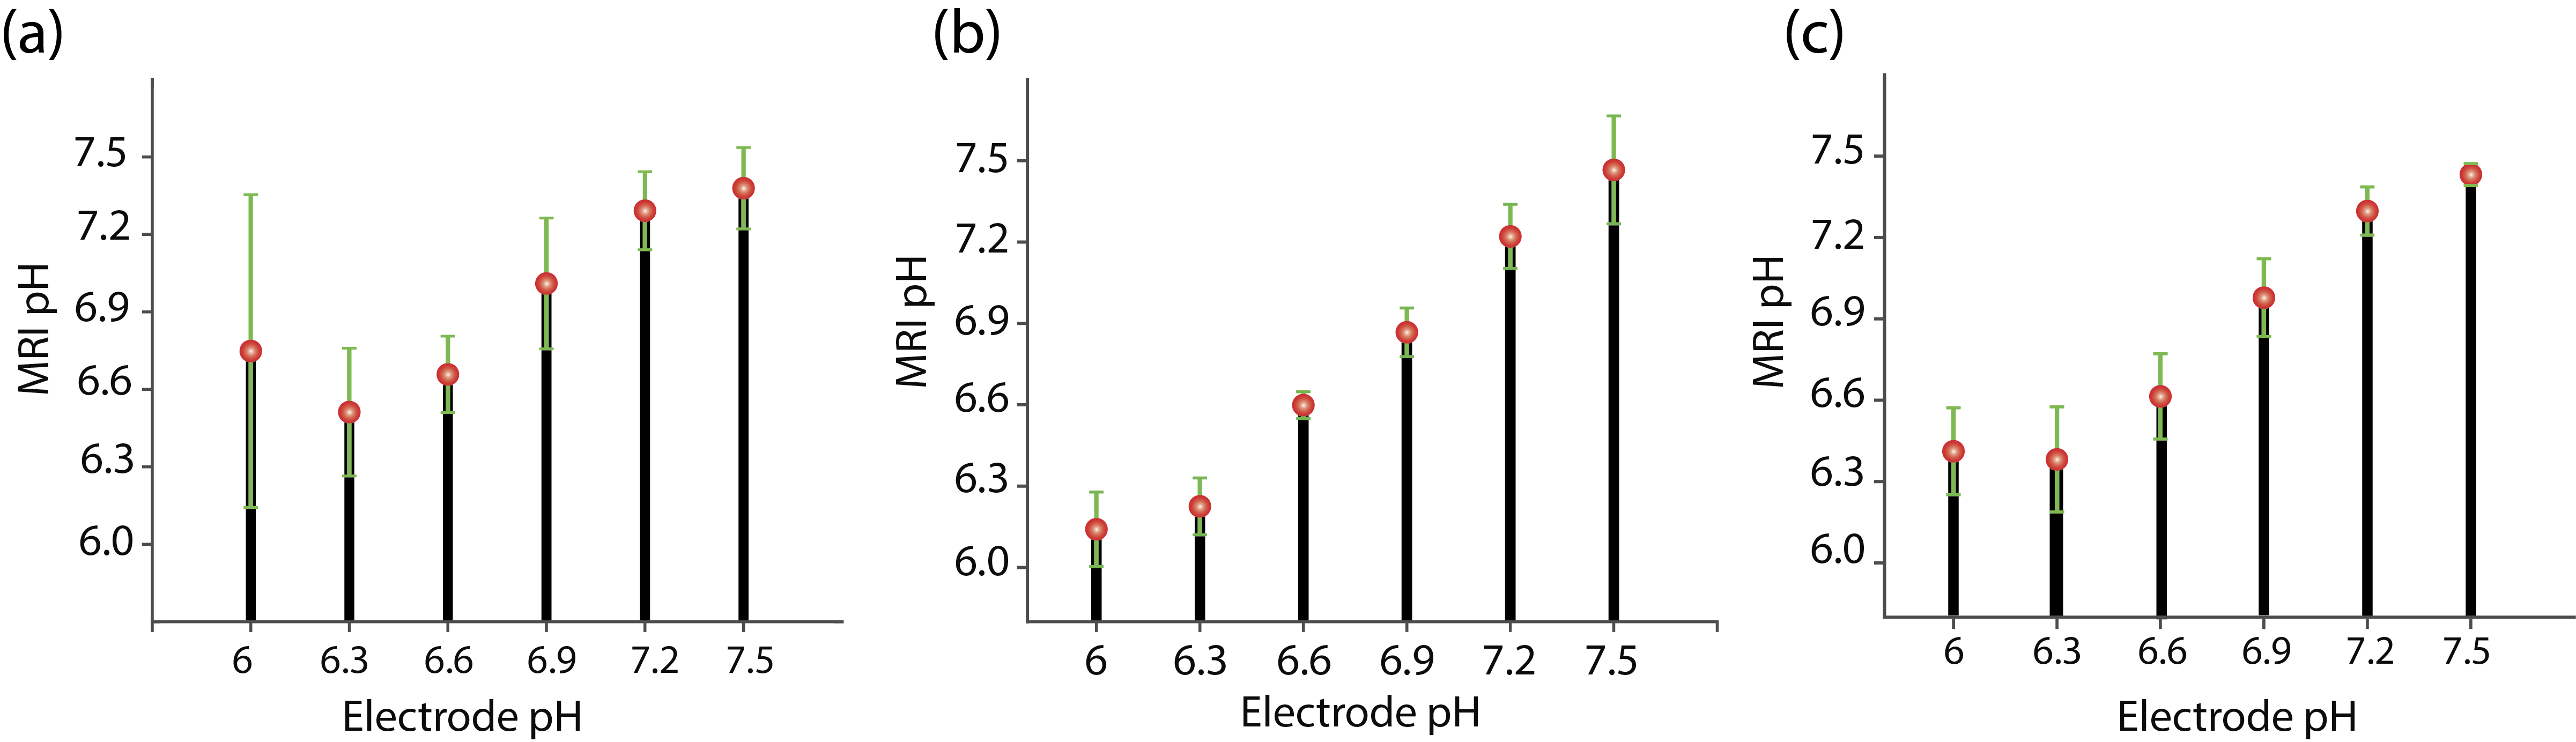
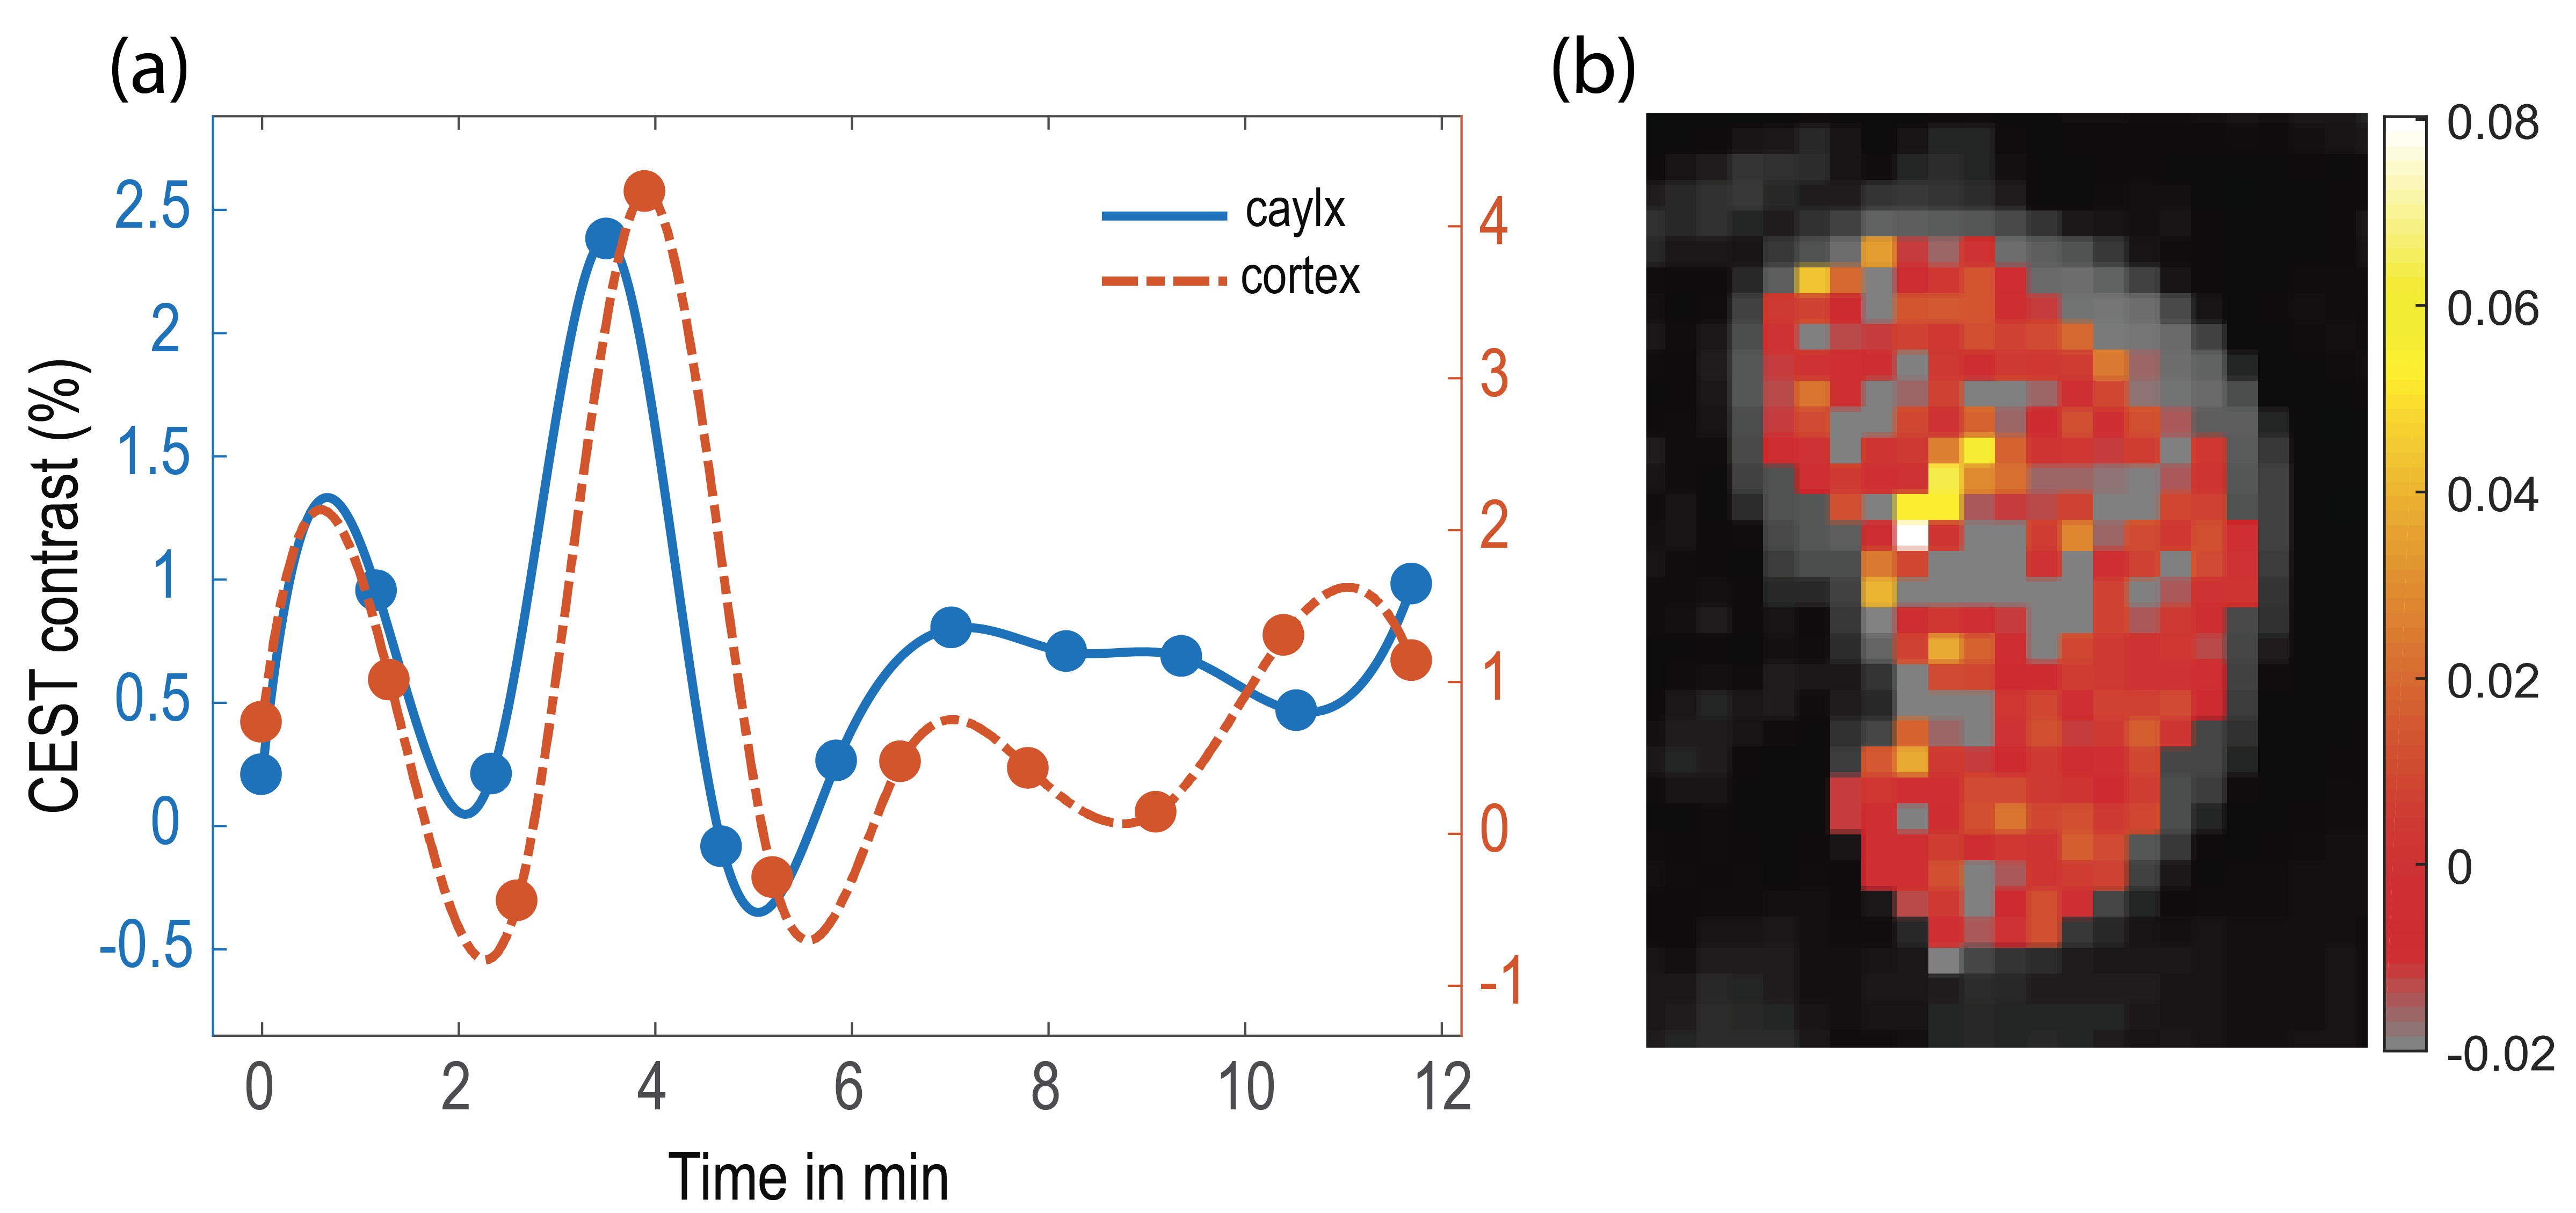
Pixel by pixel pH maps were generated using the peak width (Width method), MTRasym as a function of (omega plot4 method) or the ratio of MTRasym at two (ratiometric method1) to calculate pH values for 2,4-DHB (Fig. 1). The mean standard deviation in pH was calculated for each method and compared between methods along with image acquisition times. According to standard deviation, the width mapping method is not very accurate for detecting pH values below 6.9 (Fig. 2). The omega plot method, which requires a minimum of three values to measure the pH was found to be the most accurate, however it also takes the longest time to produce images (at least 30% more than the ratiometric method). The ratiometric method was found to be nearly as accurate as the omega plot method, with a significant advantage in acquisition time. Furthermore, of the agents, salicylic acid displayed the largest change in exchange rate as a function of pH. Based on this, In vivo experiments were performed. Dynamic MTRasym time course measurements (in %) for ROIs enclosing calyx and cortex display 4-5 % contrast 4 minutes after injection of salicylic acid (Fig. 3) with contrast spread throughout the cortex suggesting that this agent is well suited for renal pH mapping. In addition, we found that in order to obtain sufficiently long contrast persistence, slow infusion is required (on the order of 0.25 mL/min).Conclusion:
CEST MRI can be performed on aspirin analogs to acquire pH maps. The advantages of these agents include their large chemical shift from water allowing ready 3T detection, biocompatibility and biodegradability. Based on their uptake throughout the kidneys, renal pH maps can be readily generated.Acknowledgements
We would like to especially thank Dr. Yuguo Li for constant help performing tail vein injections. This project is funded by MD Stem Cell Research Fund # MSCRFI-2829.References
1. Longo Dario L et al. JACS 136, 14333 (2014)
2. Ward KM, Balaban RS MRM 44, 799 (2000)
3. Yang X et al. Angew. Chem. 52, 8116 (2013); Yang X et al. Chem. Eur. J. 20, 15824 (2014)
4. Dixon WT et al. MRM 63, 625 (2010)
Figures