0403
MR/ fluorescence dual-modality image-guided multifunctional albumin nanoassembies for sonodynamic therapy of glioma1Shenzhen Institutes of Advanced Technology, Chinese Academy of Sciences, Shenzhen, China, 2University of Chinese Academy of Sciences, Beijing, China, 3The First College of Clinical Medical Sciences,China Three Gorges Unversity, Yichang, China
Synopsis
Sonodynamic therapy (SDT) is a non-invasive and effective therapeutic modality for solid cancerous tumors. In this study, to improve the effectiveness of SDT, we fabricated a high-performance multifunctional albumin nanoassembies (HSA-Ce6-Mn NCs) having higher cell uptake efficiency and the tumor accumulation. It also exhibited an excellent ability of MR/ fluorescence (FL) dual-modality imaging so that glioma margin and HSA-Ce6-Mn NCs metabolism could be clearly visualized. The SDT has been demonstrated for suppressing the tumor growth in-vivo under a MRI-guided FUS system and it is highly expected to have a great potential in clinical translation.
Introduction
Sonodynamic therapy (SDT) is a non-invasive and effective therapeutic modality for solid cancerous tumors1. It utilizes ultrasound to activate a non-toxic chemical agent (called sonosensitizers) to generate reactive oxygen species (ROS) for suppressing cancer cells2. In this work, we developed manganese ion-chelated albumin-chlorin-e6 nanoassembies (HSA-Ce6-Mn NCs) for SDT of glioma. The ROS can be released locally from the HSA-Ce6-Mn NCs under ultrasound sonication and has a higher cell uptake than the free sonosensitizers of Ce6. The dual-modality of MR and fluorescence (FL) imaging ability was suitable to guide and monitor the delivery of HSA-Ce6-Mn NCs. The effectiveness of HSA-Ce6-Mn NCs was validated through BALB/c athymic nude mice bearing glioma models.Methods
Preparation and characterization of HSA-Ce6-Mn NCs
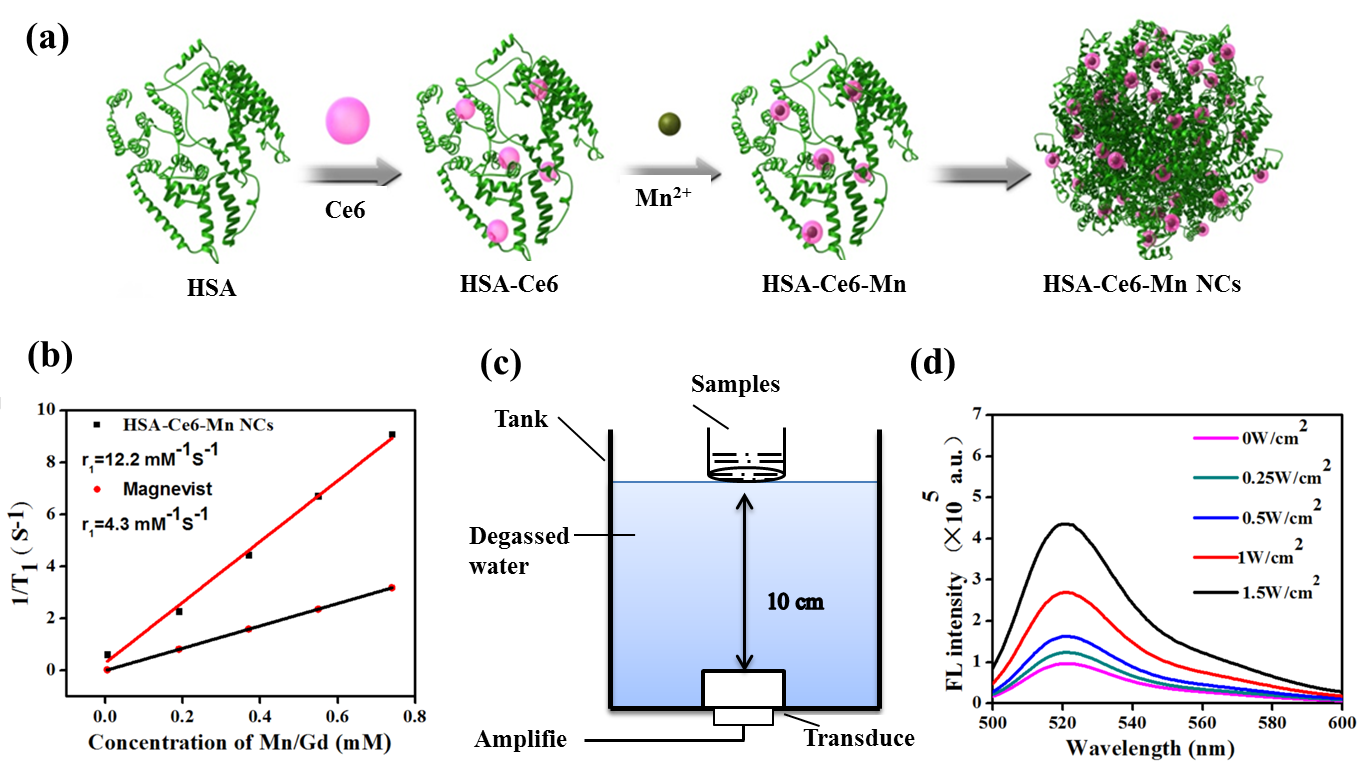
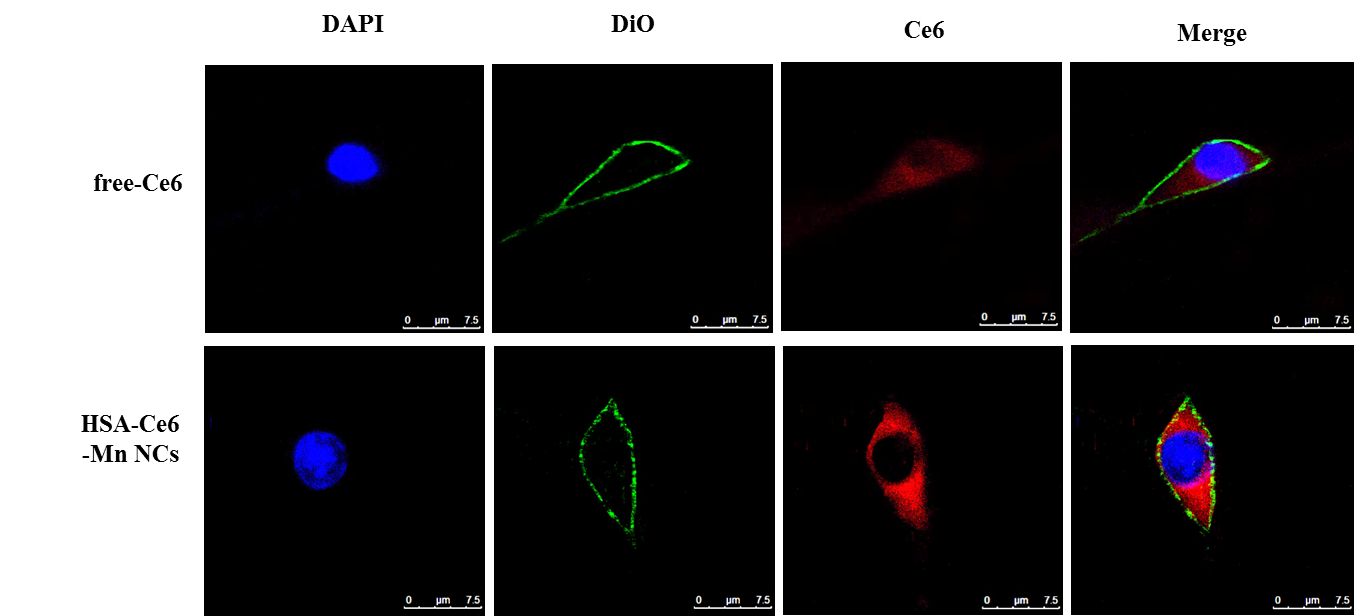
HSA-Ce6-Mn NCs were formulated using HSA dissolved in water and added Ce6 into the solution, then mixed with MnCl2. The relationship of the T1 relaxation rate and the concentration of HSA-Ce6-Mn NCs were investigated through the inversion recovery TSE sequence. The generation of ROS was determined using fluorescence spectrometer after samples mixed with DCFH-DA and sonicated by ultrasound with different intensities (0.5MHz, 0.25~1.5W/cm2, 50% duty cycle,1min). For cellular uptake, the U87 cells were incubated with samples and stained with DAPI and DiO, then observed by confocal microscope.
Animal model
Six-to-seven week old male BALB/c athymic nude mice were used for experiment. To develop the subcutaneous tumor models, U87MG cells were injected into the back of mouse. To develop the orthotopic glioma models, animals were immobilized in a stereotaxic apparatus, a burr hole was drilled into the skull and U87MG cells was injected into the right frontal lobe, then the incision was sewed up.
In-vivo dual-modality imaging
After injection HSA-Ce6-Mn NCs, animals were anesthetized. The FL images were acquired by IVIS Spectrum system using a 605 nm excitation and 635 nm filter. MR images were acquired on a 3.0 T clinical MR scanner (TIM TRIO, Siemens, Germany). T1-weighted TSE sequence was used with parameters: TR=700ms, TE=13ms, resolution was 0.3*0.3*2mm.
MR guided In-vivo treatment
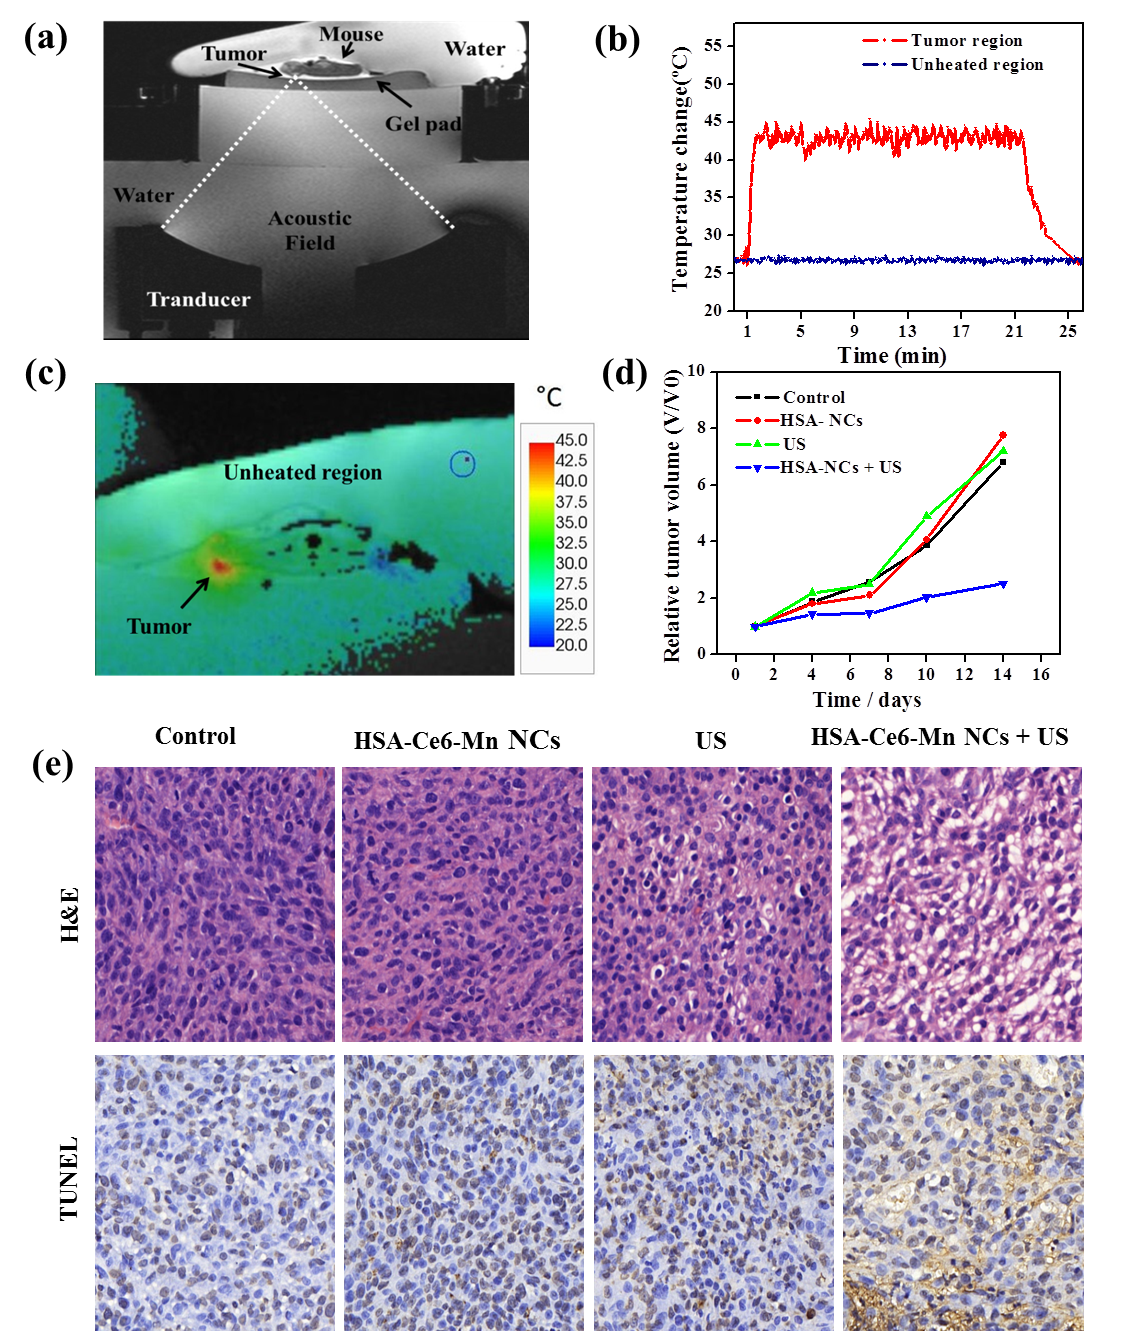
When the volume of tumors reached to 50-100mm3, the animals were selected for treatment. With the injection of HSA-Ce6-Mn NCs, the anesthetized animals were fixed in a customized MR compatible ultrasound platform. The position of the tumor was determined from the pre-scan T1w images. The ultrasound transducer was moved so that the ultrasound focus was inside the target. The tumor target was sonicated under FUS (f=0.8 MHz) to release the ROS in the local area. During the sonication, MR temperature imaging was used to monitor the temperature change with parameters: GRE sequence, TR=29ms, TE=10ms, resolution=0.6*0.6*3mm, with the acquisition time 4.6 second/measurement. A feedback temperature PID control algorithm was implemented to keep local temperature constant at 42℃ for 20min.
Results
The schematic process of HSA-Ce6-Mn NCs was described in Figure1a. The T1w MR images and longitudinal relaxivity (r1) of HSA-Ce6-Mn NCs compared to the clinical approved Magnevist are shown in Figure 1b. The experiment apparatus schematic of detection the ROS is showed in Figure 1c and the ROS intensity of HSA-Ce6-Mn NCs exhibited an intensity-dependent enhancement under ultrasound sonication (Figure1d).The cell uptake behavior of HSA-Ce6-Mn NCs was further evaluated through confocal microscopy shown in Figure 2.
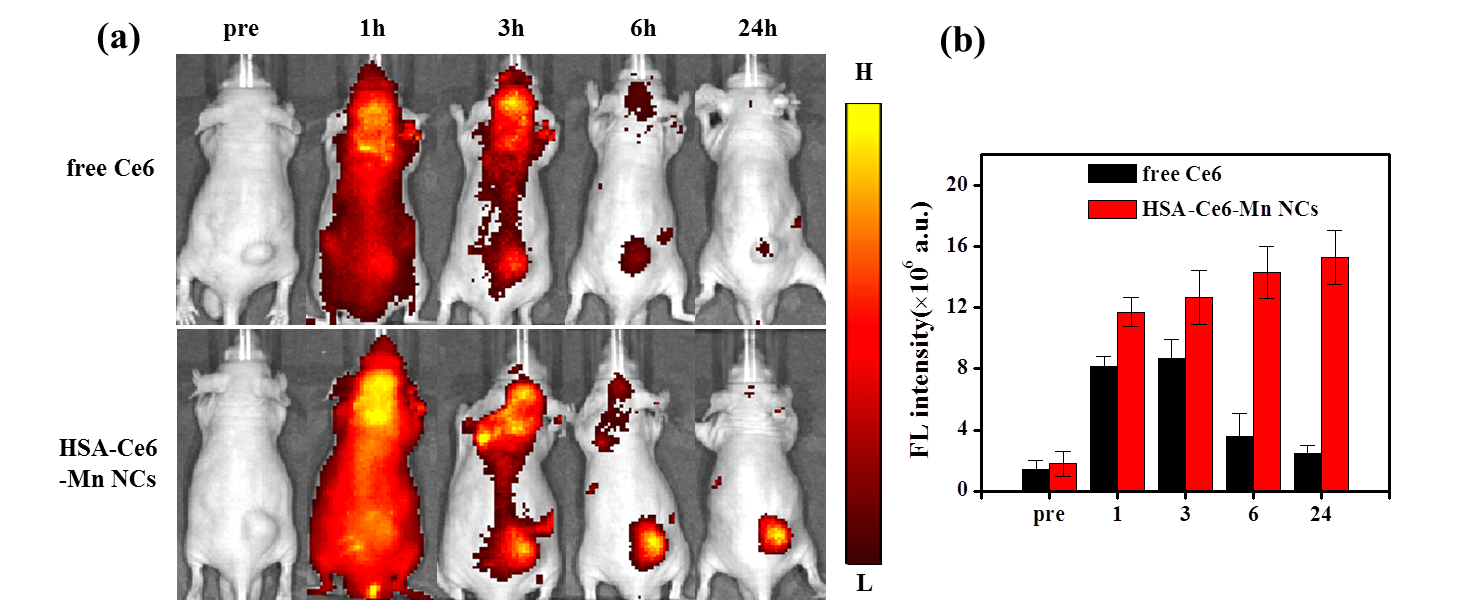
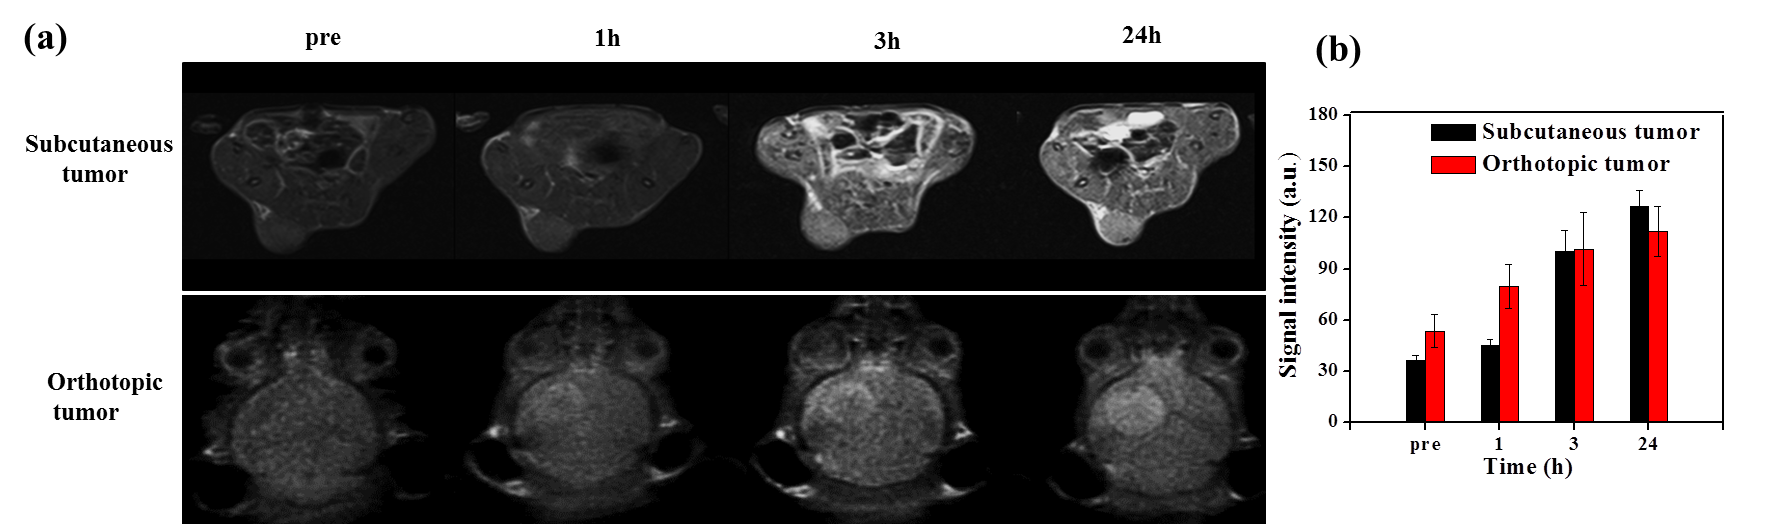
In-vivo FL imaging of glioma-bearing mice showed higher fluorescence intensity than free Ce6 (Figure 3a-b). In-vivo T1w MR images of mice were all showed signal enhancement in tumor area with the increase of time post injection of HSA-Ce6-Mn NCs up to 24h (Figure 4a-b).
For in-vivo treatment, the MR guided ultrasound platform configuration is illustrated in Figure 5a, the target temperature of US focal spot was set to 42℃and maintained about 20 minutes successfully under the temperature control algorithm (Figure 5b-c). The tumor growth showed significantly suppressed in the HSA-Ce6-Mn NCs combined US group compared to the other three groups (Figure 5d), the H&E and TUNEL stained section of this group showed the cells have suffered necrosis and apoptosis(Figure 5e).
Discussion and conlustions
We have successfully developed a manganese ion-chelated albumin-chlorin-e6 nanoassembies for MRI-guided SDT of glioma. The HSA-Ce6-Mn NCs improved the sonosensitizers of ce6 cell uptake efficiency and could generate ROS under ultrasound sonication. It also exhibited an excellent ability of MR/ FL dual-modality imaging. The SDT has been demonstrated for suppressing the tumor growth in-vivo. The dual-modality guidance of SDT shows several unique advantages: T1w MR images can be used for tumor localization, while FL images is used for tracking and visualizing the sonosensitizer metabolism. Finally, MR temperature imaging during SDT can be used for temperature monitoring to ensure the safety and effectiveness for the treatment.Acknowledgements
This study was supported by the Natural Science Foundation of China; Grant number 81327801, the Key Laboratory for Magnetic Resonance and Multimodality Imaging of Guangdong Province; Grant number 2014B030301013.References
1. Huang, P., et al., Metalloporphyrin-Encapsulated Biodegradable Nanosystems for Highly Efficient Magnetic Resonance Imaging-Guided Sonodynamic Cancer Therapy. J Am Chem Soc, 2017. 139(3): p. 1275-1284.
2. Deepagan, V.G., et al., Long-Circulating Au-TiO2 Nanocomposite as a Sonosensitizer for ROS-Mediated Eradication of Cancer. Nano Lett, 2016.
Figures