0398
Intracellular MEMRI signals reflect the frequency of action potentials in Aplysia neurons1NeuroSpin/CEA, Gif-sur-Yvette, France, 2University of Bordeaux, Bordeaux, France
Synopsis
We show a positive correlation between electrical activity and MEMRI signal intensity in identified neurons in Aplysia buccal ganglia and demonstrate that the MEMRI signal reflects mainly fast and high membrane depolarization processes such as action potentials, and it is not sensitive to slow and small membrane depolarization, such as post-synaptic potentials.
Introduction
Manganese-enhanced magnetic resonance imaging (MEMRI) is an increasingly popular alternative to standard functional MRI methods in preclinical settings. The contrast in MEMRI images is based on the accumulation of Mn2+ ions inside neurons, and, since manganese can serve as calcium analogue, this accumulation reflects calcium dynamics providing versatile information about brain neuroarchitecture and functionality1. However, despite its use as a functional imaging tool, the exact relationship between the MEMRI signal and the activity in individual neurons remains elusive.Methods
In order to better understand the mechanisms underlying Mn2+ accumulation resulting in MEMRI signal enhancement we investigated single neuron responses of isolated Aplysia buccal ganglia subjected to chemical (DA) or electrical stimulation (ES) of an input nerve (oesophageal nerve). The elicited electrical activity was recorded with electrophysiological methods and the Mn2+ uptake in individual neurons was evaluated with MEMRI at 17.2T.
Electrophysiology: Simultaneous extracellular recordings of the buccal motor patterns (BMPs) and intracellular recordings from identified motor neurons (B3, B4/5, B6, B15 and B61) were made during 45 minutes of artificial sea water (ASW) perfusion, DA perfusion or nerve stimulation using connective tissue-desheathed buccal ganglia. Three parameters characterizing intracellular electrical activity were analyzed in the identified neurons: the frequency of the bursts of action potentials, the frequency of the action potentials (APs), and the total area of the slow depolarization of the membrane potential resulting from the synaptic activity. For each condition, the perfusate solution contained 1 mM MnCl2.
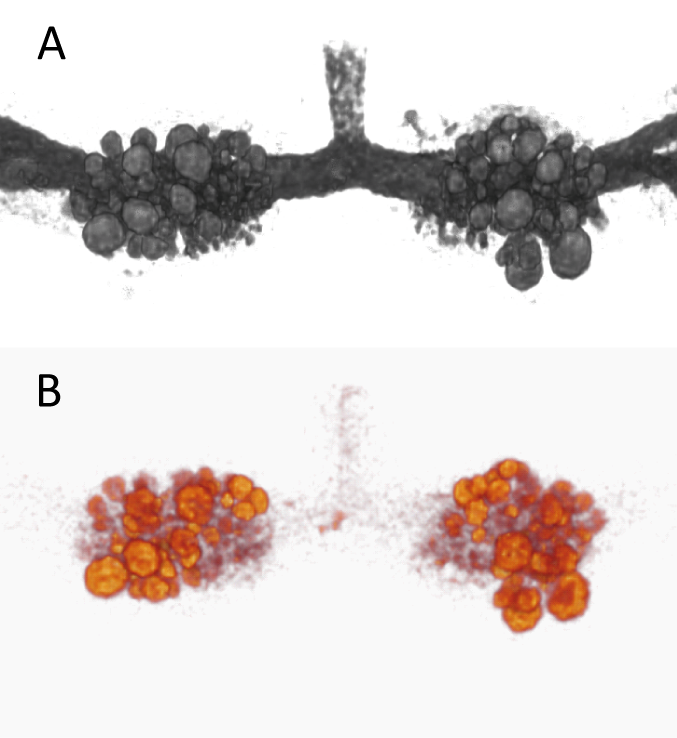
Manganese enhanced MRI: The preparation procedure for the MEMRI study was the same as for electrophysology. After the 45 min perfusion period the buccal ganglia were inserted into 2.0 mm ID borosilicate glass capillaries containing ASW and then slid inside a solenoidal transceiver coil tuned at 730 MHz2. Two different types of acquisitions were performed on each sample: a 3D T1 weighted FLASH (TR = 150 ms, TE = 2.44 ms) and a 3D T2 weighted RARE (TR = 3 s, TE = 20 ms, acceleration factor = 4). The spatial resolution was 25 μm isotropic for both images. Using the T1 weighted acquisitions we calculated the MEMRI signal intensity with respect to the ASW signal in manually drawn ROIs corresponding to single neurons (as in reference 2). 3D renderings of typical T1 and T2 weighted images are shown in Fig. 1. For each ganglia, a total of 23 motor neurons were identified on the MRI images.
Results and discussion
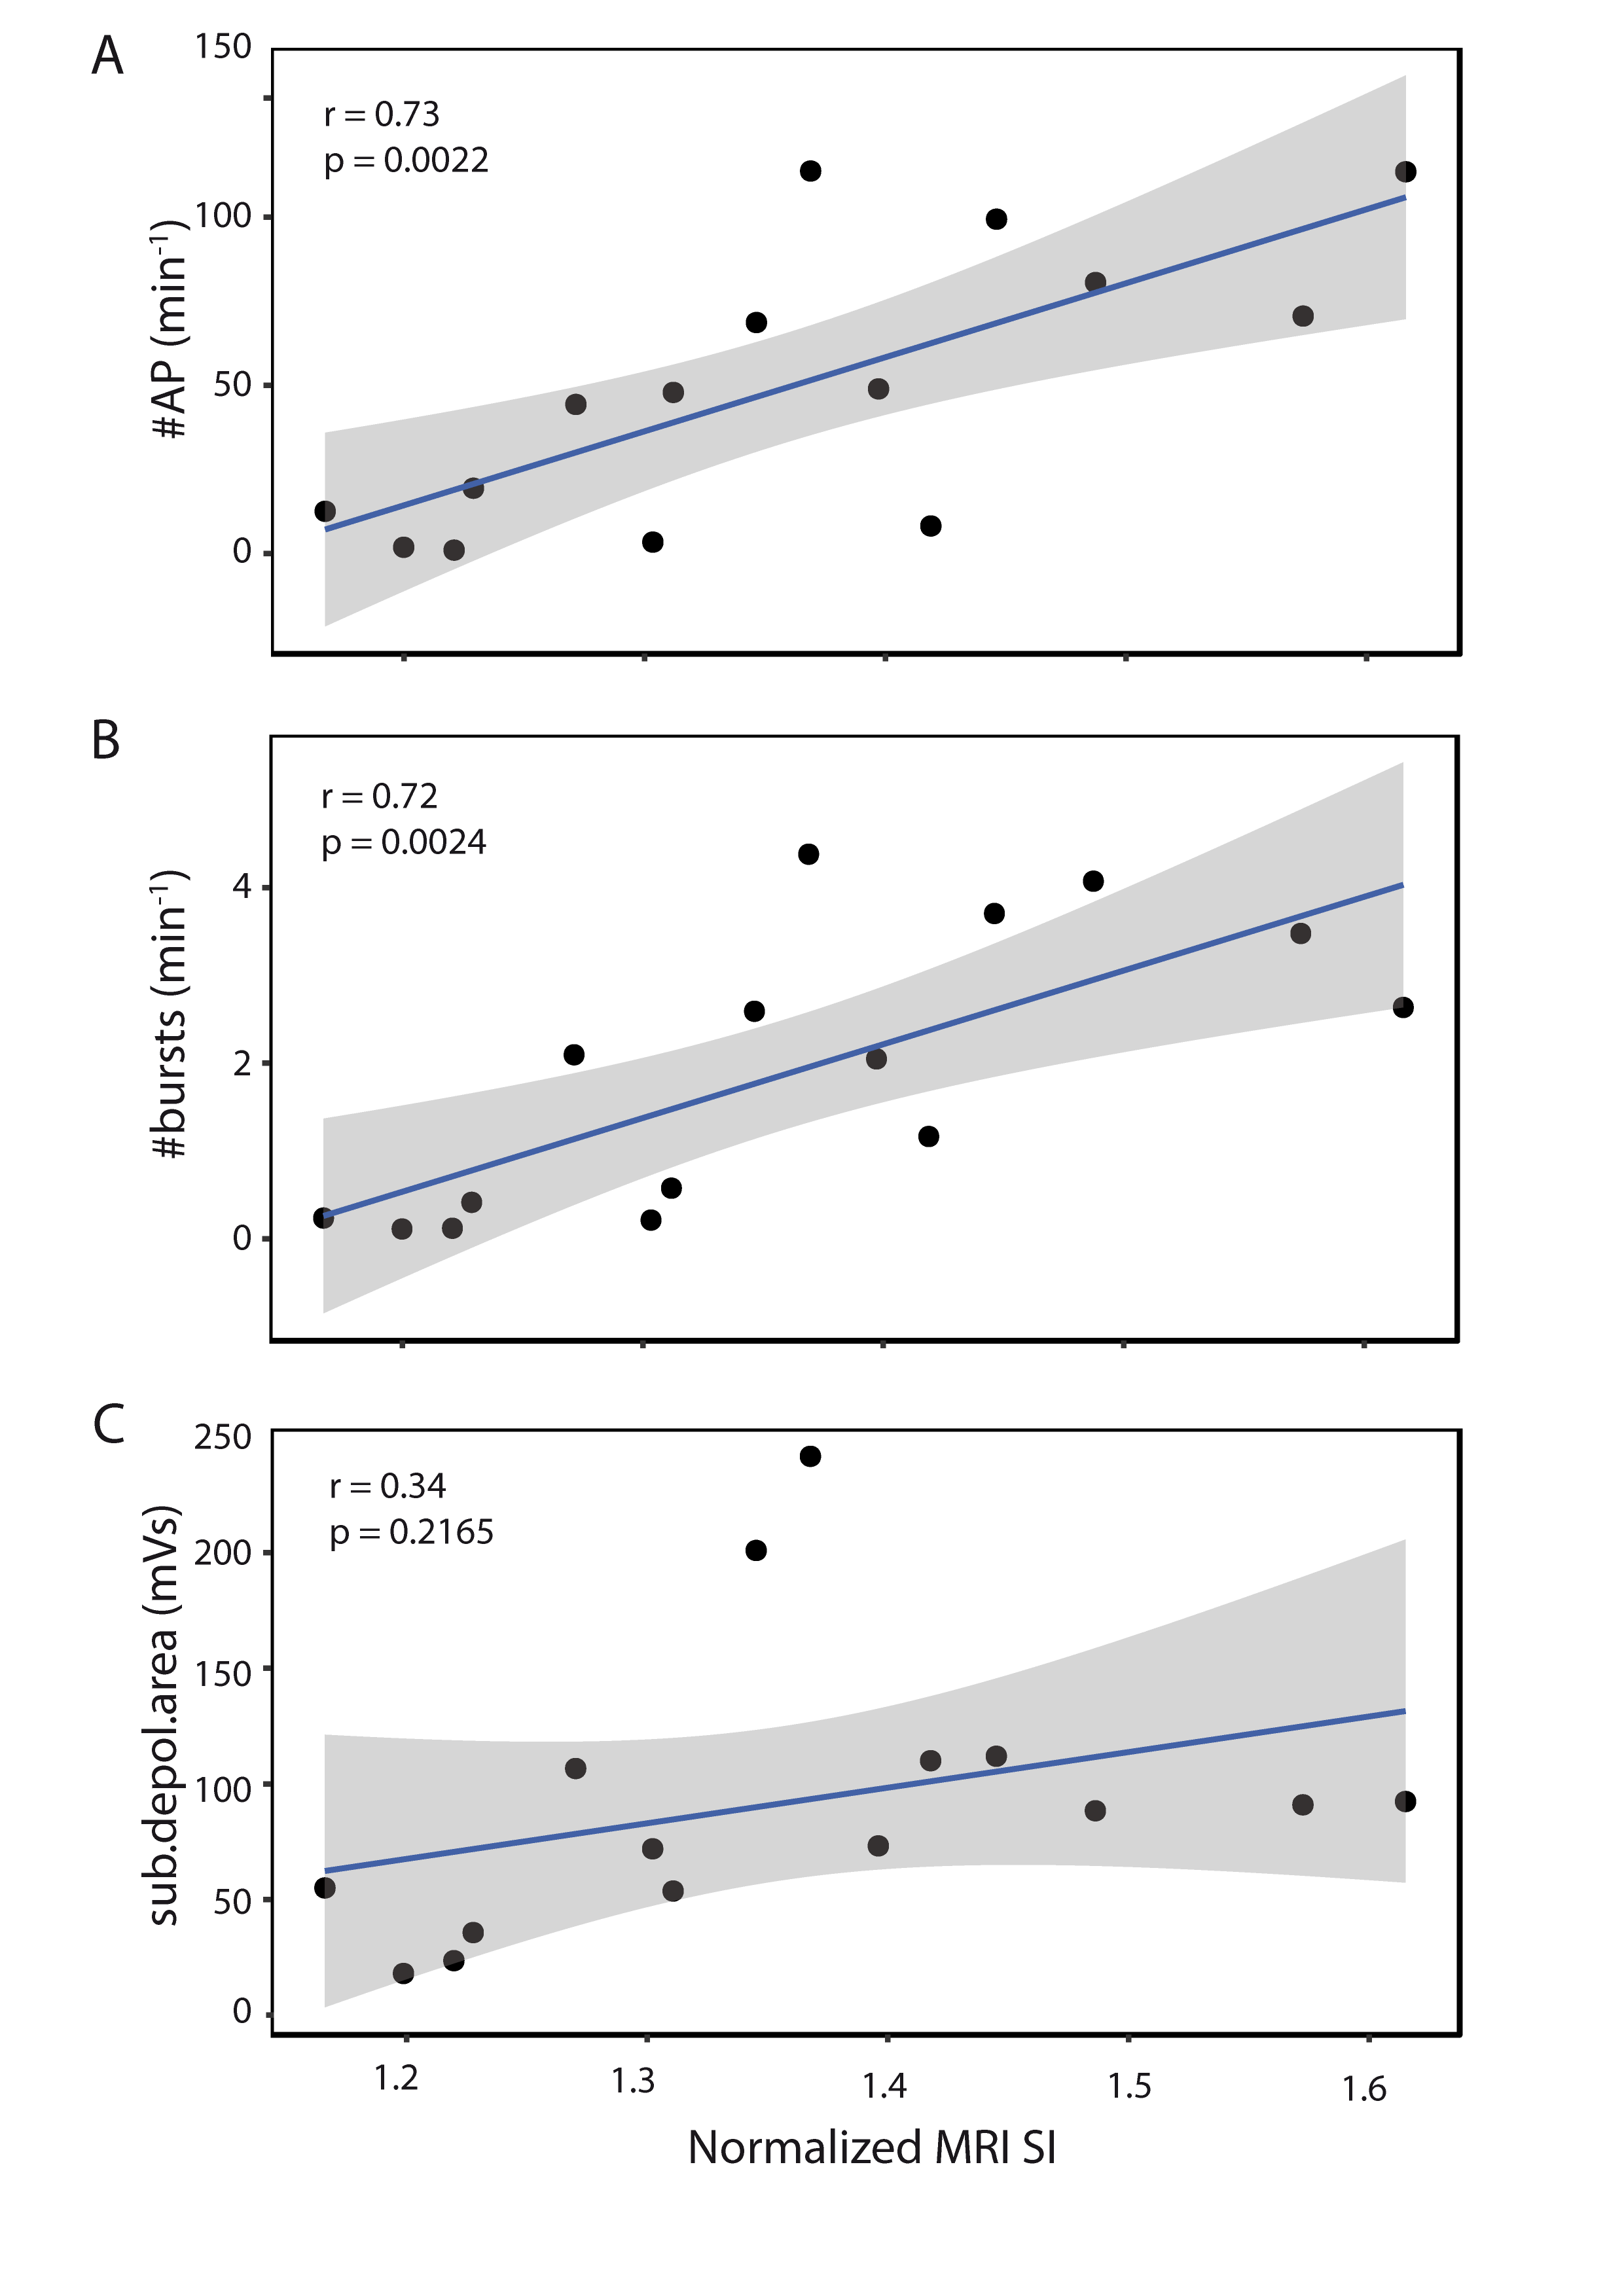
In the absence of any stimulation, the rhythmic BMPs are spontaneously generated at a low mean frequency (0.35±0.05 BMP.min-1). Dopamine application or electrical stimulation produced a strong increase in this frequency, with a higher effect for DA than ES (mean frequency ± sem: 3.54±0.35 and 2.58±0.25 BMP.min-1, respectively). Similar changes in the MEMRI signal intensity of the buccal ganglia were measured on T1 weighted images. The average normalized signal intensity over all identified motor neurons in the ganglia was 1.230, 1.416 and 1.400 for CT, DA and ES, respectively. From the total of 23 motor neurons analysed, 18 neurons had significantly higher signal intensity under dopamine stimulation and 17 neurons showed significant increase in signal intensity when the nerve was stimulated as compared to control. When comparing intracellular recordings with the MRI data we found, as presented in the scatter plots in Fig. 2, that the MEMRI signal intensity correlates significantly with the frequency of APs (Fig. 2A, r=0.73, p ≤ 0.01) and the frequency of bursts of APs (Fig. 2B, r=0.72, p ≤ 0.01). This result is not surprising because an increase in the APs occurrences implies an increased influx of Ca2+, and therefore of Mn2+ ions. No correlation was found between the MEMRI signal intensity and the area of the slow depolarization of the membrane potential (Fig. 2C), suggesting that the BMPs-related post-synaptic depolarization is not strong enough to lead to detectable Mn2+ influx in the cell bodies.Conclusion
We confirm that Mn2+ is indeed a marker of action potentials in MEMRI functional imaging. We show that neuronal activity (action potentials and bursts of action potentials) is positively correlated with the MEMRI signal in single and identified neurons in Aplysia buccal ganglia. While ongoing synaptic activity can also lead to Mn2+ influx, a correlation with the MEMRI signal intensity could not be detected in this study. This work brings an important insight into the biological mechanisms of manganese accumulation and further validates the use of MEMRI for brain functional imaging studies.Acknowledgements
This work was funded by grant ANR-13-BSV5-0014-01 (project ANImE) and by the IRTELIS PhD program.References
1. Silva, A.C., and Bock, N.A. Manganese-enhanced MRI: an exceptional tool in translational neuroimaging. Schizophr. Bull. 2008; 34, 595–604.
2. Radecki, G., Nargeot, R., Jelescu, I.O., Le Bihan, D., Ciobanu, L. Functional magnetic resonance microscopy at single-cell resolution in Aplysia californica. Proc. Natl. Acad. Sci. U. S. A. 2014; 111, 8667–8672.
Figures