0397
Hypercapnic and hyperoxic laminar calibrated BOLD: are conventional models adequate?1Max Planck Institute for Human Cognitive and Brain Sciences, Leipzig, Germany
Synopsis
Several sub-millimetre-resolution fMRI acquisitions have been developed in recent years, however none taken singularly directly reflects neural activity. We use a calibrated BOLD approach combining BOLD and VASO measurements with respiratory manipulations (CO2 and O2) and a motor task to estimate cortical profiles of changes in O2 metabolism, a parameter more tightly related to neuronal function. Calculated hypercapnic calibration parameters are consistent with previous findings, while physiologically implausible estimates of O2 metabolism changes are found with hyperoxic calibration. A possible reason for this is reported, which questions the validity of conventional models for hyperoxic calibration at this resolution.
Introduction
Sub-millimetre-resolution fMRI acquisitions have been developed in recent years at 7T 1,2, resolving the cortical profile of the signal, thus potentially allowing in-vivo insights into the link between layered structure and function of the human cortex. However no single fMRI signal directly reflects neural activity, due to its complex dependency on physiology 3. A calibrated BOLD approach combining BOLD and VASO measurements with a hypercapnic (CO2) respiratory challenge has recently aimed at disentangling this dependency 4, estimating cortical profiles of changes in cerebral metabolic rate of O2 consumption (δCMRO2): a parameter more tightly related to neuronal function 5. The main caveat of calibrated approaches relates to the validity of the hypotheses underlying the physiological models in use 6,7, originally formulated for a much lower spatial resolution.Aim and Novelty
We investigate the feasibility of hyperoxic (O2) calibration for assessing the cortical profile of δCMRO2 in a motor task, comparing it to the results of hypercapnic calibration. We aim at exploring the limits of conventional calibrated BOLD at sub-millimetre resolution, highlighting possible issues.Methods
Experiment: 6 healthy participants (25±3 years) took part in an experiment with a dual gas-manipulation and finger tapping at 7T. Interleaved VASO and BOLD acquisitions were measured with a 3D-EPI-VASO sequence 2 with TI/TR/TE = 1100/3300/26 ms; 10 slices of 0.8×0.8×1.5 mm³; total duration 15min 24s. A motor task of 33s off-on right hand finger tapping was performed for the entire duration of the acquisition. An interleaved hypercapnic (5% CO2-balanced, 3min) and hyperoxic (100% O2, 4min) gas manipulation was performed through a non-rebreathing mouth piece (room air for the remaining 2+3+3.4 min; see Fig. 1, top). Analysis: Hand-knob (hKnob) regions of interest (ROI) were manually defined on a single slice in the primary motor cortex based on maps of FEAT-detected (8) VASO activations overlaid on tSNR maps (for anatomical contrast). 7 laminar profiles were then grown within the ROI in an equi-distant fashion. Time averaged BOLD and VASO signal changes where calculated for baseline and experimental conditions and then calibrated parameters M and δCMRO2 were estimated using: i) the Davis model, for CO2 calibration 6; ii) the Chiarelli model, for O2 calibration 7 (both models adapted as described in 4; see Fig. 1, bottom for details). Both analyses were carried out at ROI and laminar level.Results
The motor task at room air triggered a 4±0.7% (mean±sd) BOLD signal and -2±0.5% VASO signal change in the hKnob across the subjects (see Figs. 2 and 3).
The CO2 manipulation elicited a 10±2 mmHg increase in end-tidal CO2, 4.7±1.4% BOLD signal and -1.9±0.9% VASO signal change in the hKnob (see Fig. 2), with a laminar profile similar to that found for the motor task (see Fig. 3).
The O2 manipulation elicited a 555±40 mmHg increase in end-tidal O2, 1.9±1.2% BOLD signal and -0.4±0.6% (ns) VASO signal change in the hKnob, with a significantly lower laminar response compared to the other conditions (see Figs. 2 and 3).
Estimated calibrated BOLD parameters are shown in Fig. 4B: for CO2 calibration the ROI analysis reports MHC = 10.8±1.6% and δCMRO2,HC = 18.1±7.8%; for the O2 calibration instead, MHO = 6.5±4.1%, δCMRO2,HO = -74±101% (δCMRO2,HO > 0% for 2 subjects and < -100% for 2 subjects). Laminar profiles are shown in Fig. 4B: in all cases estimates seem inflated at the interface between grey matter and pial surface, likely due to influence of the cerebrospinal fluid (CSF) compartment. A relative MHC peak is found in deeper layers while δCMRO2,HC has a more uniform profile. Estimated MHO values are typically much lower than MHC ones and physiologically meaningful values of δCMRO2,HO are only estimated for two subjects. Notably, the spatial pattern of BOLD activation is more localised towards the sulci during hyperoxia, with signal from CSF more reactive to O2 changes (Fig. 5).
Discussion and Conclusions
Results from the CO2 calibration are consistent with findings from an analogous previous study 4. However, the preliminary results suggest that current models for O2 calibration supply physiologically implausible estimates of δCMRO2. While the accuracy of the results is likely to be hampered by the small cohort and limited SNR, evidence of spatial mismatch of the BOLD responses might question the validity of hypotheses underlying the physiological model used for hyperoxic calibration at this spatial resolution, in particular that vascular compartments are distributed homogeneously in every voxel. Future research will involve experimental and theoretical work aimed at matching O2 and CO2 calibrations and possibly combining them for a more reliable estimate of δCMRO2 at very high spatial resolution.Acknowledgements
The study was funded by the ERC under the EU Seventh Framework Programme (FP7/2007-2013, grant n° 616905).References
1 - Huber et al., NeuroImage, 2015; 2 - Huber et al., NeuroImage, 2016; 3 - Exstrom et al., Brain Res. Rev., 2010; 4 - Guidi et al., NeuroImage, 2016; 5 - Lin et al., PNAS, 2010; 6 - Davis et al., PNAS, 2016; 7 - Chiarelli et al., NeuroImage, 2016; 8 - Jenkinson et al., NeuroImage, 2012.
Figures
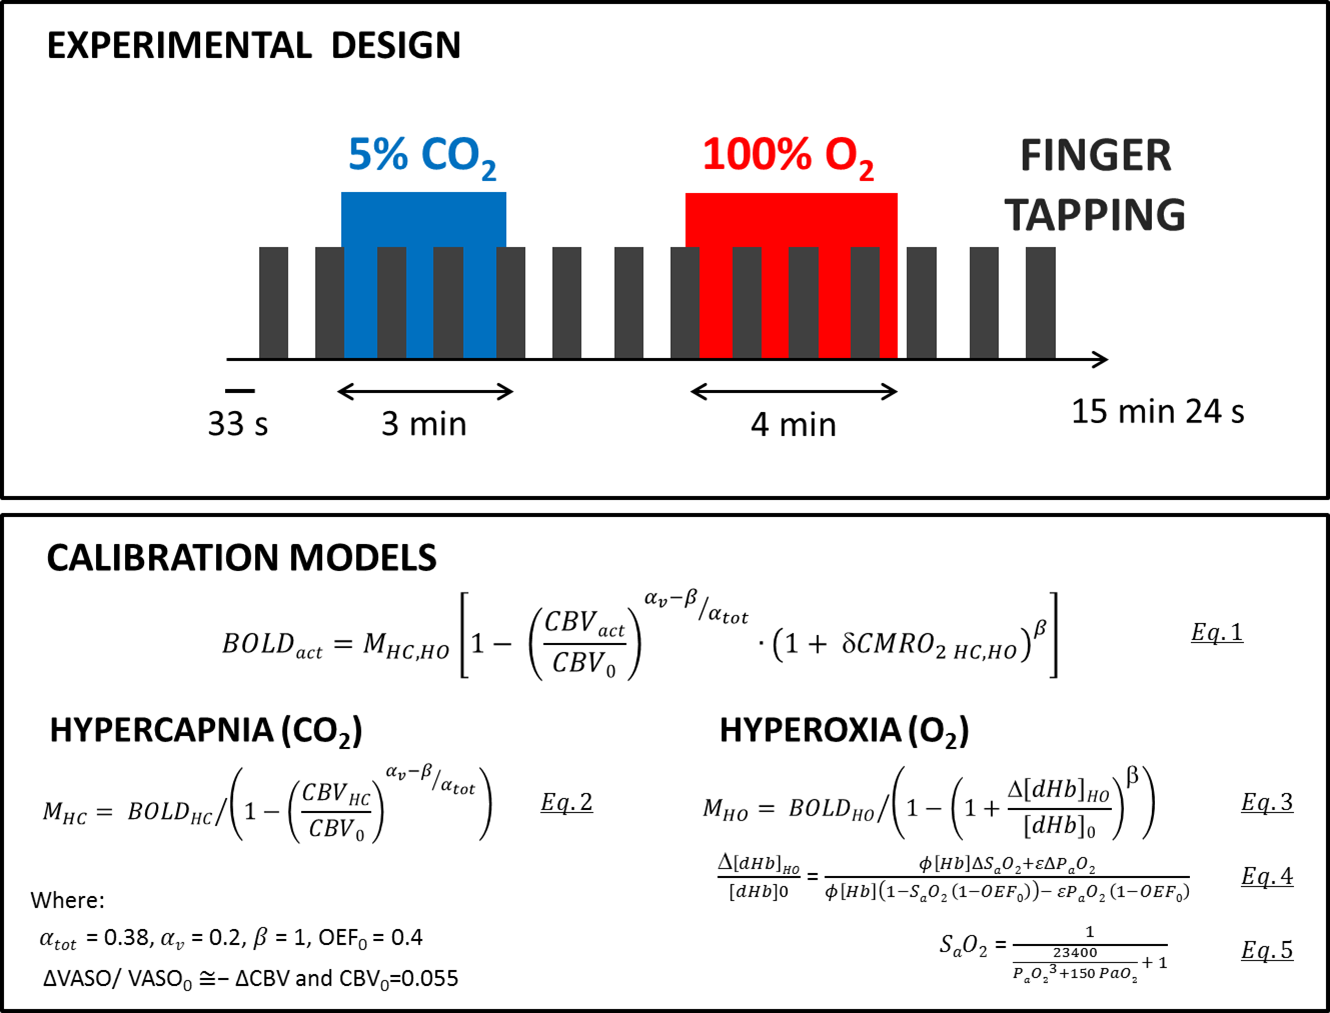
Fig. 1 - Experimental design and models used.
Values of MHC,HO were calculated from Eqs. 2,3. BOLD and VASO signals due to the motor task were measured, estimates of CMRO2 HC,HO were obtained inverting Eq. 1. Eqs. 4 and 5 describe the O2 transport and metabolism.
Notation: CBV = cerebrovascular volume, (d)Hb = (deoxy)haemoglobin, PaO2= arterial O2 pressure, SaO2= arterial O2 saturation, φ = O2-carrying capacity of Hb, ε = solubility of O2 in plasma. HC, HO, act subscripts denote quantities specifically related to hypercapnic, hyperoxic or motor task activation respectively, while 0 denotes baseline condition.
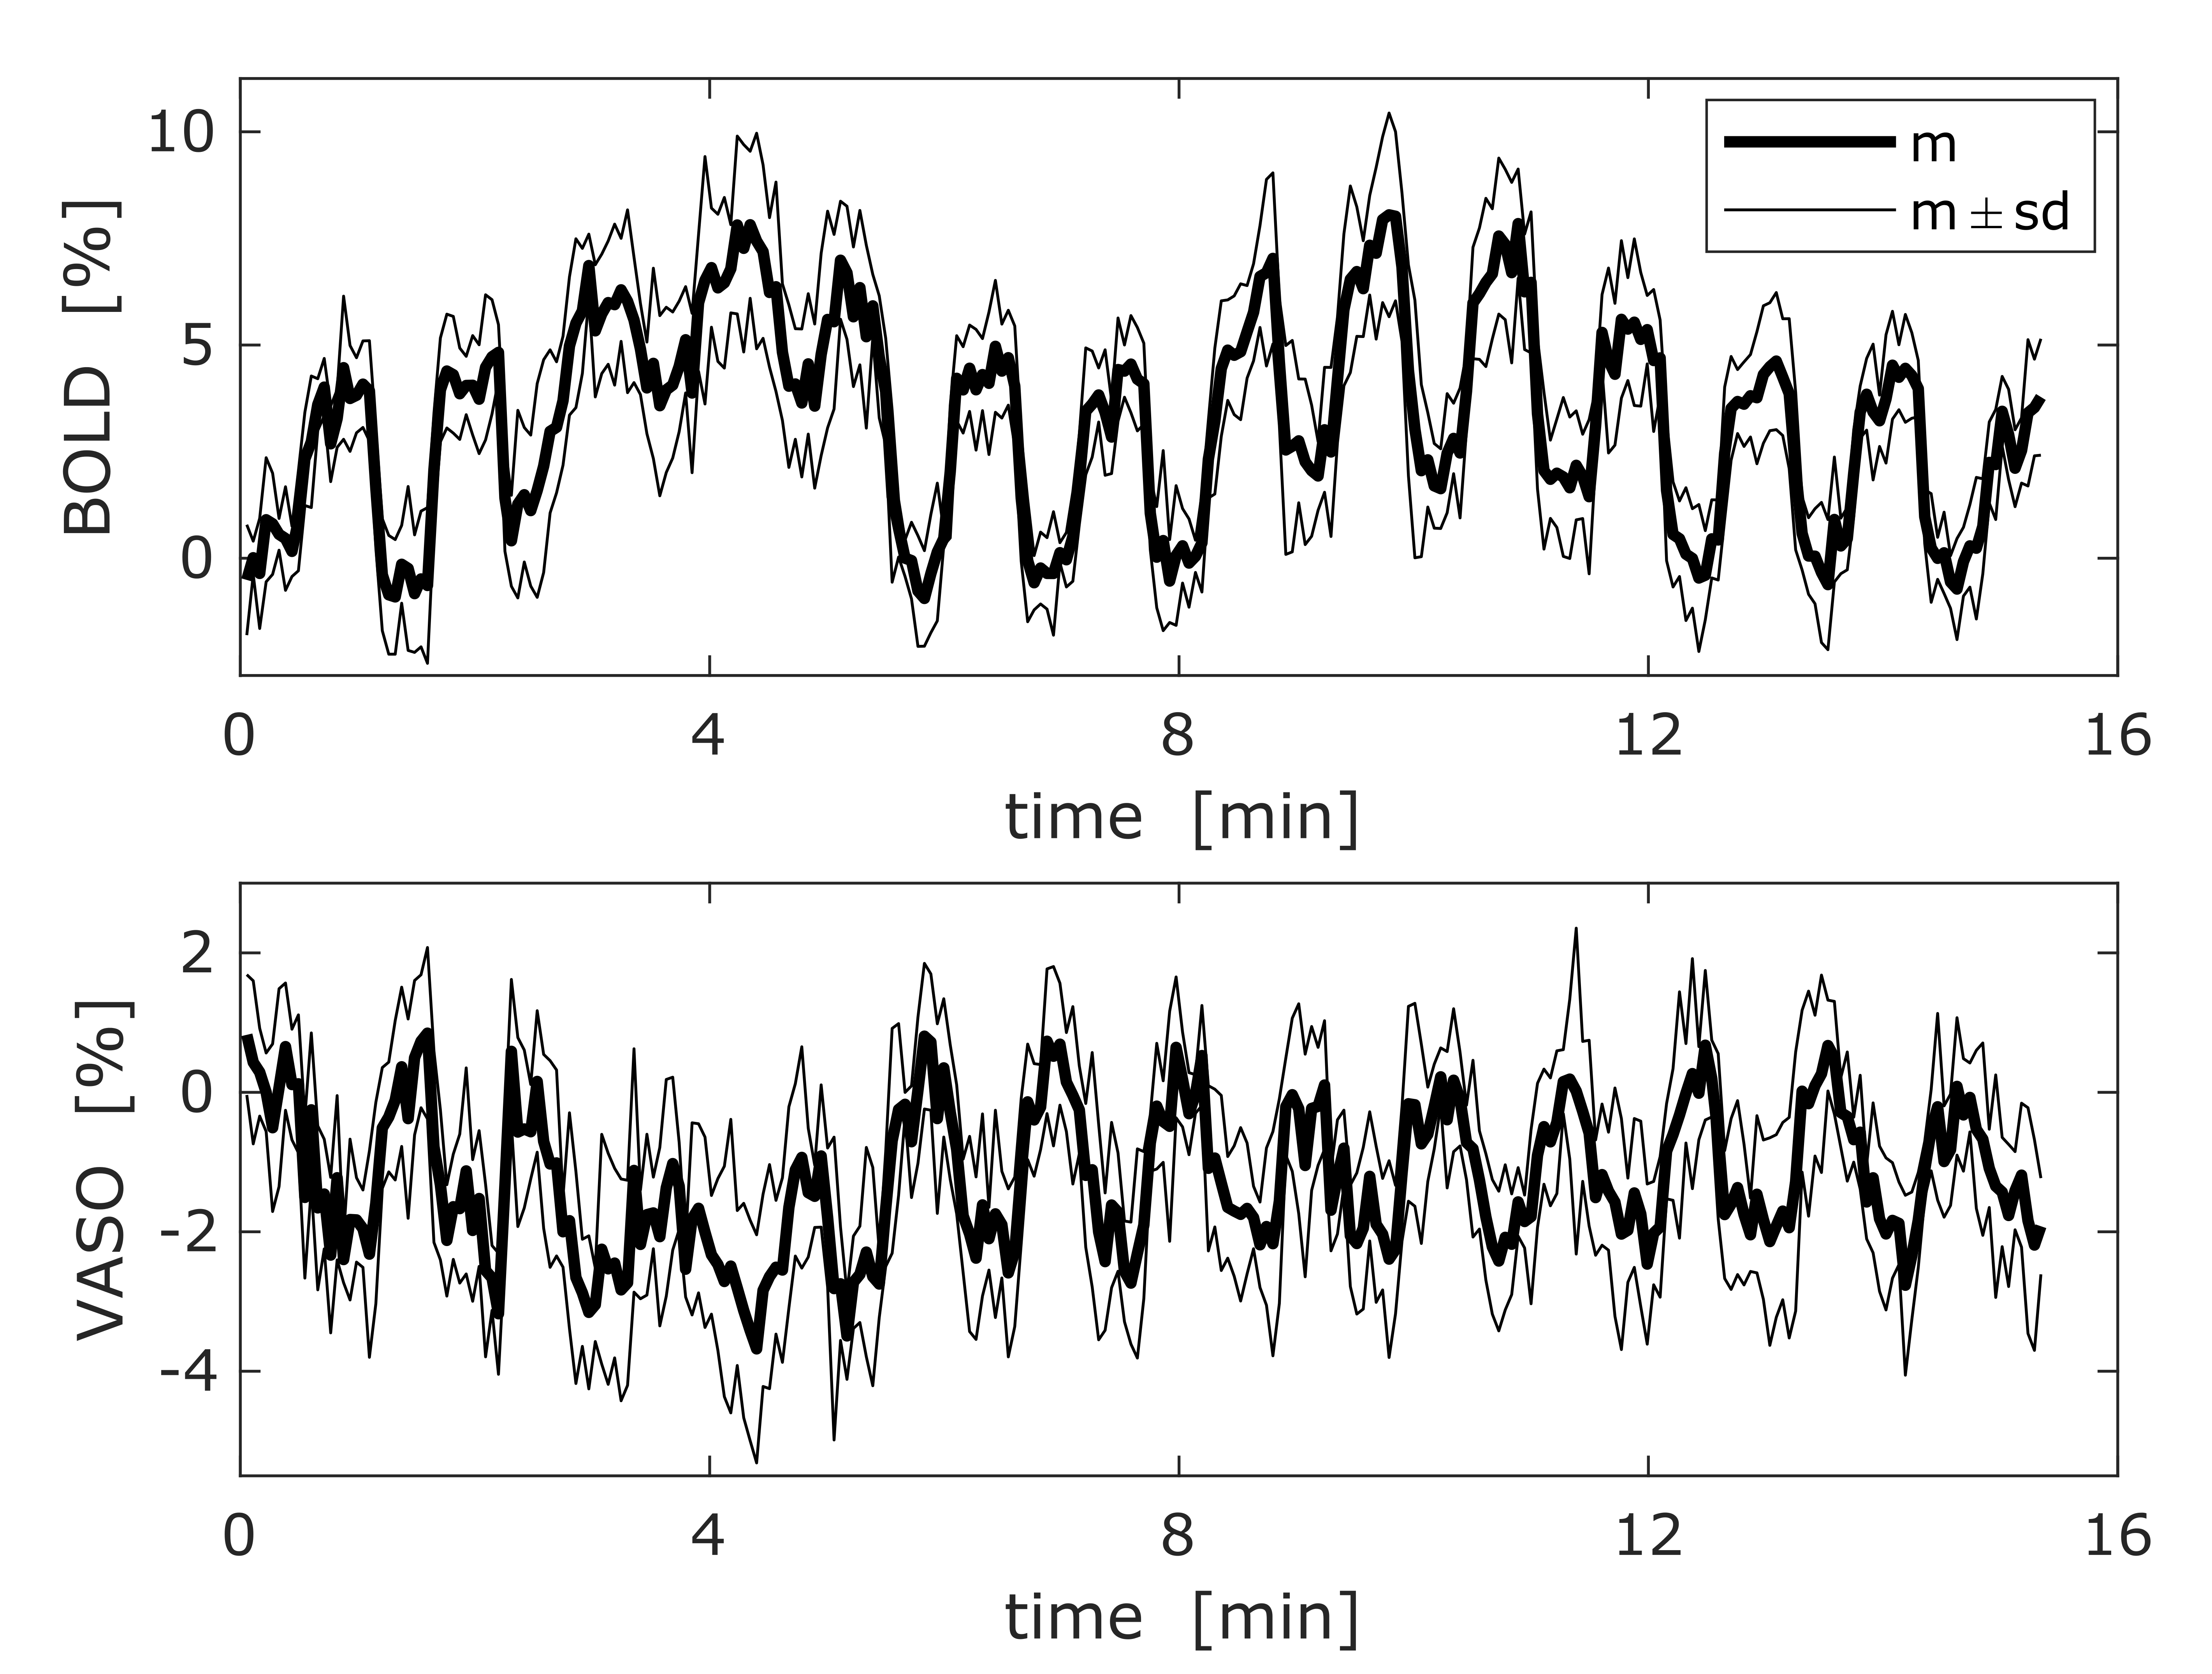
Fig. 2 - Signals time courses.
hKnob BOLD (top) and VASO (bottom) time courses averaged across subjects (mean [m] ± sd). Changes induced by all manipulations were clearly visible for the BOLD signal, while lower SNR made it more difficult to identify them in the VASO signal. Note that increases in CBV corresponded to decreases in VASO signal because ∆VASO/VASO0 ≅−∆CBV (see Fig. 1).
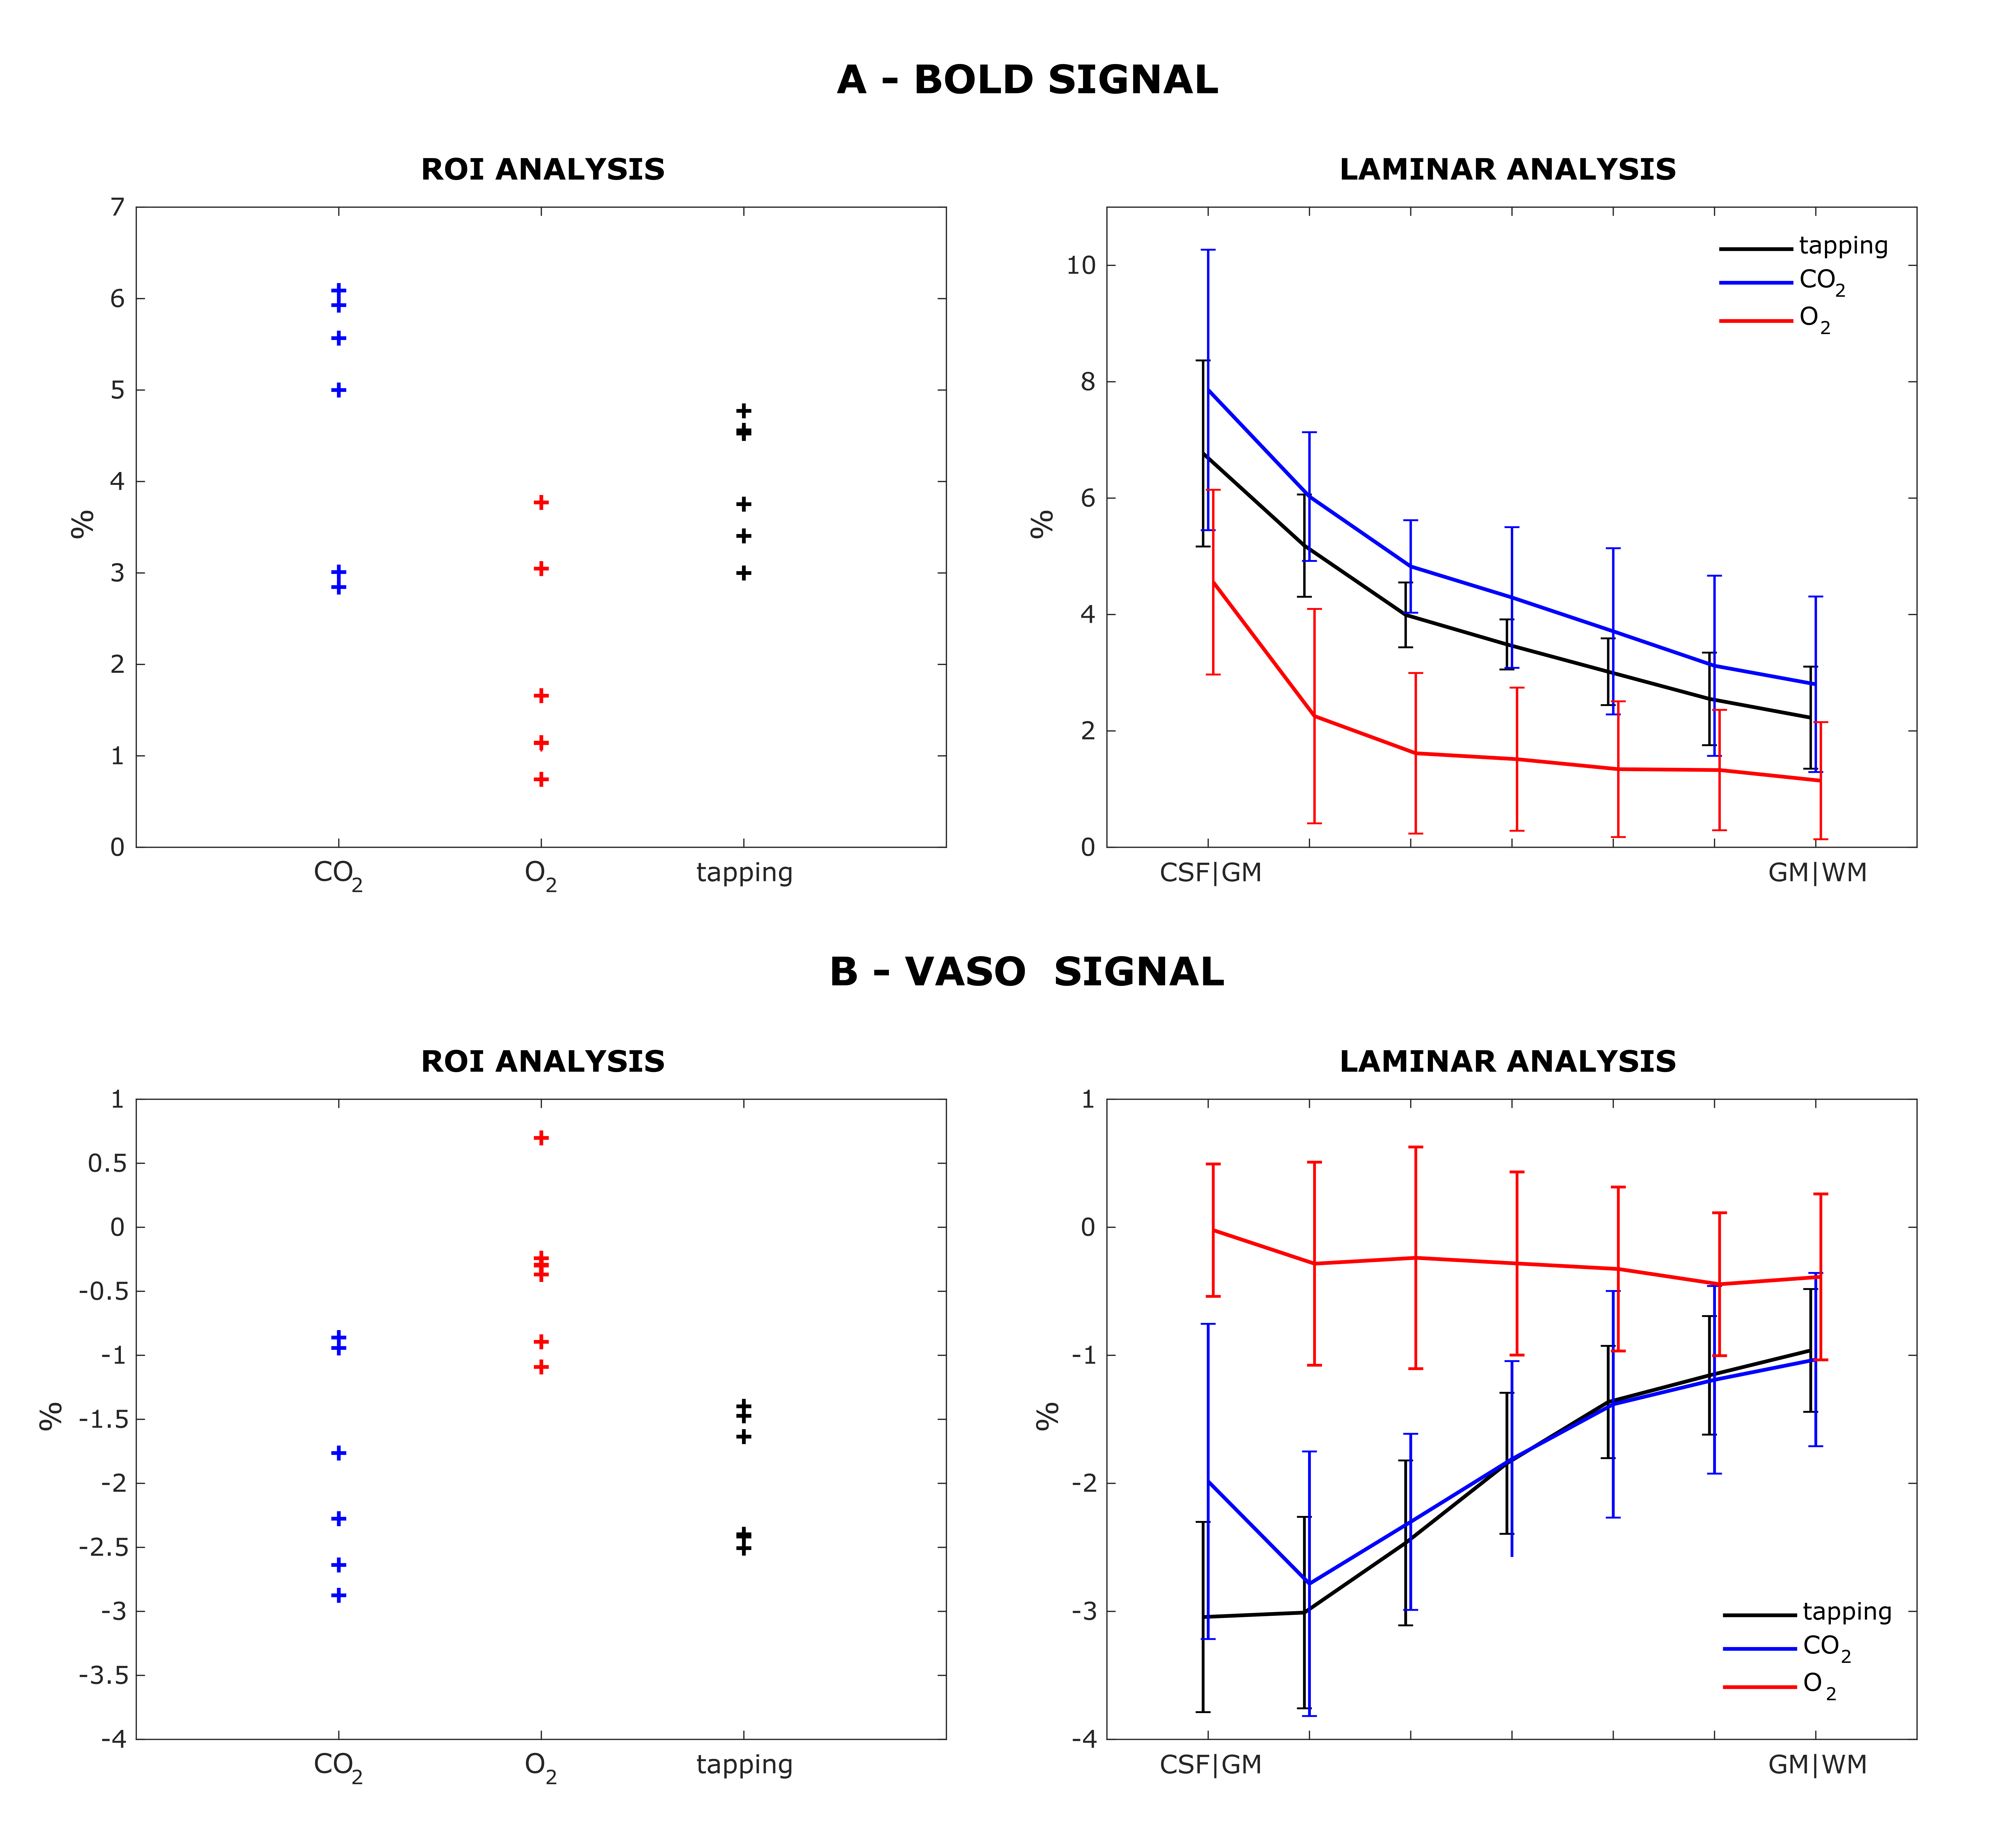
Fig. 3 - BOLD and VASO signals from motor and respiratory tasks.
A: BOLD signal changes in the hKnob for tapping, CO2 and O2 challenges (black, blue and red respectively). On the left mean values across the ROI for each subject; on the right laminar profiles averaging across voxels and subjects (mean±sd bars).
B: VASO signal changes in the hKnob for tapping, CO2 and O2 challenges (black, blue and red respectively). On the left mean values across the ROI for each subject; on the right laminar profiles averaging across voxels and subjects (mean±sd bars).

Fig. 4 - Results of calibrated BOLD analysis.
A: Parameters calculated for both CO2 and O2 calibration (blue and red respectively, mean±sd bars) in the hKnob. Note that two subjects had implausible values of δCMRO2,HO < -80% and therefore are not shown.
B: Cortical profiles of parameters calculated for both CO2 and O2 calibration (blue and red respectively, mean±sd bars). One subject was excluded from all laminar analyses, due to poor quality of laminar data. The δCMRO2,HO profile is calculated as the mean of the only 2 subjects for which laminar δCMRO2,HO values were in the [-80 80]% range.
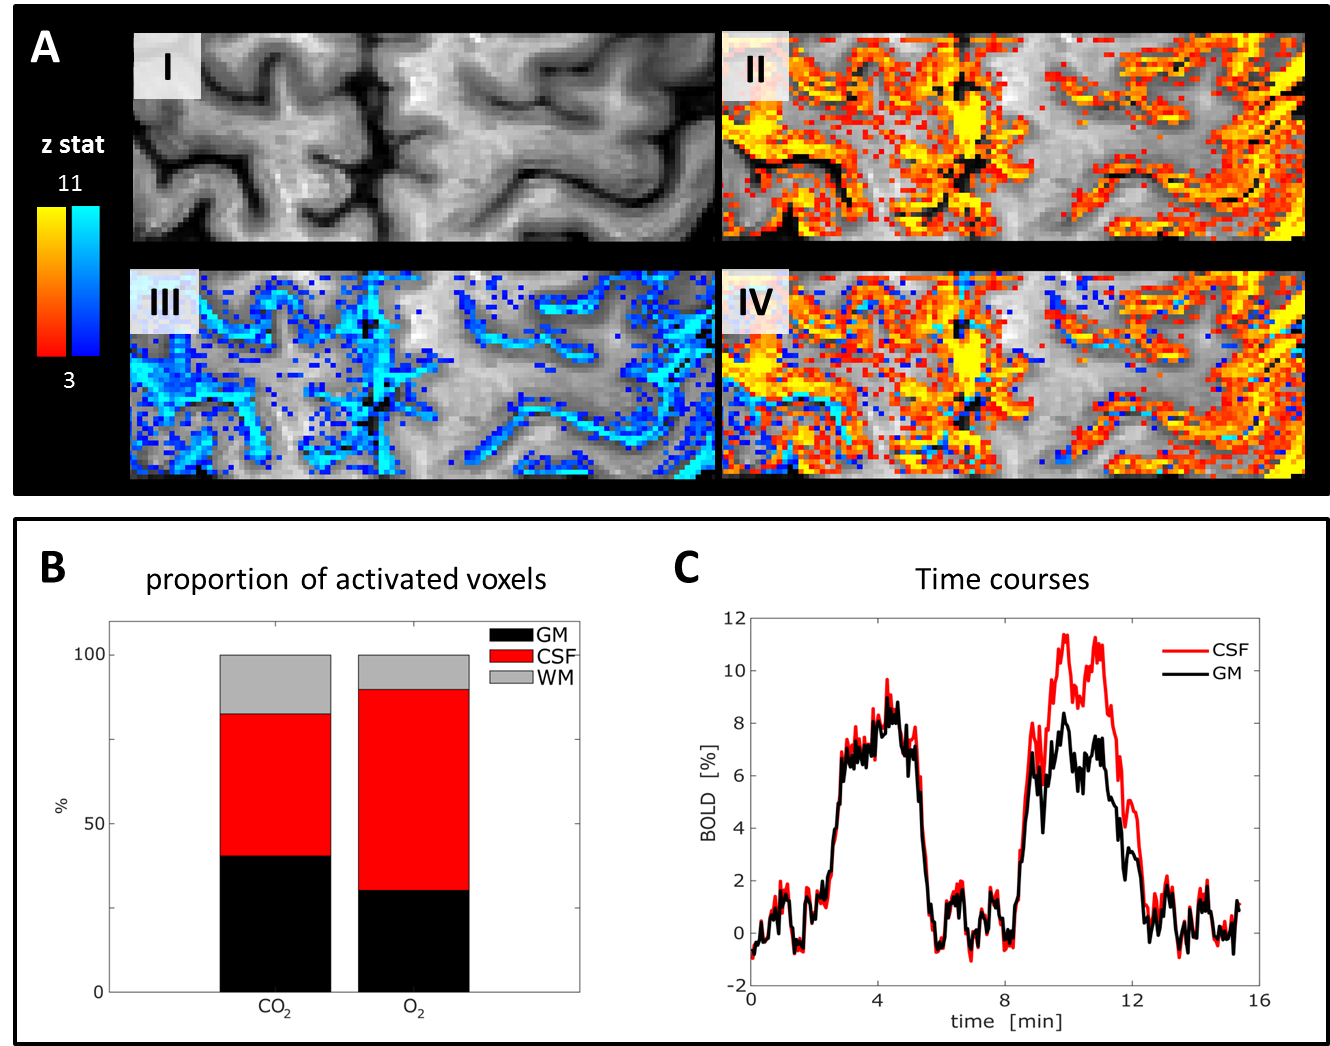
Fig. 5 - Spatial mismatch between BOLD CO2 and O2 activation.
A: Maps of tSNR (I) overlaid with statistical maps relative to CO2 (II) and O2 (III) activation. Superimposing the two statistical maps (IV), it becomes clear that O2 activation was predominant in the CSF. Data from a single representative subject.
B: Proportion of most activated voxels (z > 90th percentile) classified as GM, WM and CSF for each gas (mean across subjects).
C: BOLD time courses of most activated voxels classified as GM and CSF (mean across subjects). CSF shows a BOLD response to O2 higher than GM (ns).