0396
Estimating the Spatial Precision of Multivoxel Pattern of BOLD Response at 7T1CMRR, University of Minnesota, Minneapolis, MN, United States, 2University of Glasgow, Glasgow, United Kingdom, 3Maastricht University, Maastricht, Netherlands
Synopsis
fMRI has limited spatial accuracy due to the vascular nature of the signal source. At high fields, sub-millimeter functional images can be acquired with the hopes of investigating cortical columns and/or layers. The efforts to improve the spatial accuracy of the signals tends to be focused on the acquisition side, rather than the analysis side. Here, we explore the use of multi-voxel pattern analysis as a means to circumvent the apparent spatial specificity limits of ultra-high field fMRI.
Introduction
At ultra-high field, functional voxels can span the sub-millimetre range, measuring 0.8 mm3 (e.g. 1). These super-high-resolution images allow recording blood oxygenation level dependent (BOLD – 2) responses at the level of some of the most fundamental units of neural computation: cortical layers and columns. Such a sub-millimeter resolution however is only nominal in nature as a number of factors – including voxel blurring along the phase encode direction and proximity to large draining vessels – limit the spatial acuity of functional voxels. Studies investigating the functional spatial precision of a single voxel at 7T, using gradient echo BOLD contrast, have shown that it spreads beyond the millimeter range, with an upper limit of ~2 mm (3). Multi-Voxel Pattern Analysis (MVPA) may provide a means for retrieving a spatial precision in high field GE BOLD fMRI that goes beyond that available at the single voxel level. Here, we directly measure the spatial acuity afforded by MVPA at 7T, by analyzing cortical depth dependent feed-forward and feed-back signals elicited by natural scenes in V1.Methods
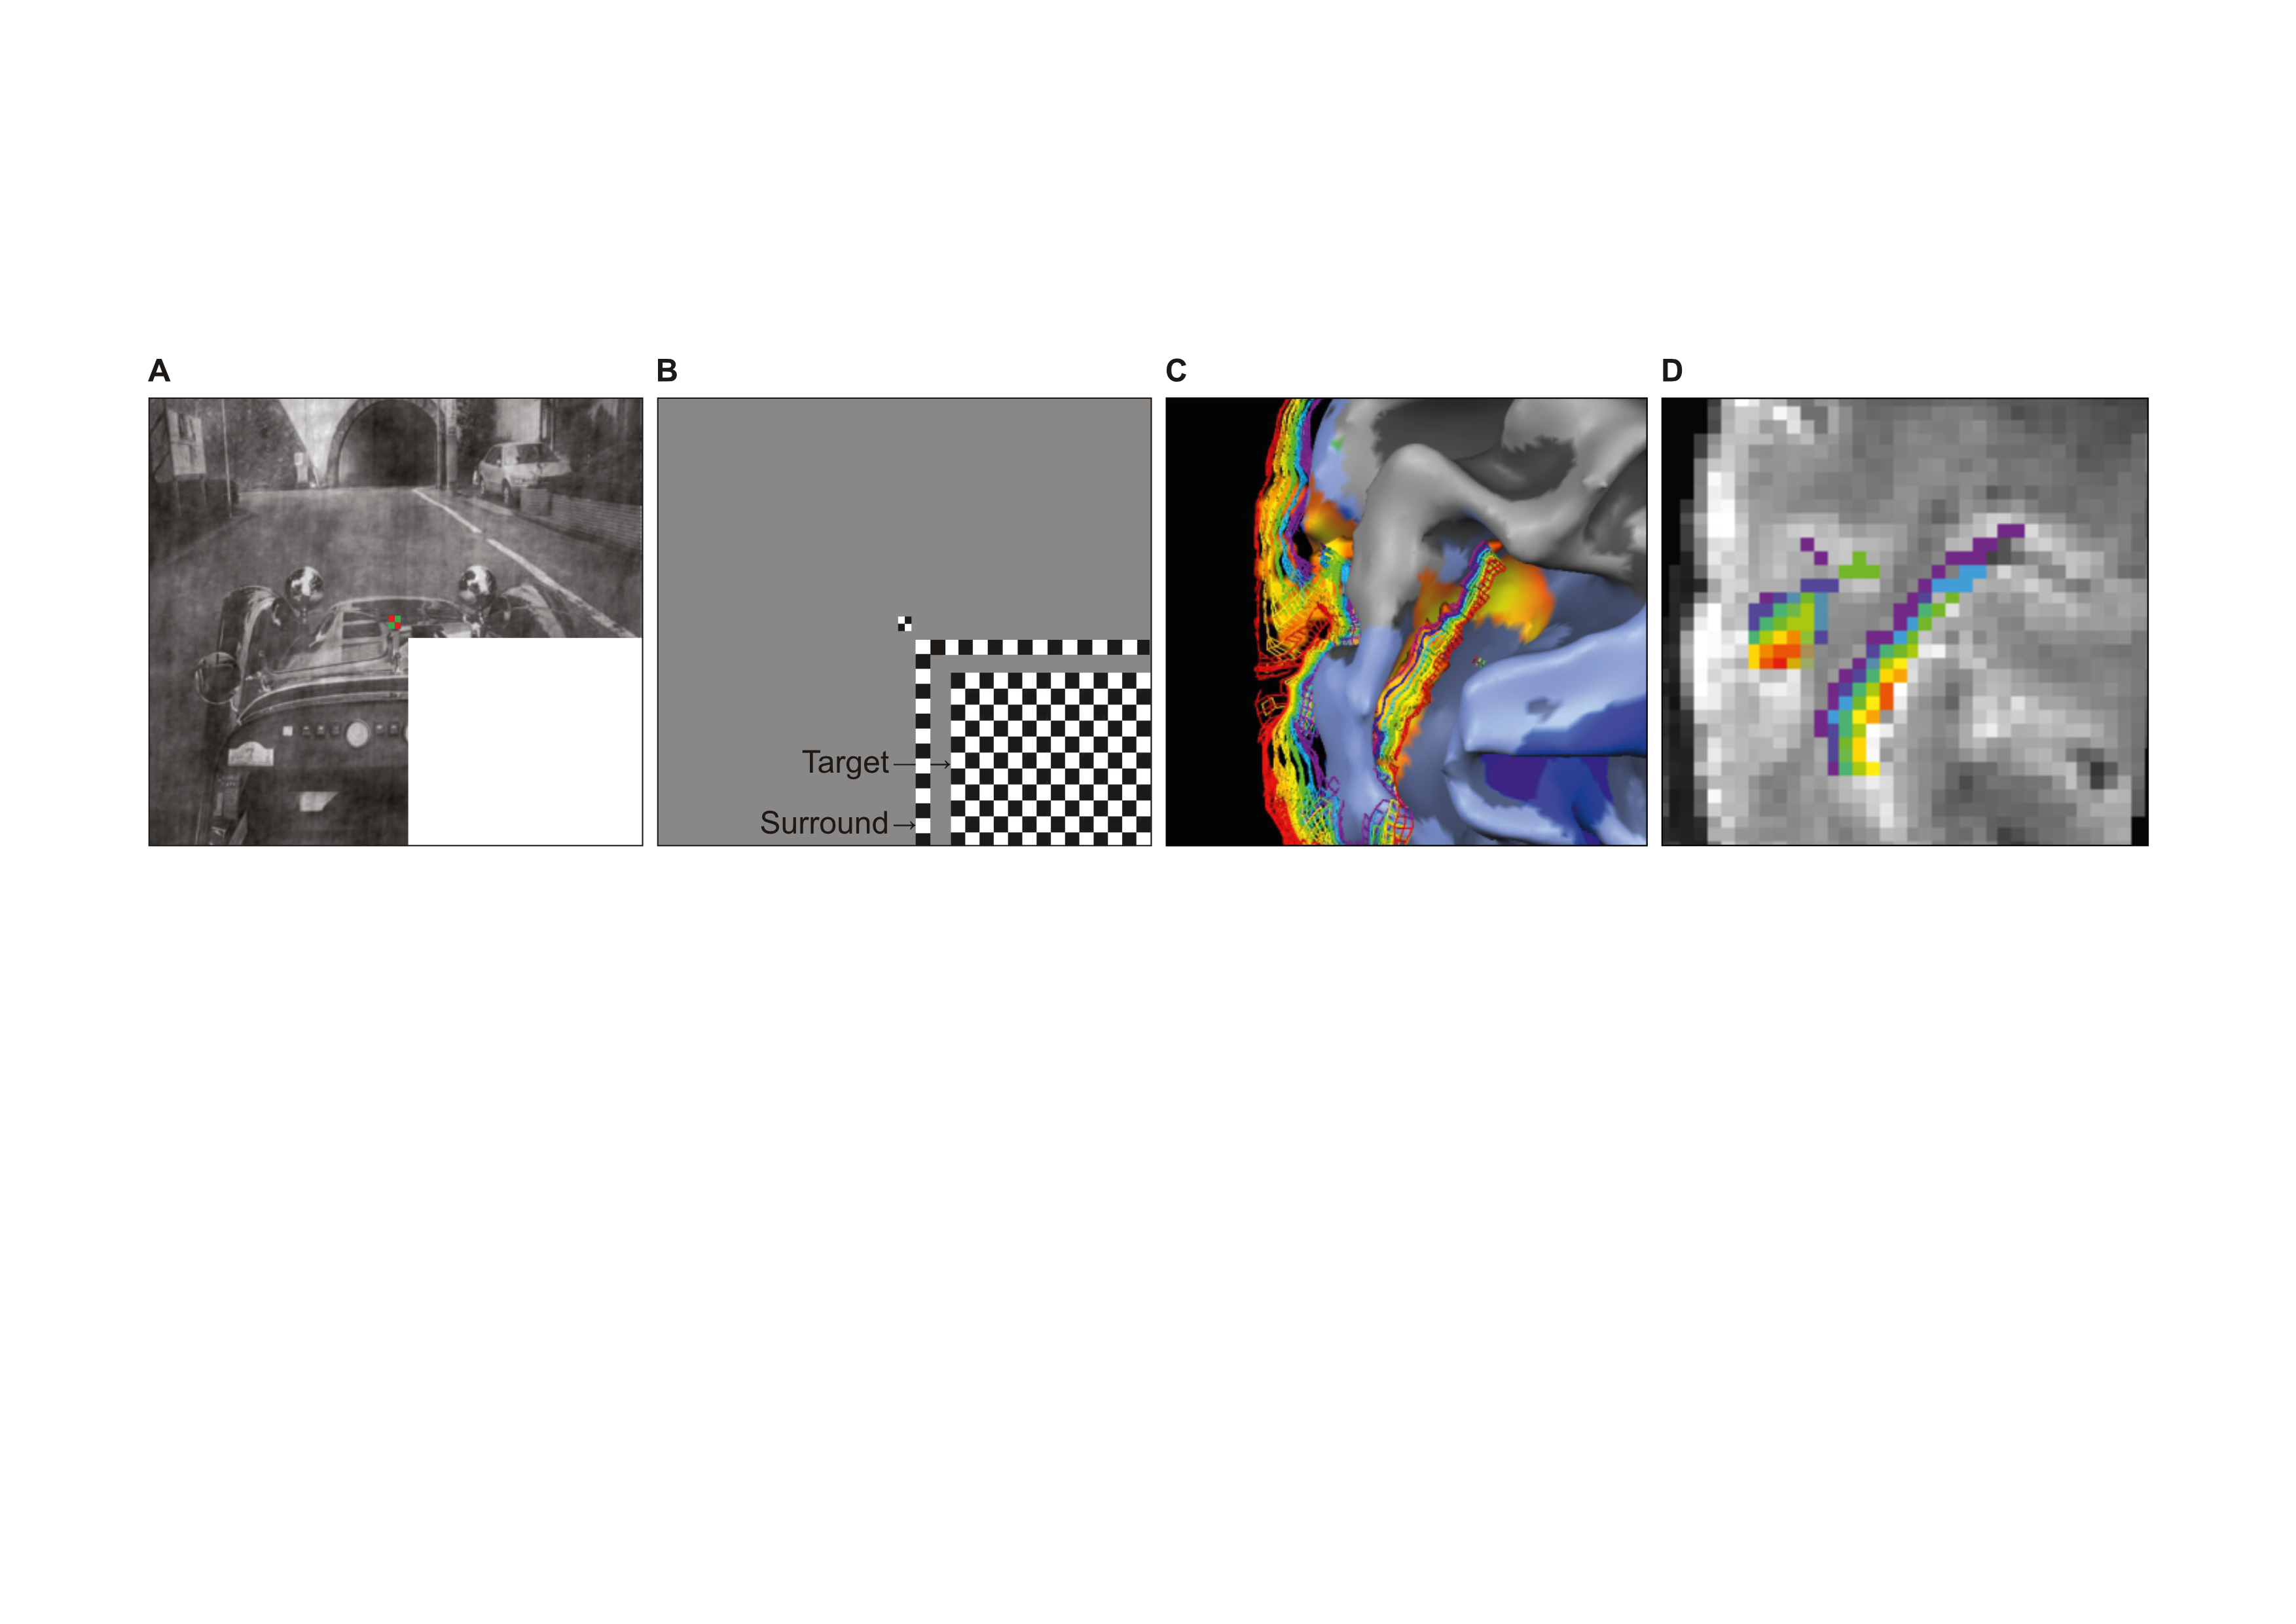
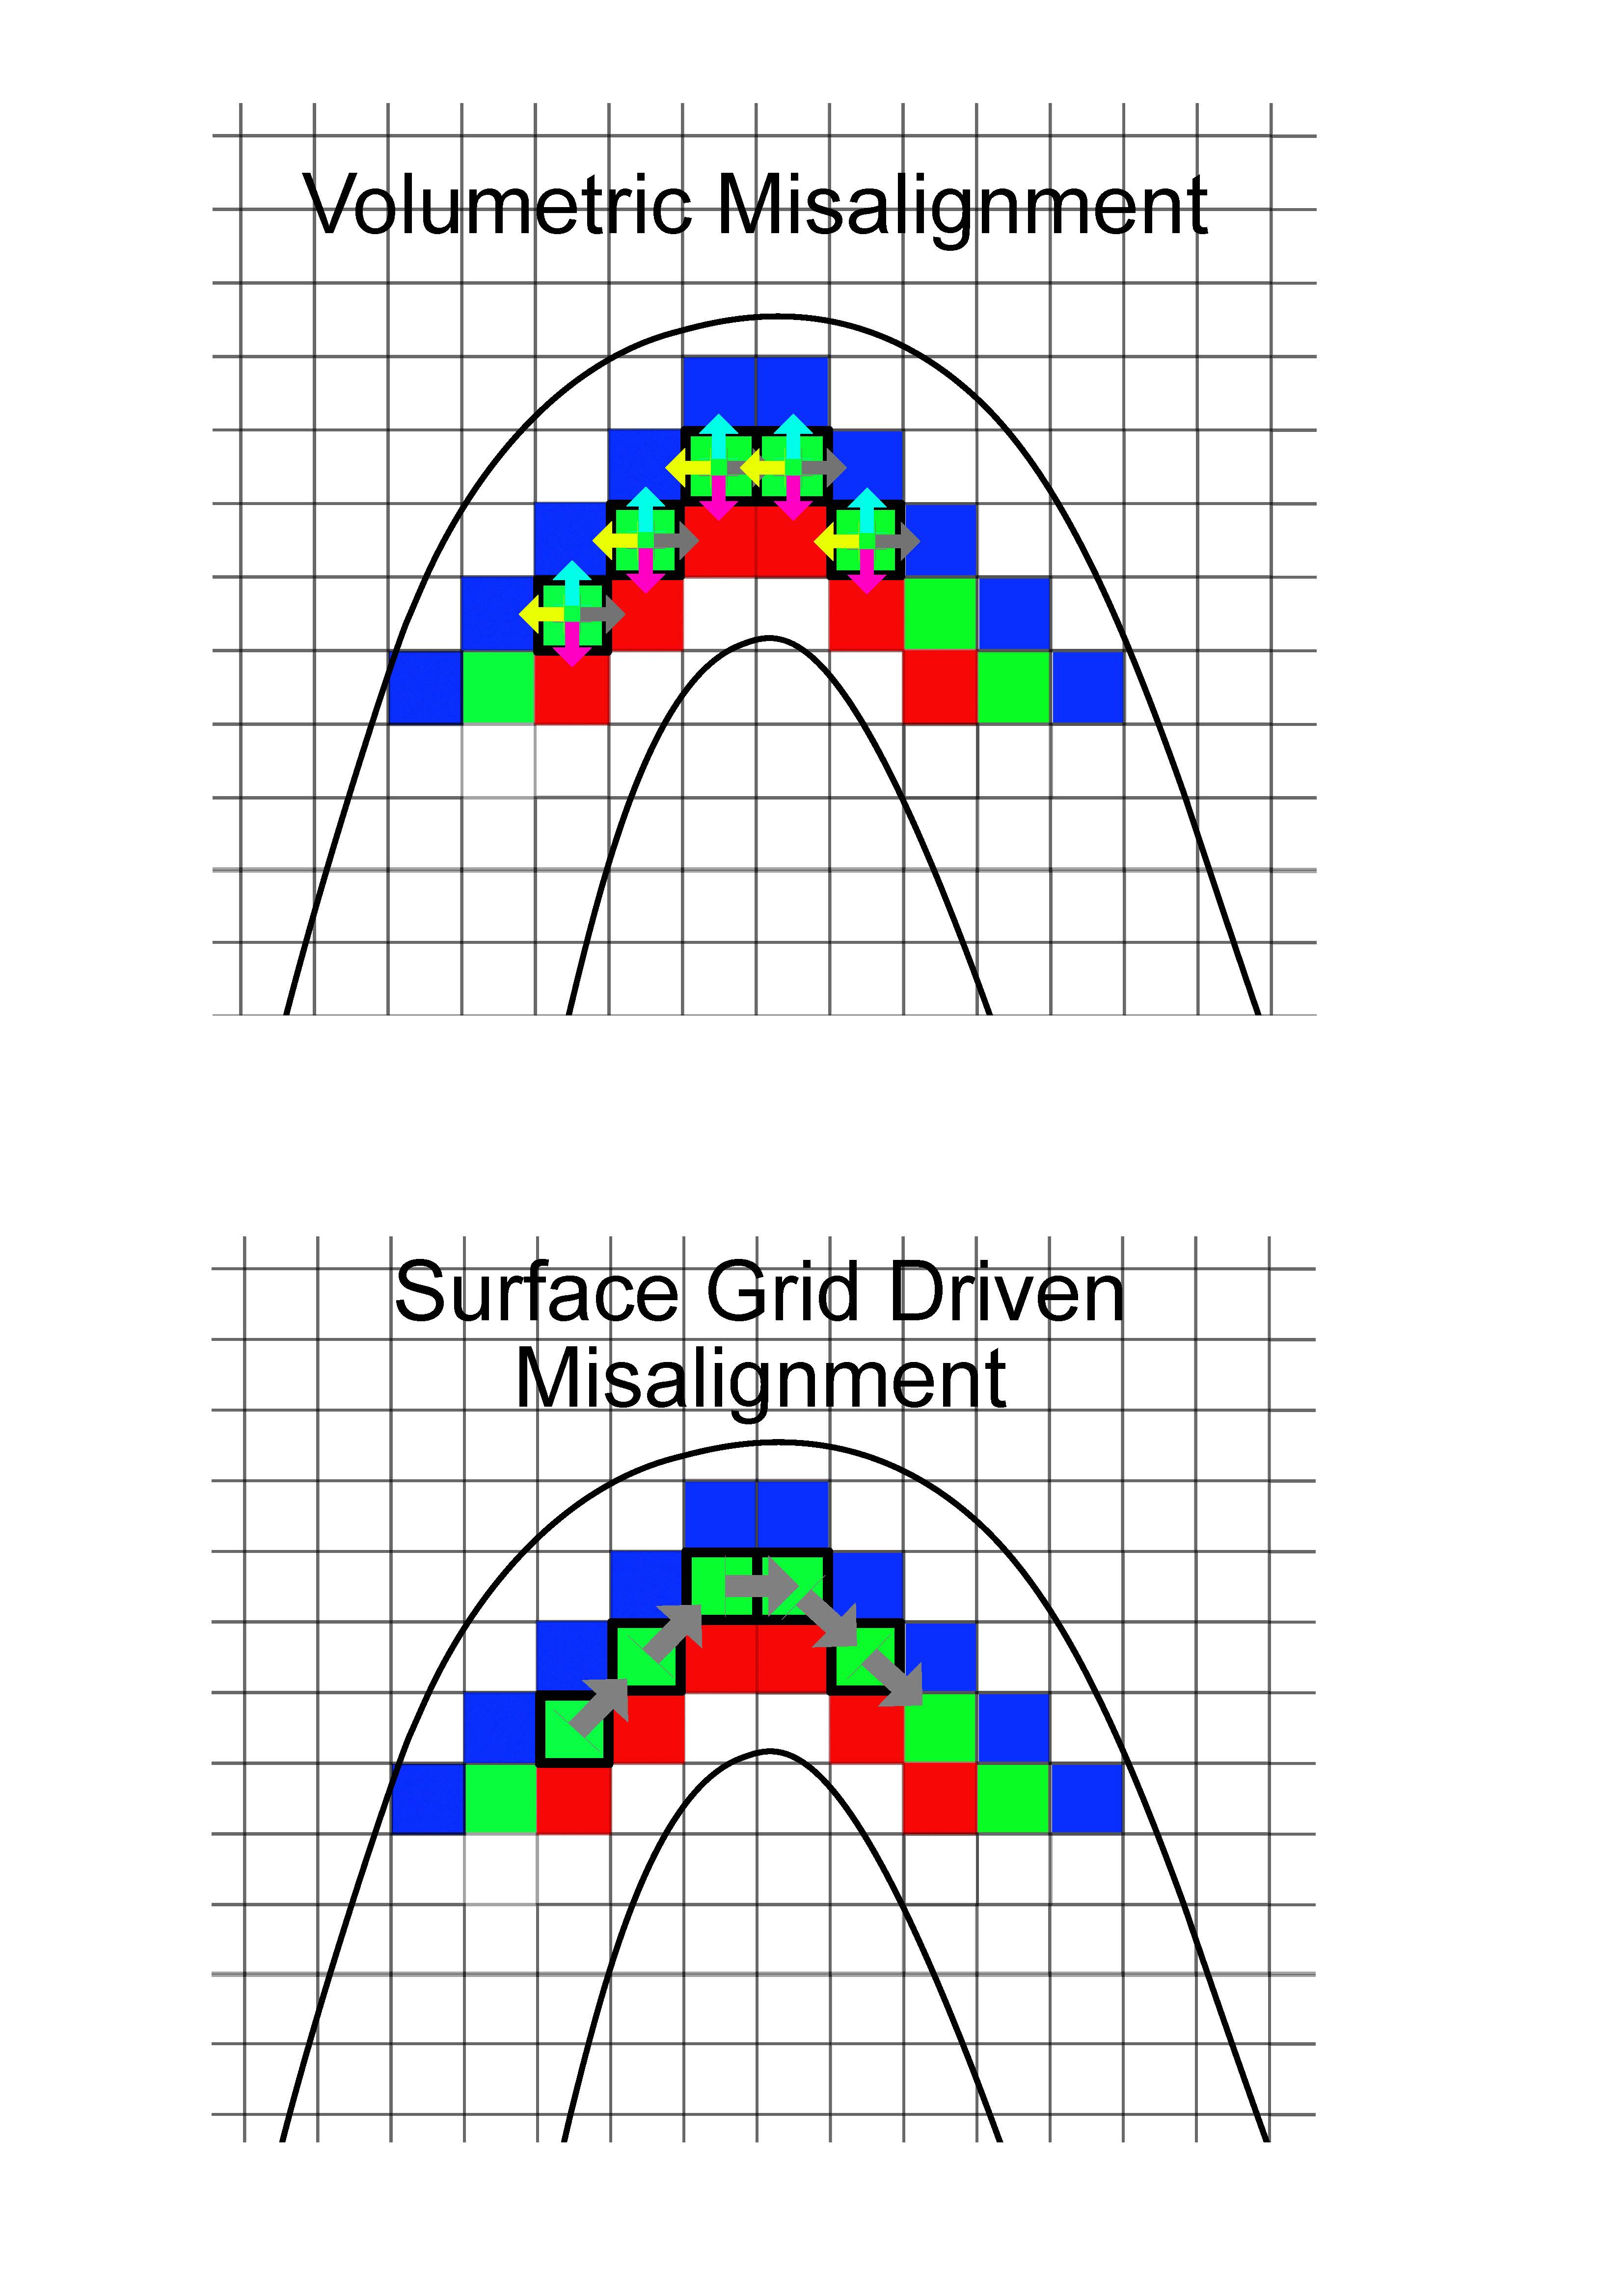
Functional scans were recorded from 4 subjects using GE-EPI at high resolution (isotropic 0.8 mm3, TE = 17 ms, maximum flip angle =85°, slices = 38, TR= 2000 ms, FOV=128 x 128 mm2, matrix: 160 x 160, IPAT = 2, partial Fourier = 6/8, pixel bandwidth = 1375 Hz/pixel) on a 7 Tesla scanner. After manually segmenting the cortex, we parcellated the cortical sheet into 6 equally spaced depths, ranging from 10% to 90% distance from the Pial surface. We analyzed feed-back and feed-forward signals triggered by images of natural scenes in V1 defined using standard polar retinotopic mapping (1). To isolate feed-back activity, retinal input was blocked by occluding the bottom right hand quadrant of the image stimuli (4). All analyses were confined within the cortical representation of the stimuli’s bottom right hand quadrant. We determined the information scale exploited by SVM by artificially misaligning the pattern structure in increasing spatial steps and investigating the breakdown of the MVPA classifier performance. Specifically, we trained SVM classifiers independently for each cortical depth in V1. We then simulated different extents of misalignment by parametrically shifting a test ROI from zero to five voxels and measured the impact of this artificial misalignment on decoding accuracy. We performed 2 types of artificial misalignment: 1) “volumetric misalignment”, where the test ROI was misaligned along all dimensions, allowing it to trespass into neighboring depths in volume space; 2) “surface grid driven misalignment”, where misalignment occurred only along an iso-depth cortical surface grid.Results
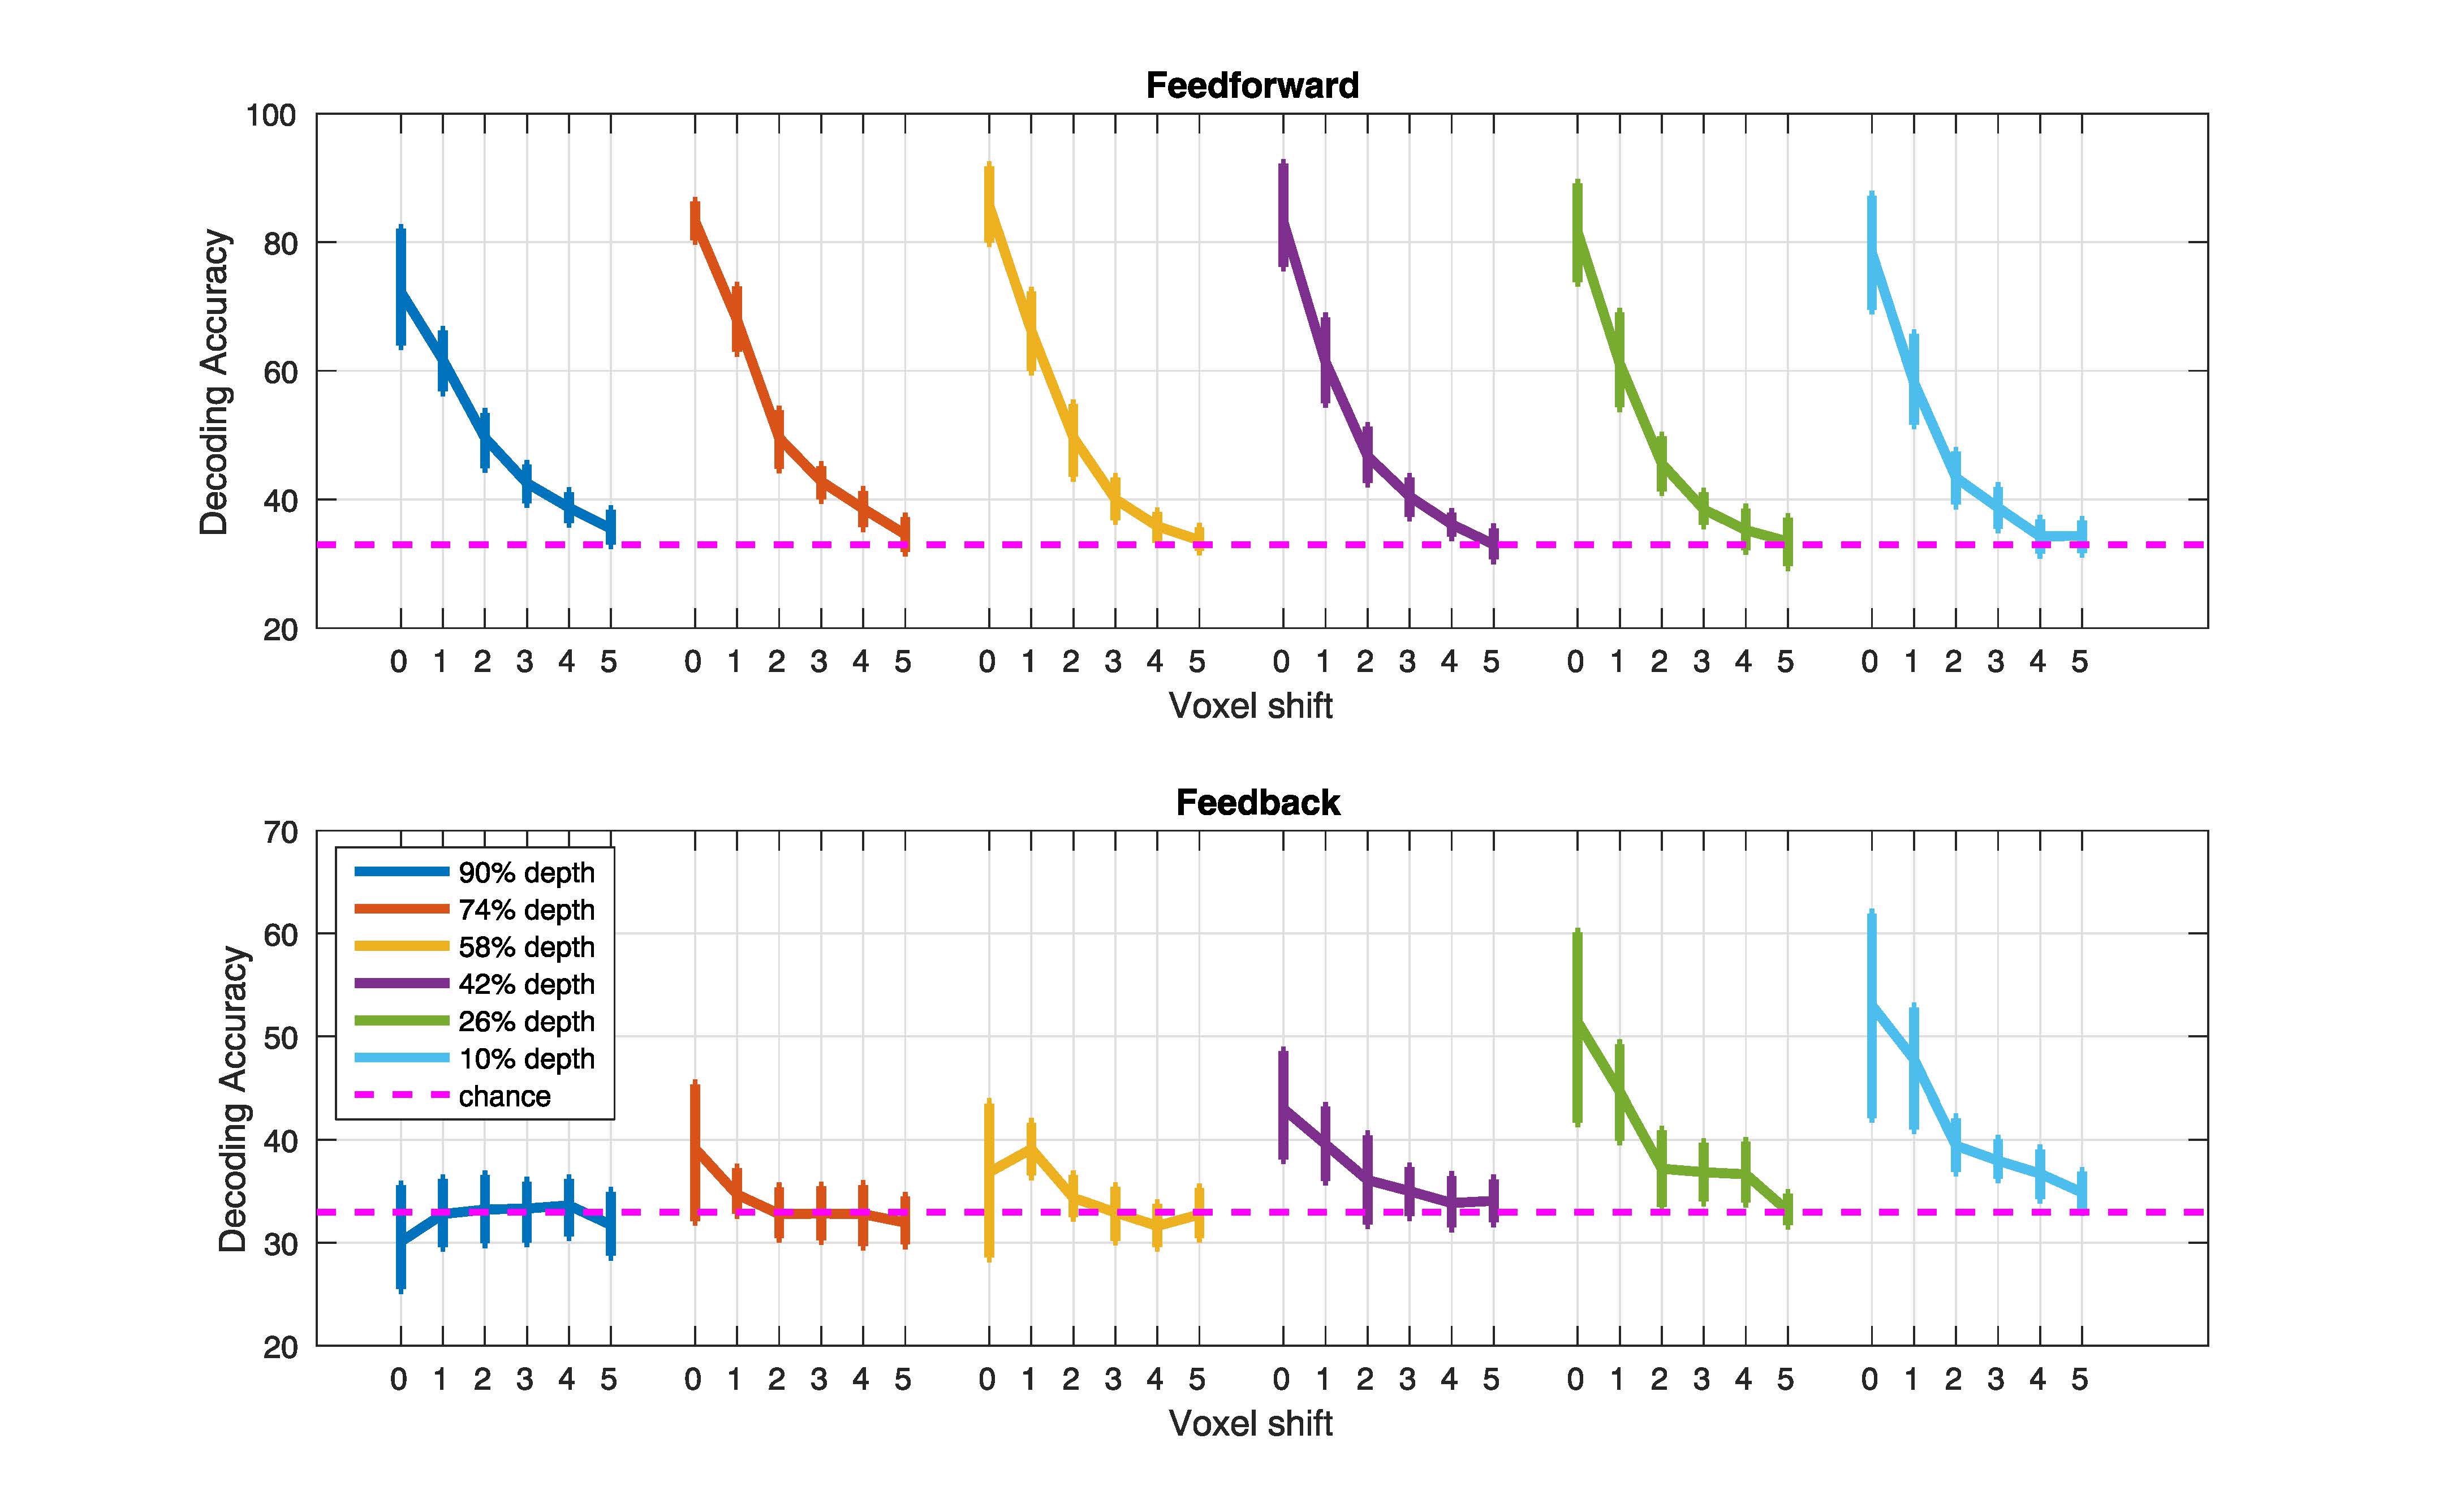
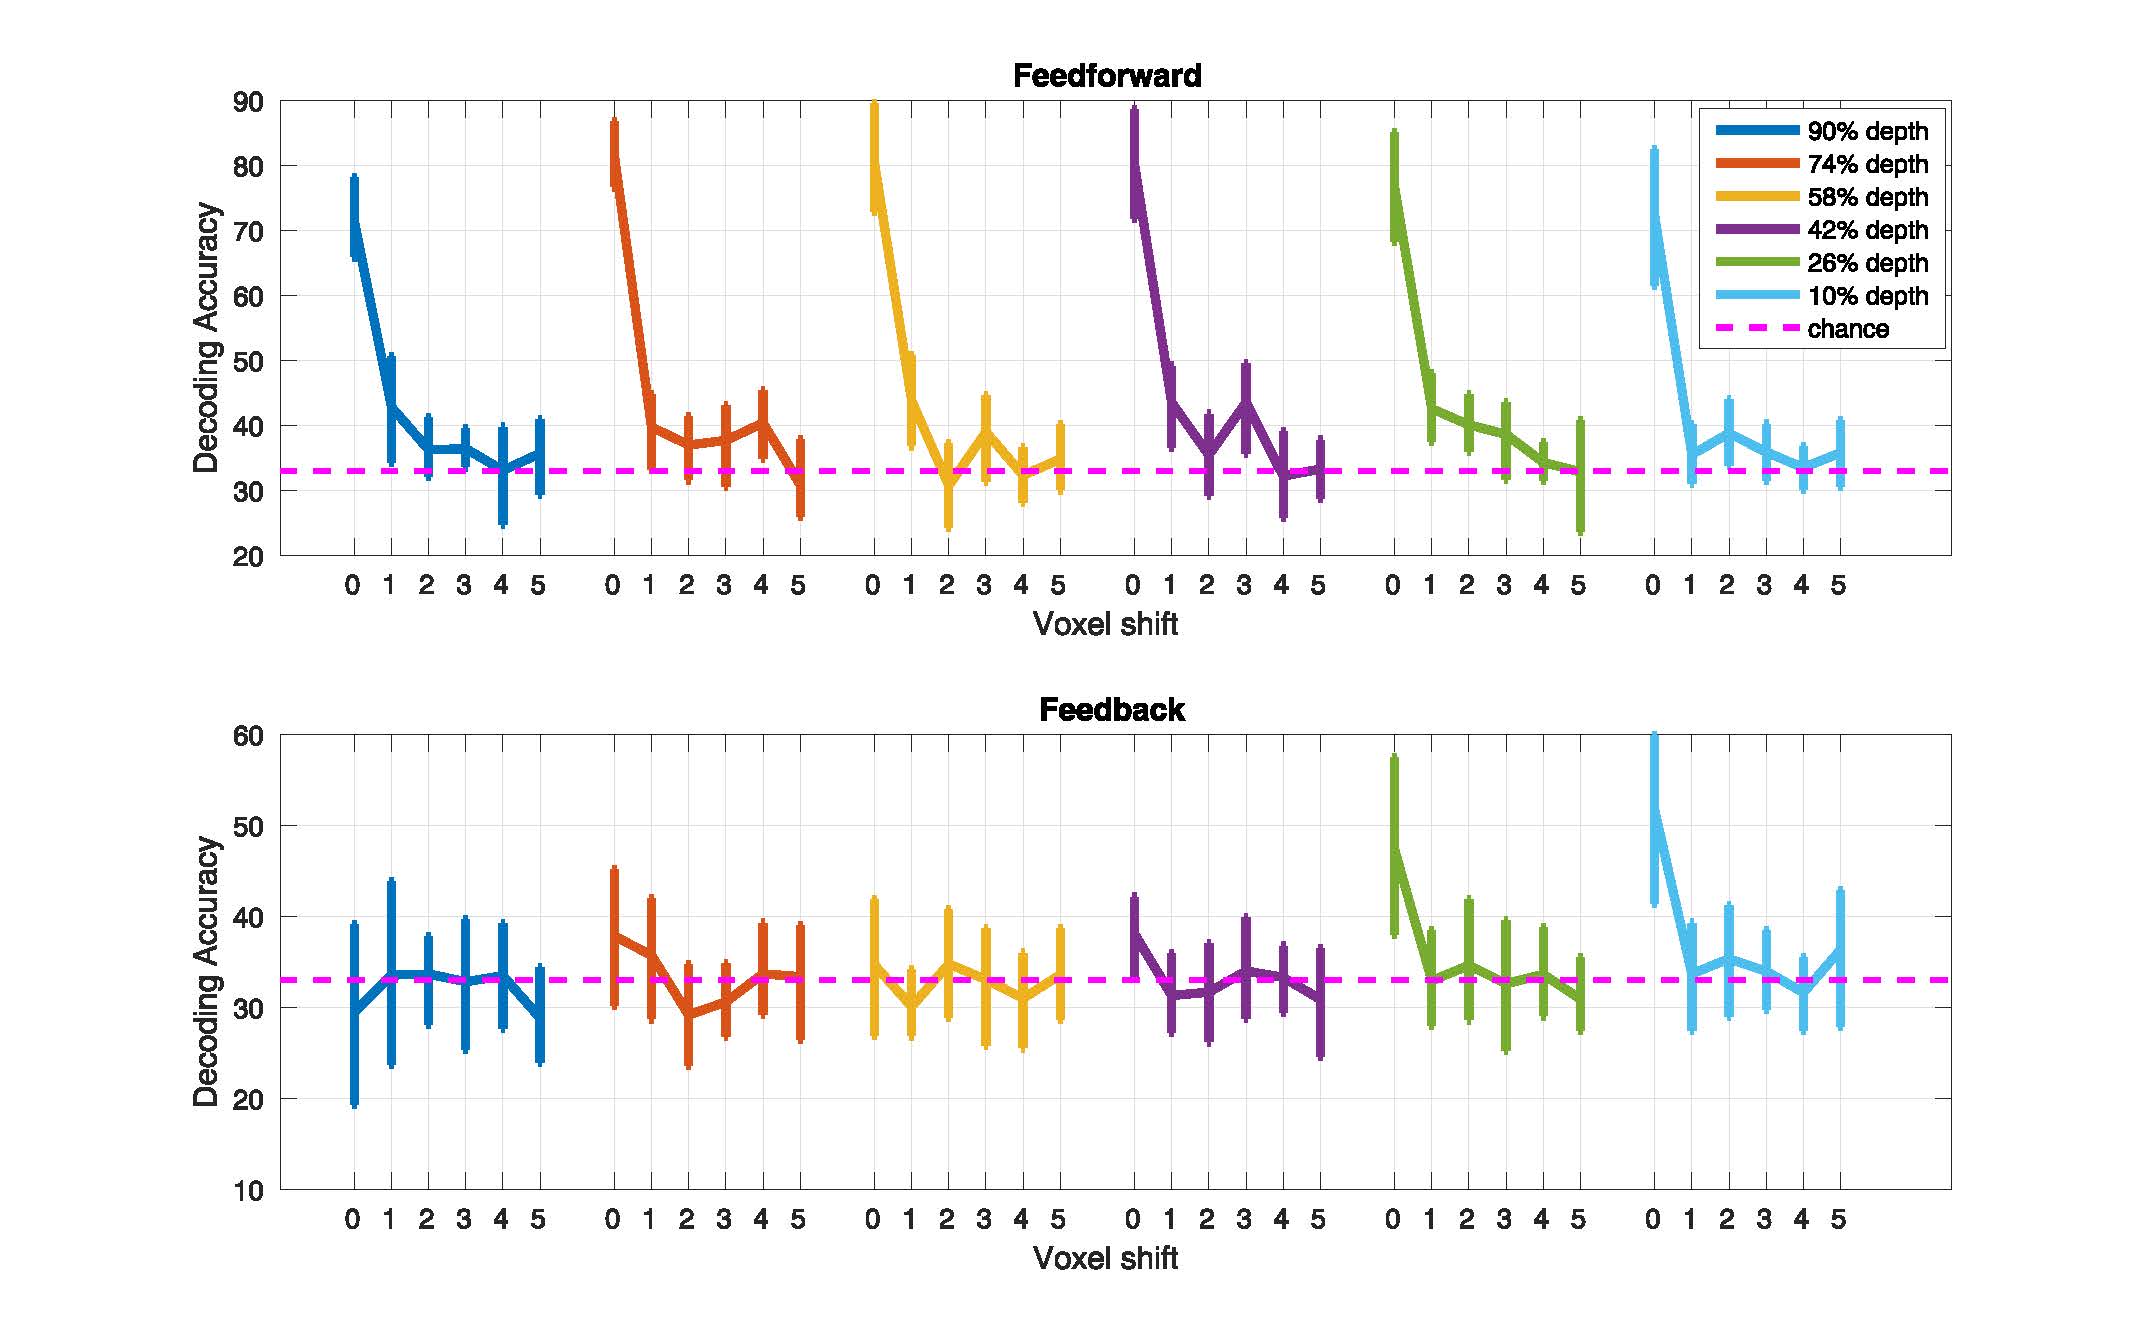
SVM classification for the original un-shifted ROI was significant at each depth for each subject (permutation tested at 5%; no corrections) during feed-forward stimulation of V1, and only for the 2 superficial depths (10% and 26% distance from the Pial surface) during feed-back. In both misalignment regimes, as little as one voxel shift led to a significant decrease in SVM accuracy (p<.05) across all cortical depths. We further observed that, while for the volumetric misalignment >4 voxels shift was required for the SVM accuracy to drop to chance level, in the surface grid driven regime, one voxel shift caused SVM accuracy to be at chance.Discussion
The finding that one voxel shift leads to a significant impairment in decoding accuracy indicates that a multi-voxel pattern of activity carries information that is precise to at least the nominal resolution of single voxels, 0.8 mm in this case. We argue that our results suggest that MVPA can in fact retrieve finer-grained information compared to that offered by a single voxel’s BOLD precision. Importantly, the comparable impact of misalignment across cortical depths suggests that the impact of large draining vessels, that are prominent in proximity of the Pial surface and are known to compromise the acuity of single voxels, do not, in this case, significantly impact the spatial specificity of multi-voxel pattern of BOLD response. The findings presented here have strong implications for high resolution fMRI studies, suggesting that tailored analytical approaches could help overcome limitations in the specificity of the functional signals and permit studying the mesoscale organization of the human brain with higher sensitivities.Acknowledgements
No acknowledgement found.References
1. Muckli L., De Martino, F., Vizioli L., Petro L.S., Smith, F.W., Ugurbil, K., Goebel, R. & Yacoub, E. (2015). Contextual feedback to superficial layers of V1. Current Biology.
2. Ogawa, S., Tank, D. W., Menon, R., Ellermann, J. M., Kim, S.-G., Merkle, H., & Ugurbil, K. (1992). Intrinsic signal changes accompanying sensory stimulation: functional brain mapping with magnetic resonance imaging. PNAS
3. Shmuel, A., Yacoub, E., Chaimow, D., Logothetis, N.K., Uğurbil, K., 2007. Spatiotemporal point-spread function of fMRI signal in human gray matter at 7 Tesla. Neuroimage.
4. Smith, F.W., and Muckli, L. (2010). Nonstimulated early visual areas carry information about surrounding context. PNAS.
Figures