0395
The EPI rs-fMRI signal shows an orientation effect with respect to B0 and phase-encode axis across cortical depth1Athinoula A. Martinos Center for Biomedical Imaging, Department of Radiology, Harvard Medical School, Massachusetts General Hospital, Charlestown, MA, United States, 2Max Planck Institute for Biological Cybernetics, Tübingen, Germany, 3Division of Health Sciences and Technology, Massachusetts Institute of Technology, Cambridge, MA, United States
Synopsis
The cortex exhibits a strict vascular architecture and vessel orientation to the B0 field should impact the local susceptibility and hence the local BOLD signal. Cortical folding could thus lead to local variations in the signal. Here, we used high-resolution 7T EPI rs-fMRI data and found substantial variations of the signal amplitdude's coefficient of variation (σ/μ) with the local cortical orientation to B0. This effect was measurable throughout cortical depths with a maximised effect of +70% at the surface. We compare this to orientation-dependent blurring effects along the phase-encode axis, which we found to be significant too.
Introduction
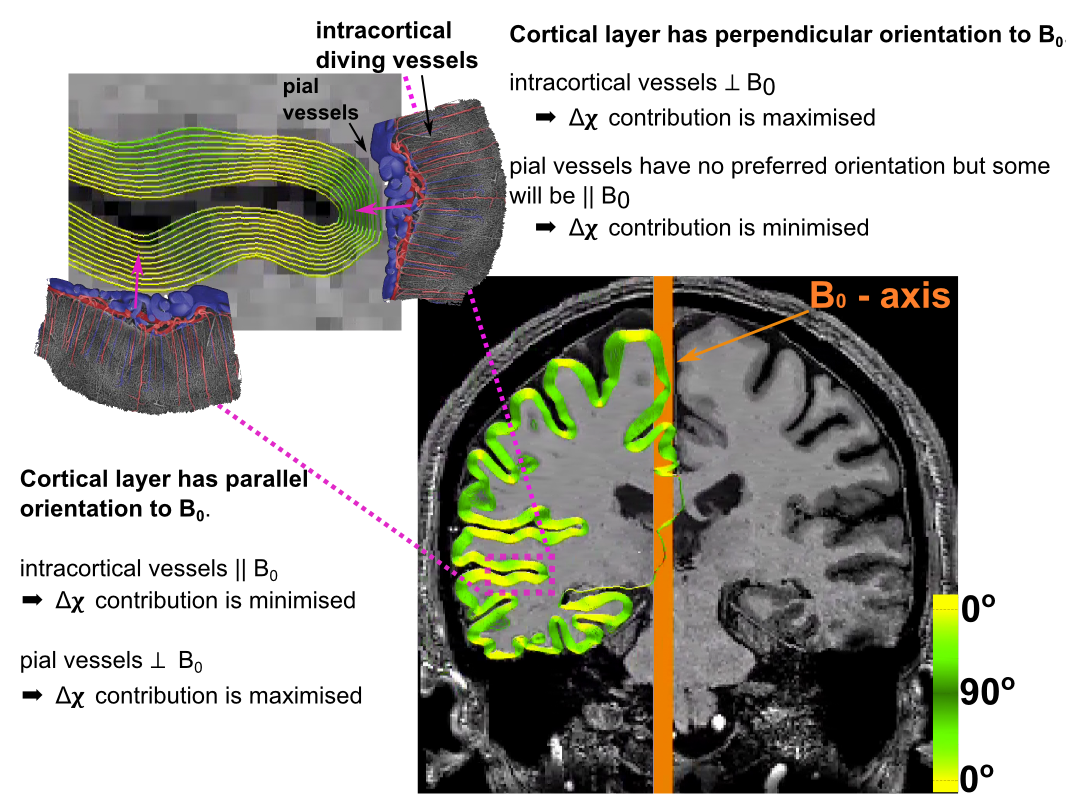
The cortical vasculature is structured into pial vessels lying tangentially at the cortical surface, intracortical vessels diving perpendicularly from the surface into the tissue, and randomly orientated parenchymal capillaries. The high-field BOLD signal originates primarily from extravascular dephasing which depends on vessel orientation relative to B0. Hence, it is likely that the BOLD signal varies with the local orientation of B0 to the cortex1,2. This B0-orientation dependence has been shown to modulate the hypercapnic BOLD signal up to 30% at 3T1. Here, we investigate whether this anisotropy also modulates resting-state fMRI (rs-fMRI) amplitudes by calculating the coefficient of variation (inverse tSNR). Because tSNR is also impacted by spatial blurring imposed in the point-spread function along the phase-encoding (PE) direction, we compared the effect of local cortical orientation to the PE-axis.Theory
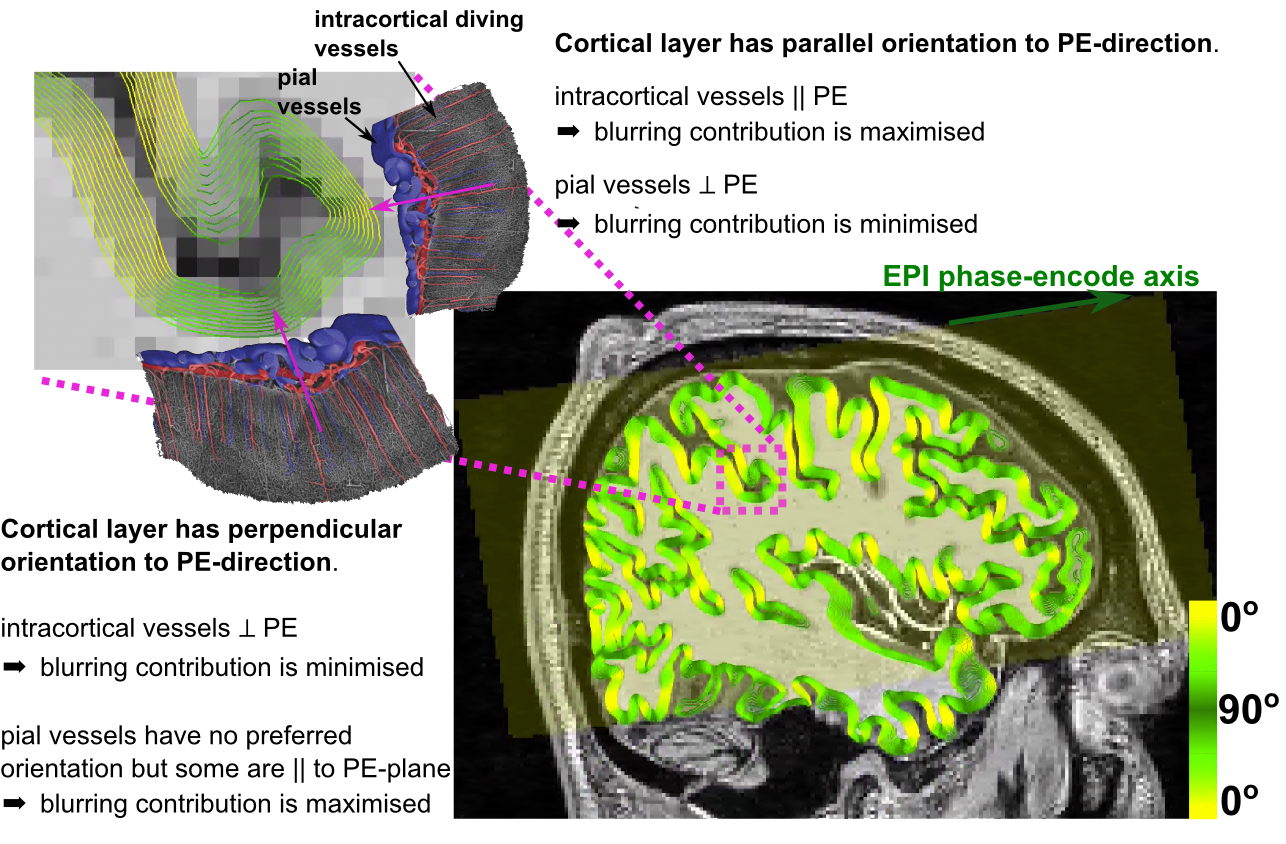
Fig.1 illustrates how susceptibility shifts are alternately maximised and minimised for pial and intracortical vessels depending on cortical orientation to B0. Susceptibility shifts are expected to be maximised when the cortical surface is parallel to B0 ($$$\theta_{B0}=0^\circ$$$), because the largest vessels—which are on the pial surface—are perpendicular to B0 and thus maximise extravascular dephasing. Fig.2 illustrates PE-blurring which is maximised when the cortical surface is perpendicular to the PE-direction ($$$\theta_{PE}=90^\circ$$$) where pial vessels are mostly parallel.Methods
12 healthy subjects were scanned on a 7T scanner (Magnetom, SIEMENS, Germany) using a custom-built 32-Rx/1Tx head coil. Axially-oriented
EPI data were acquired on 5 subjects, and sagittally-oriented data were acquired on 8 subjects to control for misinterpretation of through-slice
blurring effects as B0 effects. Each voxel’s mean signal (μ) and
time-series SD (σ) were calculated for the EPI runs (after slice-timing and motion correction and temporal smoothing). All subjects had an MEMPRAGE T1-weighted scan
of 0.75 mm isotropic resolution. Cortical surfaces were reconstructed using
FreeSurfer, as described previously3.
Axial acquisition: Each
session consisted of 6 runs of rs-fMRI with gradient-echo SMS-EPI with
resolution=1.1mm isotropic, matrix=174x174x87,MB=3,PAT=4, TR/TE=1700/26ms,
FA=65°, echo-spacing=0.79ms,160 volumes, PE-direction=anterior→posterior.
Sagittal acquisition: Each session consisted of 3 runs of the above
sequence with resolution=1.2mm isotropic, matrix=160x160x128, echo-spacing=0.76ms, 100 volumes, TR/TE=3500/23ms, PE-direction=anterior→posterior.
Cortical depth and orientation analysis
Intracortical surfaces were
reconstructed at 0.1 intermittent depth increments (white = 0, pial =1) using
FreeSurfer. The normal at each surface vertex was calculated as the weighted
average of its neighbouring face normals. The EPI data were registered to the
T1-w scan and each voxel was assigned a relative cortical depth value4 and the normal of the vertex closest to its centroid. The angles between the
normal and the B0-, PE-, readout (RO) and slice-select (SS) axes were
calculated. We expect susceptibility and blurring effects to be axisymmetric
and converted orientation angles to range from 0° (parallel/anti-parallel) to
90° (perpendicular). Figs.1 and 2 illustrate surface reconstructions and
orientations.
Results
Orientation effects
The coefficient of variation σ/μ varies significantly as a function of the B0 and PE-direction (Fig.3). Results were consistent
between the axial and sagittal datasets.
B0-orientation: σ/μ increases with parallel alignment of the cortical normal to B0 (θB0=0°). This is most extreme at the pial surface (≈70%) and decreases with cortical
depth.
PE-orientaion: σ/μ decreases with parallel alignment of the cortical normal to PE (θPE=90°). This is most extreme at
the pial surface (≈−40%) and decreases with cortical depth.
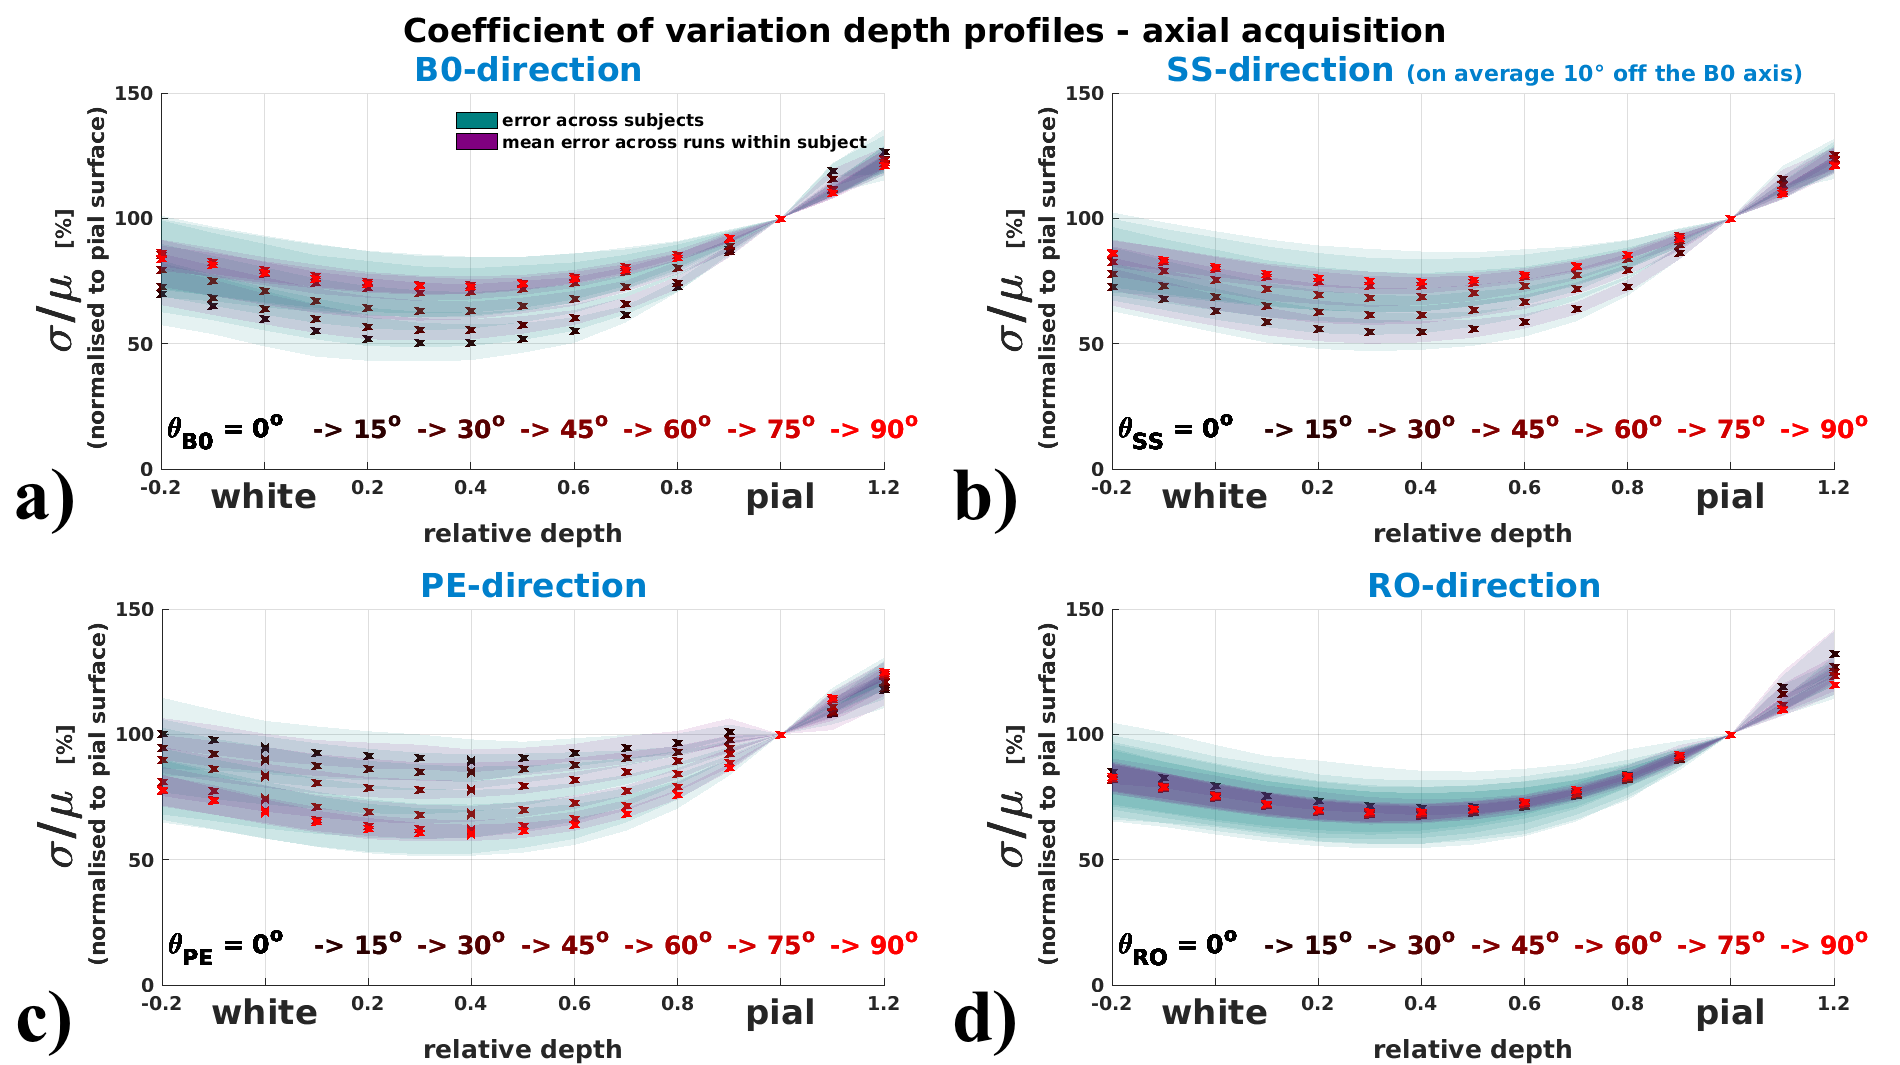
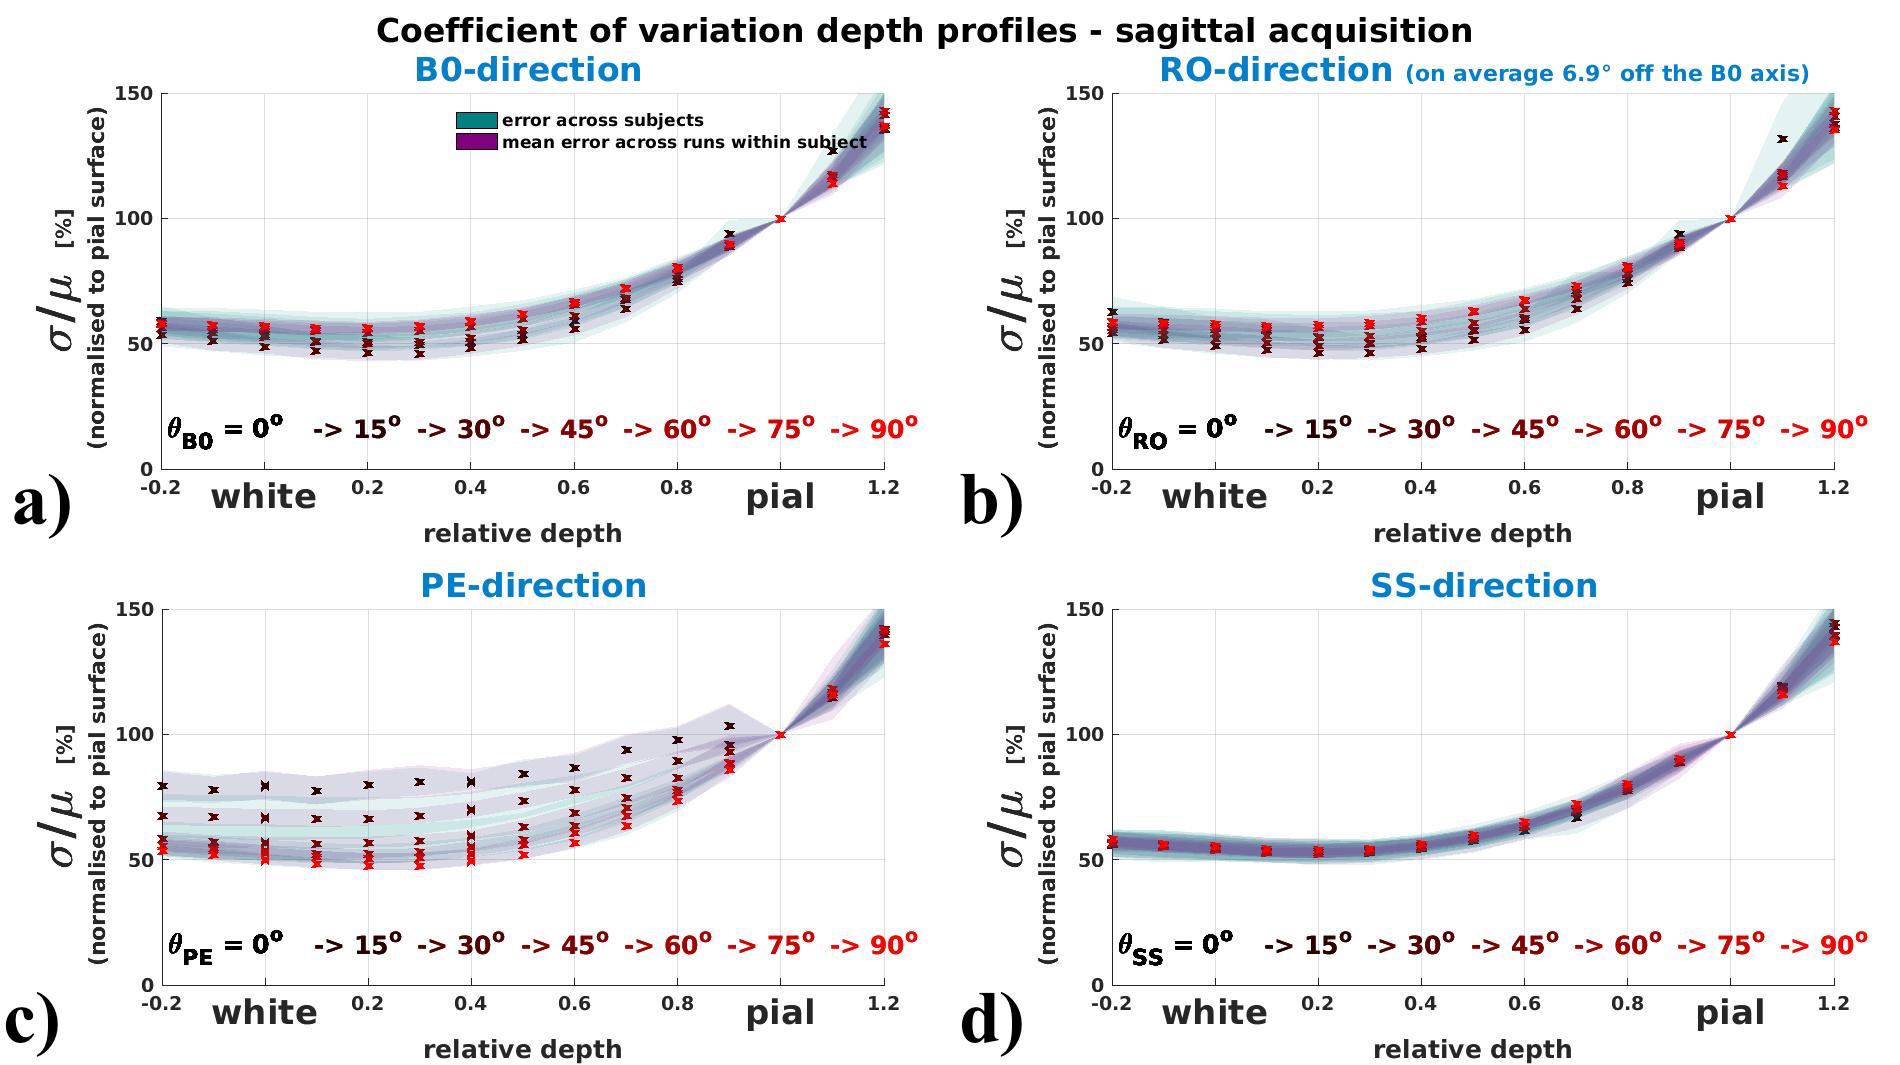
Coefficient of variation depth profiles (vascular architecture effect)
Fig.4 (axial acquisition) and 5 (sagittal acquisition) display how the depth profile
of σ/μ shows orientation effects with respect to the B0- and
the PE-direction. The drop of σ/μ from pial to grey surfaces is
flattened for perpendicular orientation (θB0=90°) and steepest for
parallel orientation to B0 (θB0=0°). Along the PE-direction profiles are
flattened when parallel, and steeper when perpendicular.
Summary and Conclusion
We found that the rs-fMRI signal coefficient of variation:
1. substantially increases from perpendicular to parallel alignment to B0, with up to +70% at the surface;
2. decreases from perpendicular to parallel alignment to the PE-axis, with up to -40% at the surface; and
3. has a depth profile that depends on B0-orientation. This orientation signature is likely a result of the perpendicular alignment of pial to intracortical diving vessels that alternately maximise/minimise their contribution to susceptibility-induced extravascular dephasing.
Because the largest vessels are found at the cortical surface, cortical depth analyses facilitate the estimation of macrovascular contributions to the fMRI signal (including T2*- and T2-weighted BOLD and non-BOLD acquisitions), however they fail to capture the contribution of moderately-sized (~100 μm) diving venules. The orientation signature may provide a means to quantify diving vessel contributions. This finding also suggests that the detection sensitivity of rs-fMRI functional connectivity may depend on local cortical orientation.
Future work aims to disentangle the structured noise contributions of physiological confounds to the orientation effects.
Acknowledgements
This work was supported in part by the NIH NIBIB (grants P41-EB015896, and R01-EB019437), by the BRAIN Initiative (NIH NIMH grant R01-MH111419), and by the MGH/HST Athinoula A. Martinos Center for Biomedical Imaging; and was made possible by the resources provided by NIH Shared Instrumentation Grants S10-RR023401, S10-RR023043, and S10-RR019371.References
[1] Gagnon et. al., Journal of Neuroscience, 35(8):3663–3675, 2015
[2] Baez-Yanez et al. , NeuroImage, 163:13-23, 2017
[3] Zaretskaya et al., NeuroImage, 165:11-26, 2017
[4] Polimeni et al., NeuoImage 2017 (in press), PMID:28461062
[5] Hirsch et al., Journal of Cerebral Flow and Metabolism, 32:952-967, 2012
Figures