0391
Columnar processing of acoustic features in human auditory cortexMichelle Moerel1,2, Federico De Martino2,3, Kamil Ugurbil3, Elia Formisano1,2, and Essa Yacoub3
1Maastricht Centre for Systems Biology, Maastricht University, Maastricht, Netherlands, 2Faculty of Psychology and Neuroscience, Maastricht University, Maastricht, Netherlands, 3Center for Magnetic Resonance Research, University of Minnesota, Minneapolis, MN, United States
Synopsis
Using ultra-high field fMRI, we explored the cortical depth dependent stability of acoustic feature preference in human auditory cortex. In accordance with results from invasive recordings in cat auditory cortex, we observed a relatively stable (i.e., columnar) tuning to frequency and temporal modulations, while spectral modulation tuning was less stable throughout the cortical depth. This could represent simpler spectral tuning in middle auditory cortical layers, compared to more complex spectral tuning superficially. Furthermore, results suggest a coding strategy in which tuning to some features is kept stable orthogonal to the cortex, while tuning to other features systematically varies.
Introduction
In the auditory cortex, neural population preference to acoustic features varies orderly throughout the cortical sheet, however, invasive recordings in cat auditory cortex showed relatively stable (i.e., columnar) tuning to acoustic features orthogonal to the cortical sheet1. Using the sensitivity and specificity of ultra-high field fMRI, columnar processing in visual cortex has been successfully explored, showing a columnar organization of ocular dominance2 and orientation tuning in V13, color- and disparity-selectivity in V2/V34, and direction of motion selectivity in V5/hMT5. In a subset of primary auditory cortex (PAC), we recently observed columnar tuning to frequency6. Here, we build on this previous work by exploring the cortical depth dependent stability of acoustic features beyond frequency.Methods
Measurements were performed at 7T (Siemens) using a custom whole head 32 channel loop transceiver and a high performance head gradient insert. In six subjects, we acquired high-resolution anatomical data (T1, T2*, and proton density [PD] weighted data; 0.6 mm isotropic) used for segmentation7, cortical layer sampling8, and myelin-based definition of PAC9. Additionally, 0.8 mm isotropic 3D GRASE10 (TE = 27.9 ms; slices = 16; TR = 2000 ms; TA = 330 ms) images were acquired while the subjects listened to 144 natural sounds. Maps of preferred frequency, temporal modulation rate, and spectral modulation scale were computed with an encoding approach11-12. Following previous work6, the stability of feature preference (i.e., columnarity) was assessed as the gradient of preference along vs. orthogonal to the cortical sheet. We assessed significance of this columnarity index by permuting (N = 1,000) the feature maps while preserving the 3D smoothness, and setting the threshold at those values that occurred less than 5% of the time in the permuted maps (p = 0.05, multiple comparison correction with a permutation-based cluster threshold). We compared the columnarity across feature maps by computing the average columnarity in PAC and non-PAC per map. Differences across features and regions were tested for significance using a two-way repeated measures ANOVA with factors ‘Feature’ [frequency, rate, scale] x ‘Region’ [PAC, non-PAC], followed by paired t-tests. Map smoothness along the cortical sheet was assessed on the deepest cortical depth. For each gridpoint, we binned the Euclidean Distance to all other gridpoints at 0.3 mm intervals, and recorded the average feature preference of each bin. Across gridpoints, but per bin, we computed the correlation between the feature preference of the original gridpoints and those of the surrounding neighborhood.Results
Large-scale feature maps were in accordance with previous results12 (Figure 1). Throughout the cortical depth, regions with relatively stable and variable preference could be observed (Figure 2). For each feature and hemisphere, we observed significantly columnar regions and regions where preference varied throughout the cortical depth (Figure 3A). Significantly columnar regions did not overlap perfectly across features (Figure 3B). Only 0.6% of gridpoints were significantly columnar for all three features. A combined columnarity for two out of three features was slightly more common (8.6% of gridpoints), while the majority of gridpoints were either significantly columnar for one or none of the features (32.1% and 58.6% of the gridpoints, respectively). A repeated measures two-way ANOVA with factors ‘Feature’ [frequency, rate, scale] x ‘Region’ [PAC, non-PAC] showed that the columnarity was different across features (main effect of ‘Feature’; F(2,16) = 4.18, p = 0.023; no significant interaction; Figure 3C) but not regions. Subsequent paired t-tests showed that the temporal rate maps were significantly more columnar than the spectral scale maps (t[8] = 3.34, p (corrected) = 0.031). The frequency maps were more columnar than the spectral scale maps as well, but this difference did not reach statistical significance (t[8] = 2.60; p (corrected) = 0.095). Map smoothness was comparable across feature maps (Figure 4).Discussion
We observed columnar regions in all feature maps, with stronger columnarity for maps of temporal modulation rate than spectral modulation scale. This difference in columnarity could not be explained by a difference in map smoothness (variance along the cortical sheet), as smoothness was relatively similar across feature maps. Our results are in accordance with invasive recordings from cat auditory cortex where a transformation in spectral modulation tuning throughout the cortical depth was observed1, and could represent simpler spectral tuning in middle auditory cortical layers compared to more complex spectral tuning superficially. Finally, the lack of overlap of columnar maps across acoustic features suggests a coding strategy in which tuning to some features is kept stable orthogonal to the cortex, while tuning to other features systematically varies.Acknowledgements
This work was supported by the Netherlands Organization for Scientific Research (NWO; Rubicon grant 446-12-010; VENI grant 451-15-012), the National Institutes of Health (NIH grants P41 EB015894, P30 NS076408, and S10 RR026783), and the WM KECK Foundation. This research has been made possible with the support of the Dutch Province of Limburg.References
- Atencio CA, Schreiner CE. Laminar diversity of dynamic sound processing in cat primary auditory cortex. J. Neurophysiol. 2010; 103: 192-205.
- Yacoub E, Shmuel A, Logothetis, N, et al. Robust detection of ocular dominance columns in humans using Hahn Spin Echo BOLD functional MRI at 7 Tesla. Neuroimage 2007; 37: 1161-1177.
- Yacoub E, Harel N, Ugurbil K. High-field fMRI unveils orientation columns in humans. Proc. Natl. Acad. Sci. U. S. A. 2008; 105: 10607-10612.
- Nasr S, Polimeni JR, Tootell RB. Interdigitated color- and disparity-selective columns within human visual cortical Areas V2 and V3. J. Neurosci. 2016; 36: 1841-1857.
- Zimmermann J, Goebel R, De Martino F, et al. Mapping the organization of axis of motion selective features in human area MT using high-field fMRI. PLoS One 2011; 6: e28716.
- De Martino F, Moerel M, Ugurbil K, et al. Frequency preference and attention effects across cortical depths in the human primary auditory cortex. Proc. Natl. Acad. Sci. U. S. A. 2015; 112: 1606-16041.
- Van de Moortele PF, Auerbach EJ, Olman C, et al. T1 weighted brain images at 7 Tesla unbiased for Proton Density, T2* contrast and RF coil receive B1 sensitivity with simultaneous vessel visualization. Neuroimage 2009; 46: 432–446.
- De Martino F, Zimmermann J, Muckli L, et al. Cortical depth dependent functional responses in humans at 7T: improved specificity with 3D GRASE. PLoS One 2013; 8: e60514.
- De Martino F, Moerel M, Xu J, et al. High-resolution mapping of myeloarchitecture in vivo: localization of auditory areas in the human brain. Cereb. Cortex 2015; 25: 3394–3405.
- Oshio K., Feinberg DA. GRASE (Gradient- and spin-echo) imaging: a novel fast MRI technique. Magn. Reson. Med. 1991; 20: 344–349.
- Kay KN, Naselaris T, Prenger RJ, et al. Identifying natural images from human brain activity. Nature 2008; 452: 352–355.
- Santoro R, Moerel M, De Martino F, et al. Encoding of natural ssounds at multiple spectral and temporal resolutions in the human auditory cortex. PLoS Comput. Biol. 2014; 10: e1003412.
Figures
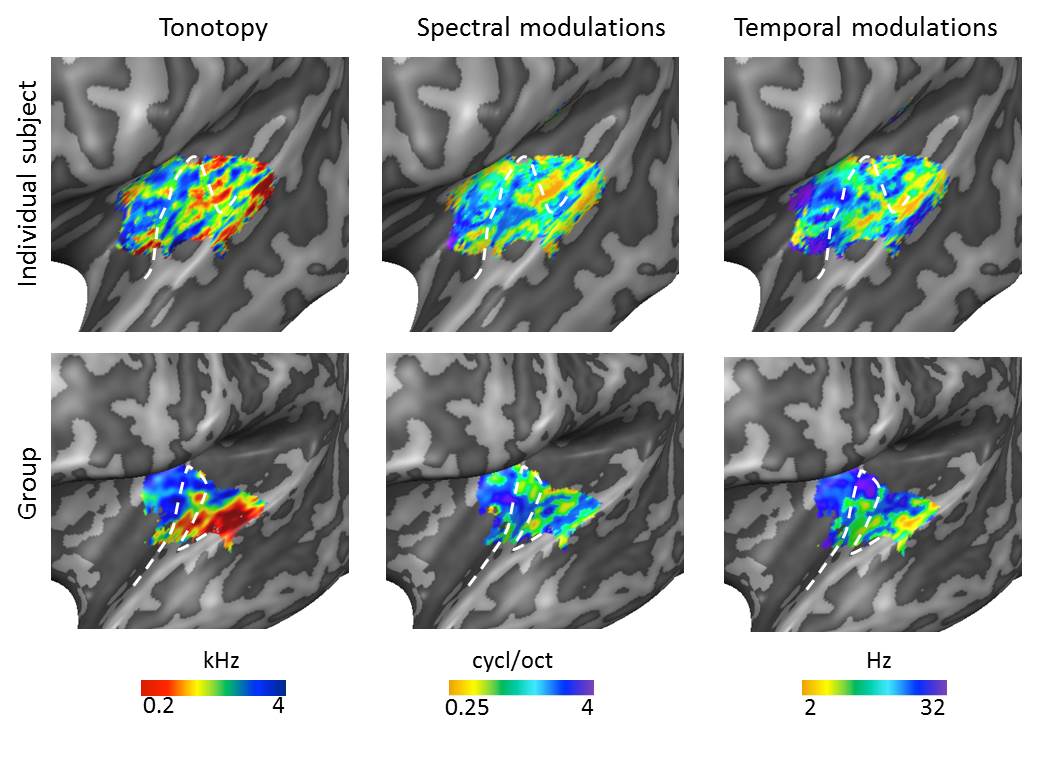
Figure 1. Large-scale
feature maps in an individual and at group level. Tonotopic maps showed
a region of low frequency preference on Heschl’s gyrus (HG), surrounded
anteriorly and posteriorly by regions preferring higher frequencies. An
additional low frequency cluster was located on the middle superior temporal
gyrus (STG). In line with previous findings12, the temporal
modulation rate maps and spectral modulation scale maps were negatively
correlated. Along HG, we observed tuning to high spectral modulation scales and
low temporal modulation rates. The white dashed lines display the location of
HG.
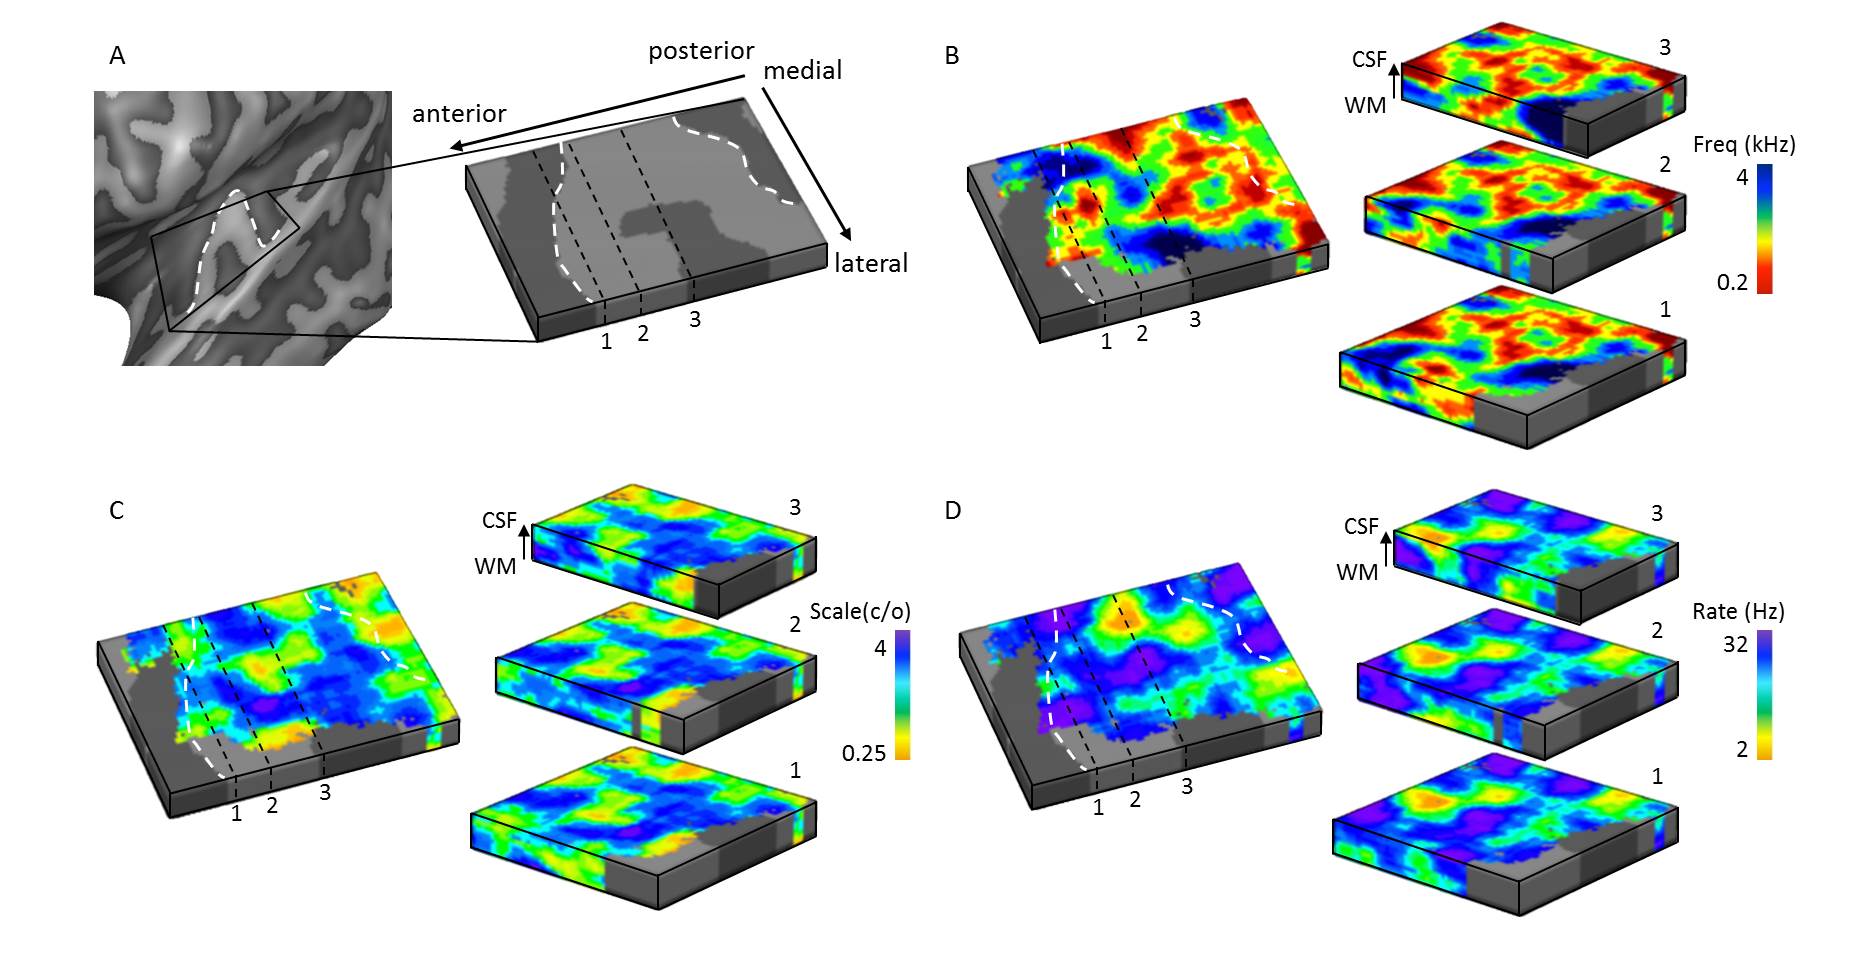
Figure 2. Cortical
depth dependent maps in an individual. (A) Acoustic feature maps were sampled on
cortical depth dependent grids, allowing visualization of these maps throughout
cortical depth. In maps of (B) frequency preference (tonotopy), (C) spectral
modulation scale, and (D) temporal modulation rate, both stable and variable feature
preference throughout cortical depth could be observed. The white dashed lines
display the location of HG.
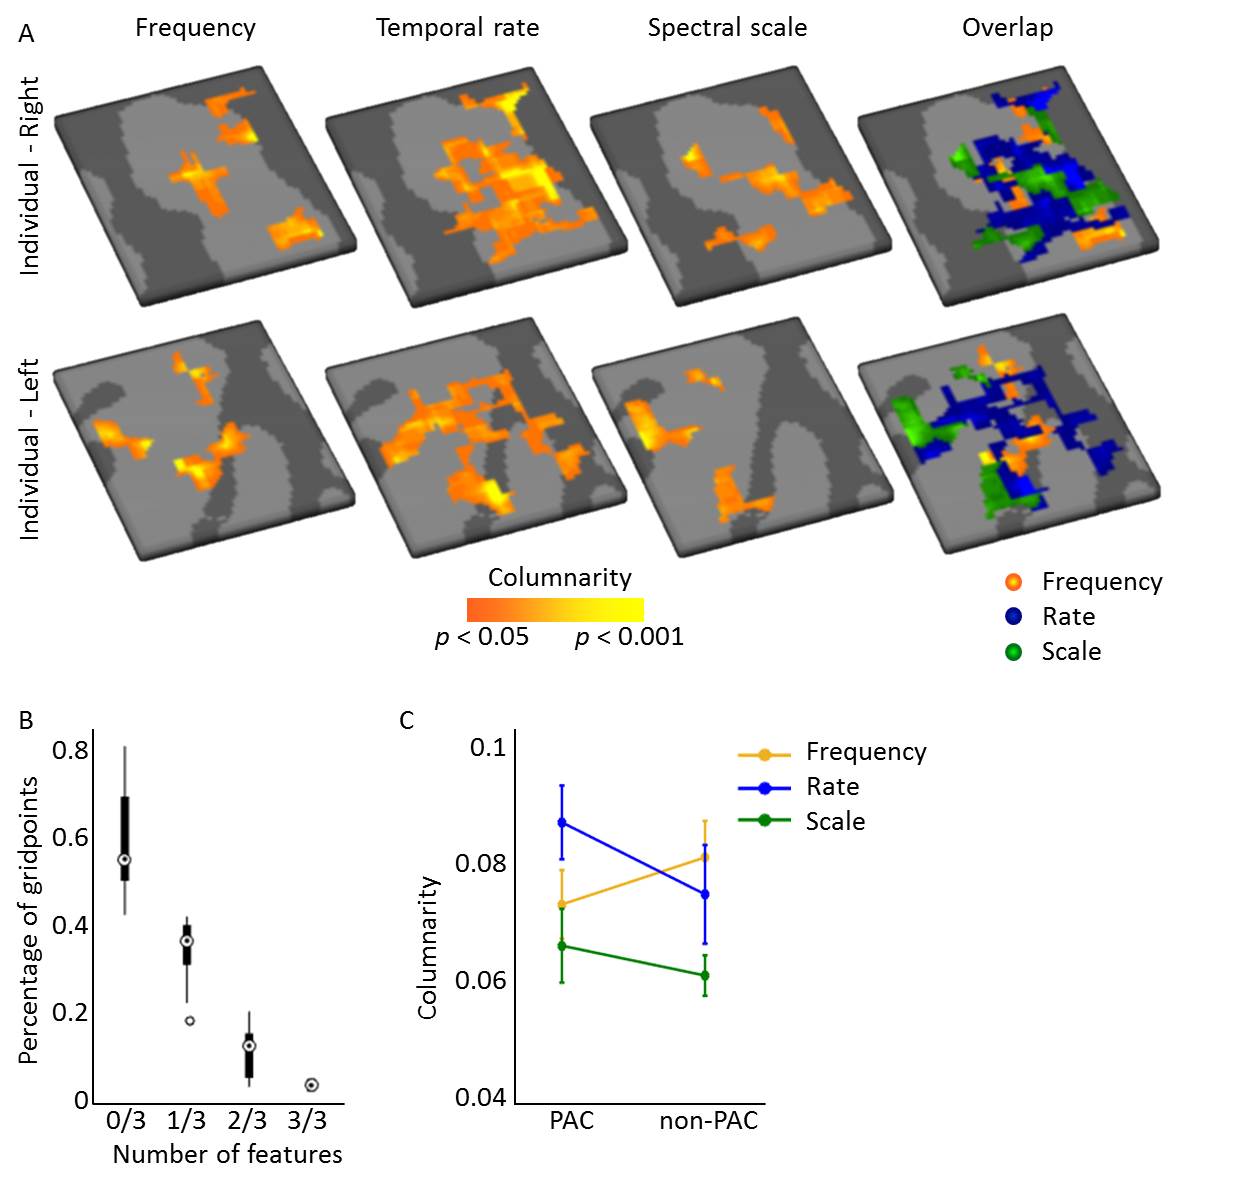
Figure 3. Columnarity
across acoustic feature maps. (A) Columnar regions were observed for maps
of preferred frequency (tonotopy), temporal modulation rate, and spectral
modulation scale. (B) Less than 1% of gridpoints was assigned as columnar for
all three features, showing that these columnar regions did not overlap
perfectly across features. (C) Columnarity did not differ between PAC and
non-PAC. Frequency and temporal rate maps maps were more columnar than the
spectral scale maps. The difference in columnarity between temporal and
spectral modulation maps was statistically significant.
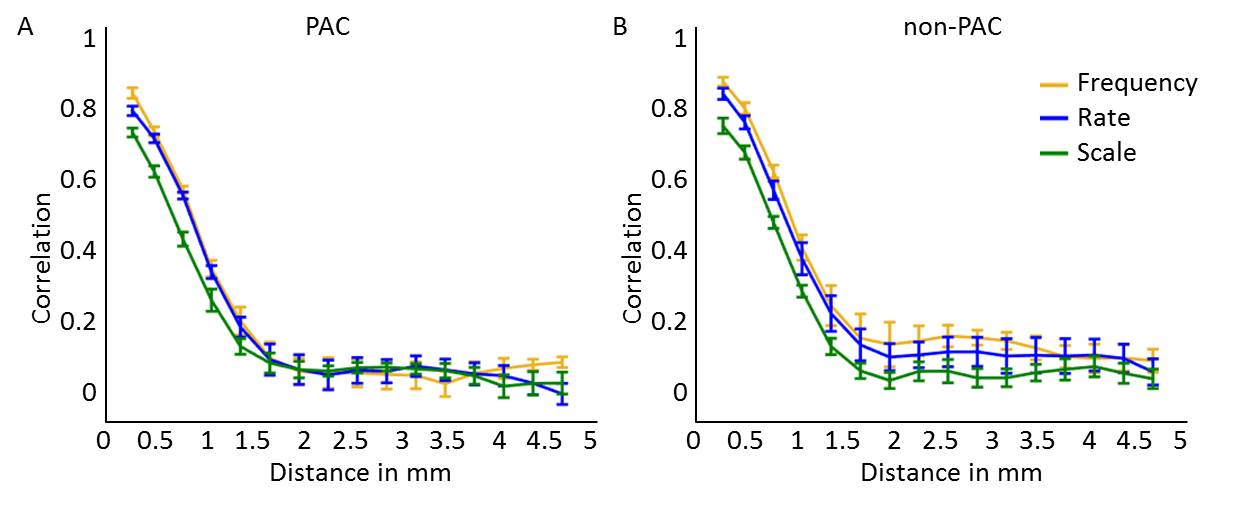
Figure 4. Smoothness
of feature maps along the cortical sheet. Graphs reflect the correlation between
feature preference in deep cortical depths across various distances, in (A) PAC
and (B) non-PAC. Higher and lower correlation across cortical distance
reflects more and less smooth feature maps, respectively. Map smoothness was
comparable across maps of frequency (tonotopy), temporal modulation rate, and
spectral modulation scale.