0390
Improved spatial specificity of the early positive BOLD response observed with high-resolution fMRI at 3T1Athinoula A. Martinos Center for Biomedical Imaging, Massachusetts General Hospital, Charlestown, MA, United States, 2Department of Radiology, Harvard Medical School, Boston, MA, United States, 3Harvard-MIT Division of Health Sciences and Technology, Massachusetts Institute of Technology, Cambridge, MA, United States
Synopsis
Previous studies have demonstrated improved spatial specificity of conventional BOLD fMRI when restricting the analysis to the initial dip, however recent evidence suggests that it may be possible to achieve high specificity by restricting the analysis to the early phase of the response. Here we tested this concept by employing a spatial resolution test pattern in the visual cortex and observed the evolution of this pattern over time in signal subjects. We find that the spatial pattern of the early stages of the BOLD response appear to exhibit improved spatial specificity.
Introduction
Previous studies have demonstrated improved spatial specificity of conventional BOLD fMRI when restricting the analysis to the initial dip (1), however the initial dip can be challenging to detect reliably (2) and may only appear in certain cortical depths (3,4). Recent evidence points to a spatiotemporal evolution of the positive BOLD response (5,6), suggesting that it may be possible to achieve high specificity by restricting the analysis to the early phase of the response whether or not a dip is observable. Here we tested this concept by employing a spatial resolution test pattern in the visual cortex and observed the evolution of this pattern over time in signal subjects. We found that the spatial pattern of the early stages of the BOLD response more closely resemble the pattern observed when spatially restricted to parenchymal voxels avoiding the microvasculature.Methods
Three neurologically healthy female volunteers (29±11yo) were imaged on a whole-body 3T scanner (Siemens Healthineers, Erlangen, Germany) using 3D gradient-echo EPI BOLD fMRI protocol with isotropic spatial resolution 1.0 mm (see Table 1 for acquisition parameters). During each of 15 runs, subjects performed a visual event-related task consisting of two contrasting conditions (A and B) designed to activate a target ‘diamond’ figure on the surface of V1 according to the visuotopic mapping model, as presented in Figure 1, similar to the one previously published by Polimeni et al. (7). Each run consisted of total 3 repeats of two interleaved conditions presented as 8s long blocks with random intervals ranging from 14 to 22s. Same-session 1.0 mm isotropic FOCI-MEMPRAGE data (8,9) were acquired (Table 1) for cortical surface reconstruction using Freesurfer. A surface-based cortical depth analysis was applied as previously described [8]. GLM analyses were performed for each of 15 non-smoothed fMRI datasets using feat (FSL) (10). The dynamic statistical parameter maps (dSPM) were computed voxel-wise, separately for each of two conditions, combining all three task-blocks within each run and estimating signal values with 0.1 s resolution with linear interpolation. Subsequently, dSPM maps were averaged across 15 runs, and maps corresponding to the difference between two conditions (A-B) were calculated and projected onto the cortical surfaces corresponding to the cortical depths between white matter (WM, 0%) and pial surface (100%). The fMRI activity between 9.5 s before the stimulus onset and 22 s after the stimulus onset was calculated for each subject by applying a Finite Impulse Response (FIR) model to the measured BOLD signal using Freesurfer.Results
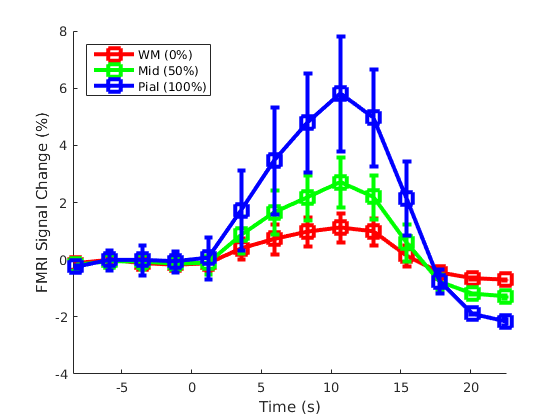
Figure 2 presents the BOLD activation changes across the cortical depths, from WM (0%) to the pial surface (100%) 10 s after the stimulus onset. Figure 3 shows changes of the BOLD activation at cortical mid-depth (50%) over time, from the stimulus onset until 22 s after. The BOLD fMRI activity between 9.5 s before the stimulus onset and 22 s after the stimulus onset plotted for WM (0%), mid-depth (50%) and pial surface (100%) calculated applying a Finite Impulse Response (FIR) model, is plotted in Figure 4 for the example subjectDiscussion
These results demonstrate the spatial spreading of the BOLD fMRI activation pattern with time, in line with the hypothesis that the early stages of the BOLD response have improved spatial specificity, albeit with lower sensitivity. The earliest time points resemble the spatial pattern of activation when sampling within the cortex away from the surface macrovasculature. This suggests that higher temporal resolution may provide an alternate strategy for microvascular weighting and improved localization of neuronal activity.Acknowledgements
This work was supported in part by the NIH NIBIB (grants P41-EB015896, and R01-EB019437), by the BRAIN Initiative (NIH NIMH grant R01-MH111419 and R01-MH111438), and by the MGH/HST Athinoula A. Martinos Center for Biomedical Imaging; and was made possible by the resources provided by NIH Shared Instrumentation Grants S10-RR023401 and S10-RR023043.References
1. Duong TQ, Kim D, Kim S. Spatiotemporal Dynamics of the BOLD fMRI Signals : Toward Mapping Submillimeter Cortical Columns Using the Early Negative Response. 2000;242:231–242.
2. Buxton RB. The Elusive Initial Dip. 2001;958:953–958.
3. Siero JCW, Hendrikse J, Hoogduin H, Petridou N, Luijten P, Donahue MJ. Cortical depth dependence of the BOLD initial dip and poststimulus undershoot in human visual cortex at 7 Tesla. Magn. Reson. Med. 2015;73:2283–2295.
4. Tian P, Teng IC, May LD, et al. Cortical depth-specific microvascular dilation underlies laminar differences in blood oxygenation level-dependent functional MRI signal. Proc. Natl. Acad. Sci. 2010;107:15246–15251.
5. Chen BR, Bouchard MB, McCaslin AFH, Burgess SA, Hillman EMC. High-speed vascular dynamics of the hemodynamic response. NeuroImage 2011;54:1021–1030. doi: 10.1016/j.neuroimage.2010.09.036.
6. Yu X, Glen D, Wang S, Dodd S, Hirano Y, Saad Z, Reynolds R, Silva AC, Koretsky AP. Direct imaging of macrovascular and microvascular contributions to BOLD fMRI in layers IV-V of the rat whisker-barrel cortex. NeuroImage 2012;59:1451–1460.
7. Polimeni JR, Fischl B, Greve DN, Wald LL. Laminar analysis of 7T BOLD using an imposed spatial activation pattern in human V1. NeuroImage 2010;52:1334–1346.
8. Hurley AC, Al-Radaideh A, Bai L, Aickelin U, Coxon R, Glover P, Gowland P a. Tailored RF pulse for magnetization inversion at ultrahigh field. Magn. Reson. Med. 2010;63:51–8.
9. van der Kouwe AJW, Benner T, Salat D, Fischl B. Brain Morphometry with Multiecho MPRAGE. NeuroImage 2008;40:559–569. .
10. Woolrich MW, Ripley BD, Brady M, Smith SM. Temporal Autocorrelation in Univariate Linear Modeling of FMRI Data. NeuroImage 2001;14:1370–1386.
Figures
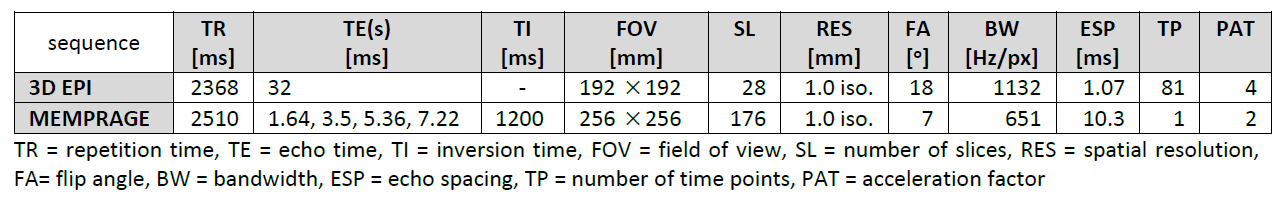
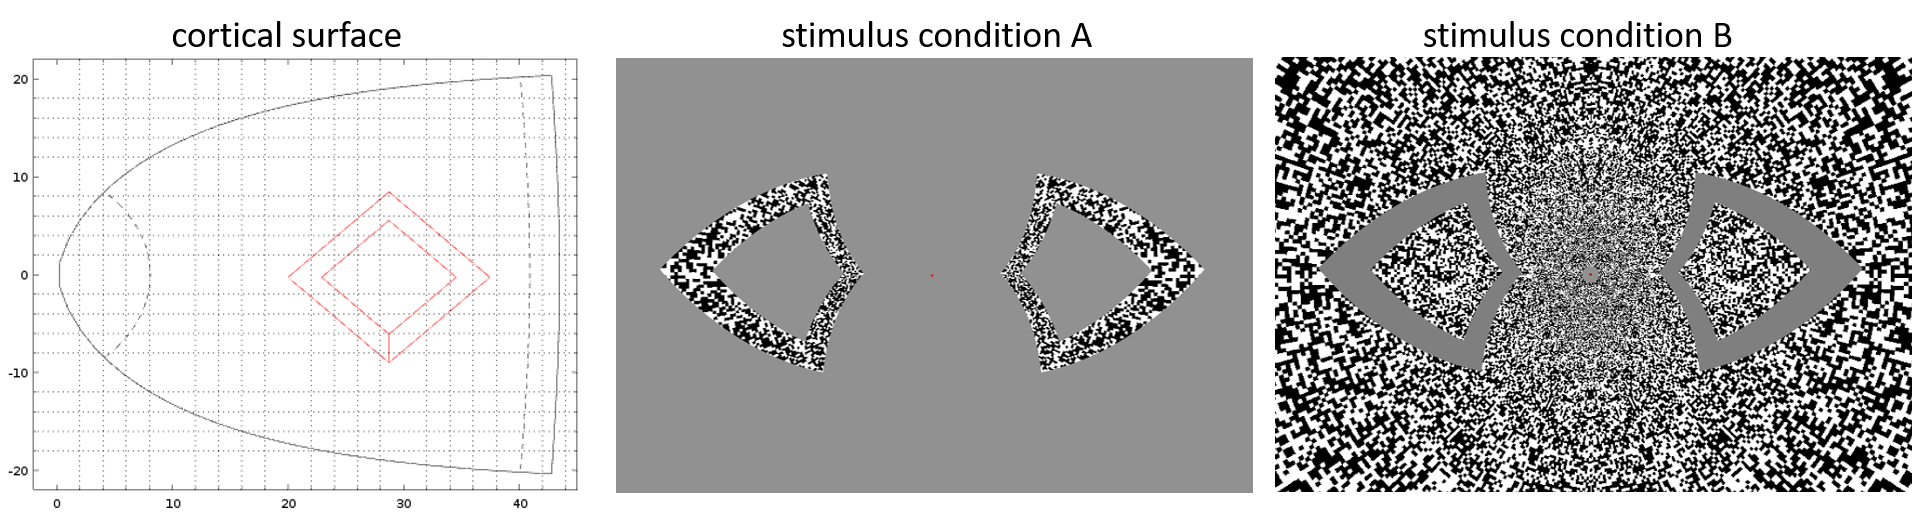
Figure 3. Animation of the BOLD activation at cortical mid-depth (50%) over time, from the stimulus onset until 22 s after, for the example subject.