0389
Cortical depth dependent resting state fMRI with motion correction1Dept. of Radiology, Medical Physics, Medical Center University of Freiburg, Faculty of Medicine, Freiburg, Germany, 2Institute of Biomedical Engineering, National Taiwan University, Taipei, Taiwan, 3Department of Neuroscience and Biomedical Engineering, Aalto University, Espoo, Finland
Synopsis
We used
Introduction
Resting-state fMRI 1 explores brain areas showing synchronized activity. One set of such orchestrated brain regions include the posterior cingulate cortex (PCC), medial pre-frontal cortex (mPFC), hippocampus, and lateral parietal (LP) lobes 2. This resting-state network has been named as the “default mode” network (DMN) 3-5. As fMRI monitors neuronal activity indirectly, any measurement and physiological confounds, such as motion and vascular reactivity, can affect the characterization of DMN One way to mitigate this challenge is the characterization of hemodynamic responses across cortical depths in the human brain6. Specifically, examining BOLD signal with a small voxel in the range of 1 µL can improve functional specificity by alleviating the vascular bias caused by draining veins coursing along the pial surface 6,7, reducing partial volume effects 8,9, and suppressing physiological noise 10. The other approach is to use prospective motion correction 11 to dynamically change the excitation and reception of BOLD signal when involuntary motion occurs.
Here we characterized the DMN across cortical depths with the state-of-the-art motion tracking. We hypothesize that the DMN characterized by data from intermediate and superficial cortical depths because of the coursing venal vasculature. Prospective motion correction can further improve the detection sensitivity during the measurements of several minutes.
Method
Six 10-minute functional scans were collected from a 3T scanner (Prisma, Siemens). Three runs were acquired with and without prospective correction (MOCO), respectively12. The EPI sequence with 3x GRAPPA (TE=38 ms, TR=3410 ms, flip angle=90°, resolution=1 mm isotropic, and 40 slices) was integrated with an in-bore optical tracking system. The tracking marker was fixed to the subject using a mouthpiece to record the involuntary subject motion of the head. T1-weighted structural images (MPRAGE: TR= 2300 ms, TE= 2.32 ms, resolution=0.9x0.9x0.9mm3) were acquired to generate triangulated mesh surfaces of gray-white matter boundary, gray-pial surface boundary, and nine cortical depths with equally spaced cortical thickness using FreeSurfer 6,13,14. A gray-white matter boundary-based registration method implemented in FreeSurfer was used to form the rigid transformation between the functional and the anatomical data. Using this registration file, individual’s functional time-series volumes were projected to nine intermediate cortical surfaces by the nearest-neighbor interpolation method after correction motion using SPM12 (http://www.fil.ion.ucl.ac.uk/spm/).
DMN was identified by the seed-based correlation method 15. We separately calculated correlation maps with seeds at the PCC (Brodmann Area 10) 16,17 using data with and without MOCO. Correlation coefficients maps were transformed to Z-statistic maps.
Result
Reduced image translation and rotations were observed with MOCO. Specifically, the x, y, and z translation estimated by motion correction were 0.05±33.4 μm, -235±749 μm, and 17.2±57.7 μm for sessions with MOCO and 90.3±66.2 μm, -169.9±58.7 μm, -24±132.4 μm for sessions without MOCO, respectively. The pitch, roll, and yaw rotation were 0.017°±0.04°, -0.013°±0.02°, and -0.006°±0.016° for sessions with MOCO, and 0.017°±0.088°, -0.13°±0.11°, and -0.07°±0.05° for sessions without MOCO session, respectively.
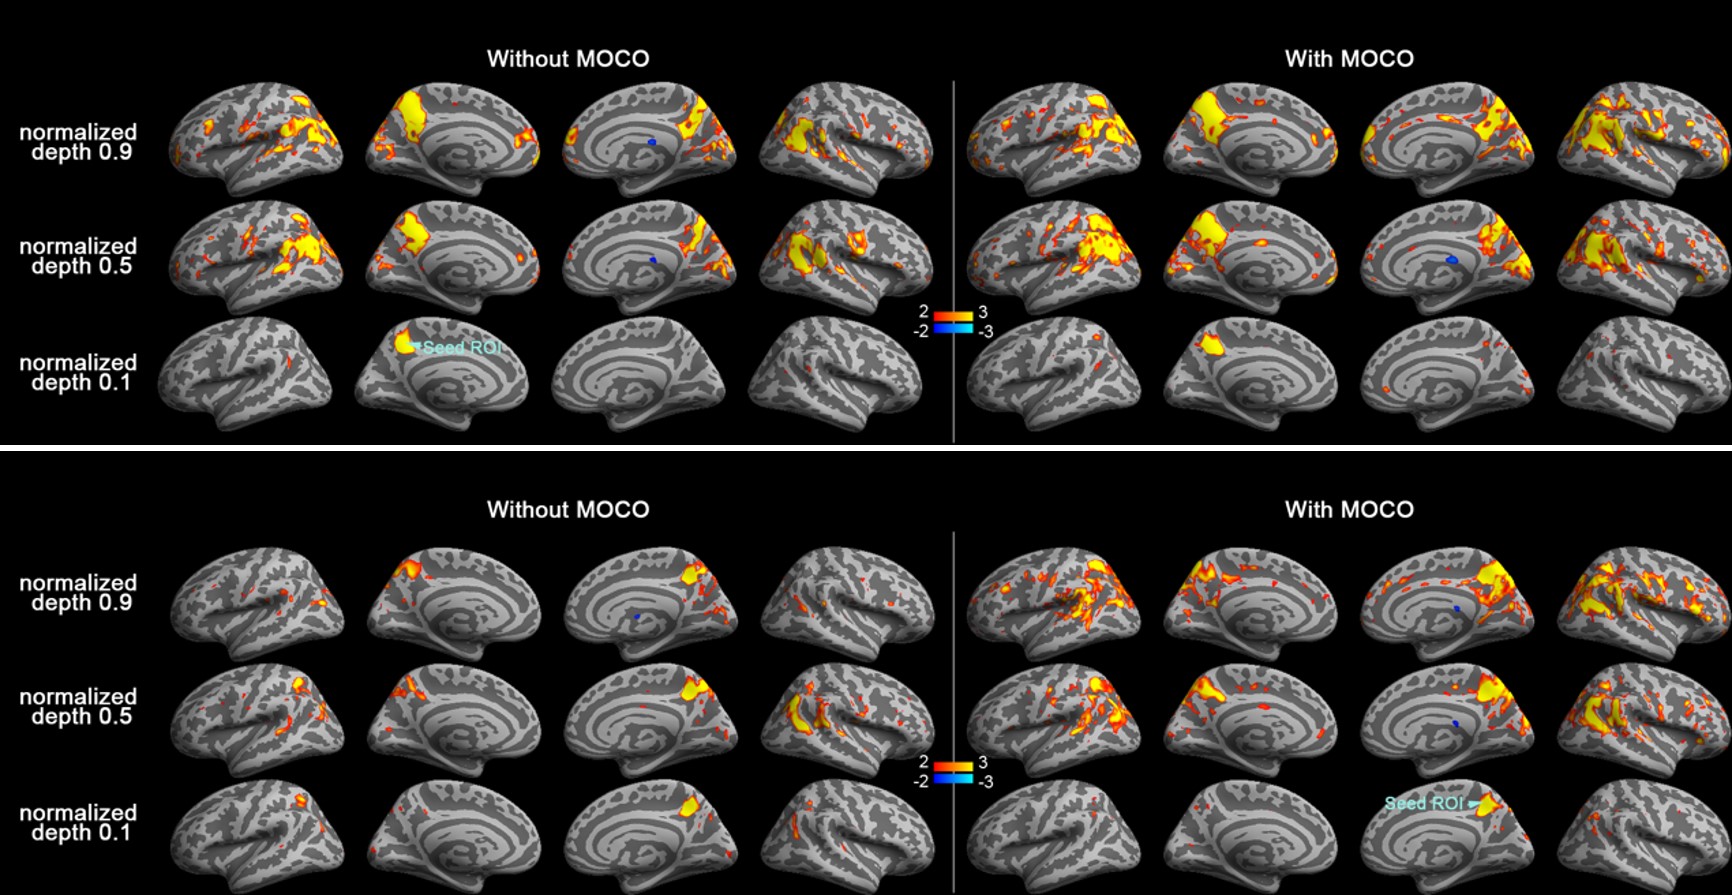
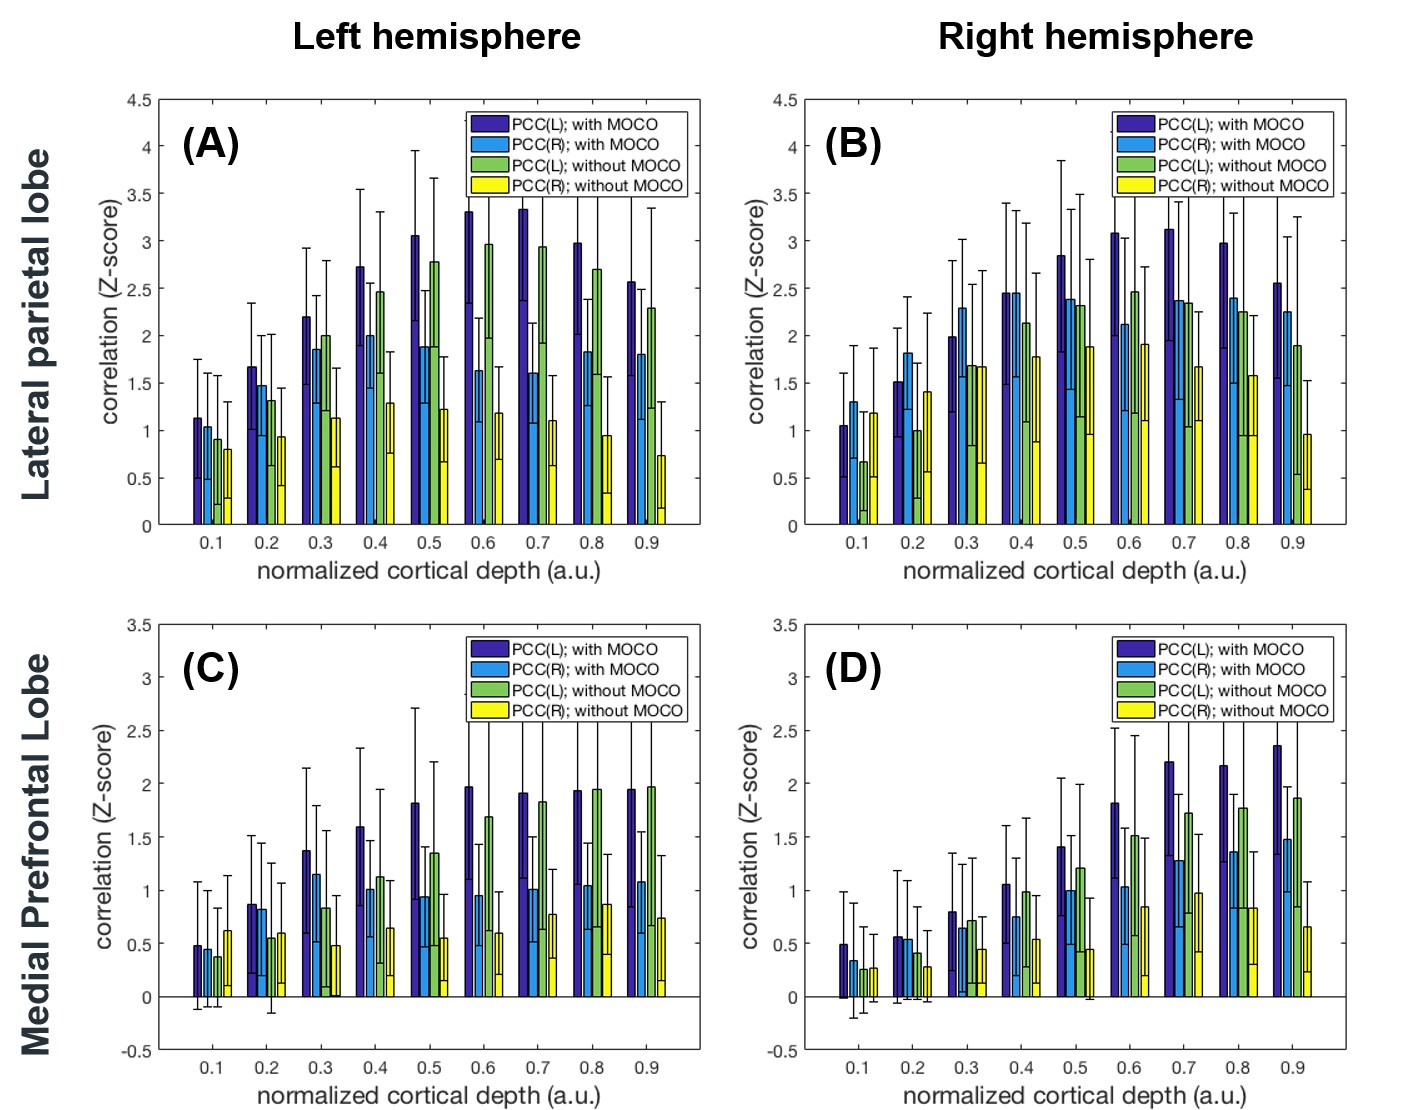
Figure 1 shows maps of the statistical significance of correlation in Z-scores with the seed ROI at left and right PCC at 0.1 (closer to the white matter), 0.5, and 0.9 (closer to the pial surface) normalized depth (n.d.). Minimal parietal lobe areas of the DMN were identified at 0.1 n.d., while more correlated BOLD signals were found at intermediate and superficial depths. Comparing to results without MOCO, DMN derived from data with MOCO had involved broader areas and with more significant correlation. More significantly correlated BOLD signals at intermediate and superficial layers (n.d. >= 0.6) at LP and mPFC were observed with seed ROI at left and right PCC (Figure 2). At intermediate depths (n.d. = 0.6 and 0.7), the Z-score was about 3 to 5 times higher than that at deep depth (n.d.= 0.1) and about 20% higher than that at superficial depth (n.d.=0.9). Data with MOCO consistently suggested more significant correction to the seed ROI (Figure 2)
Discussion
While cortical depth depending fMRI has been studied in the human visual 18-25 and auditory cortex 7,26,27, to the best of our knowledge, it has not been used to study resting state fMRI. Our results suggested that more sensitive detection of DMN can be achieved at intermediate and superficial cortical depths. Prospective motion correction is also useful to improve the sensitivity. However, in the group analysis, we expect that the DMN identified from data at intermediate cortical depths can be more reliable, because the superficial vasculature varies across subjects. Further study on different subject’s positions, multiple subjects, and the contrast between resting and task conditions, is expected to demonstrate the advantage of improved sensitivity and specificity of characterizing the resting state network using cortical depth dependent analysis and prospective motion correction.Acknowledgements
This work was partially supported by Ministry of Science and Technology, Taiwan (103-2628-B-002-002-MY3, 105-2221-E-002-104, 106-2911-I-002-502), and the Academy of Finland (No. 298131).References
1. Gusnard, D. A. & Raichle, M. E. Searching for a baseline: functional imaging and the resting human brain. Nat Rev Neurosci 2, 685-694, doi:10.1038/35094500 35094500 [pii] (2001).
2. Buckner, R. L., Andrews‐Hanna, J. R. & Schacter, D. L. The brain's default network. Annals of the New York Academy of Sciences 1124, 1-38 (2008).
3. Ghatan, P. H. et al. Brain Activation Induced by the Perceptual Maze Test: A PET Study of Cognitive Performance. NeuroImage 2, 112-124, doi:http://dx.doi.org/10.1006/nimg.1995.1014 (1995).
4 . Hutchinson, M. et al. Task-specific deactivation patterns in functional magnetic resonance imaging. Magnetic Resonance Imaging 17, 1427-1436, doi:http://dx.doi.org/10.1016/S0730-725X(99)00093-4 (1999).
5. Gusnard, D. A. & Raichle, M. E. Searching for a baseline: Functional imaging and the resting human brain. Nat Rev Neurosci 2, 685-694 (2001).
6. Polimeni, J. R., Fischl, B., Greve, D. N. & Wald, L. L. Laminar analysis of 7 T BOLD using an imposed spatial activation pattern in human V1. Neuroimage 52, 1334-1346 (2010).
7. Ahveninen, J. et al. Intracortical depth analyses of frequency-sensitive regions of human auditory cortex using 7TfMRI. Neuroimage 143, 116-127, doi:10.1016/j.neuroimage.2016.09.010 (2016).
8. Hoogenraad, F. G. et al. Sub-millimeter fMRI at 1.5 Tesla: correlation of high resolution with low resolution measurements. J Magn Reson Imaging 9, 475-482 (1999).
9. Logothetis, N., Merkle, H., Augath, M., Trinath, T. & Ugurbil, K. Ultra high-resolution fMRI in monkeys with implanted RF coils. Neuron 35, 227-242 (2002).
10. Triantafyllou, C. et al. Comparison of physiological noise at 1.5 T, 3 T and 7 T and optimization of fMRI acquisition parameters. Neuroimage 26, 243-250, doi:10.1016/j.neuroimage.2005.01.007 (2005).
11. Zaitsev, M., Akin, B., Levan, P. & Knowles, B. R. Prospective motion correction in functional MRI. NeuroImage 154, 33-42 (2017).
12. Maclaren, J. et al. Measurement and correction of microscopic head motion during magnetic resonance imaging of the brain. PloS one 7, e48088 (2012).
13. Dale, A. M., Fischl, B. & Sereno, M. I. Cortical surface-based analysis. I. Segmentation and surface reconstruction. Neuroimage 9, 179-194 (1999).
14. Fischl, B., Sereno, M. I. & Dale, A. M. Cortical surface-based analysis. II: Inflation, flattening, and a surface-based coordinate system. Neuroimage 9, 195-207 (1999).
15. Margulies, D. S. et al. Mapping the functional connectivity of anterior cingulate cortex. Neuroimage 37, 579-588 (2007).
16. Gorges, M. et al. Functional Connectivity Within the Default Mode Network Is Associated With Saccadic Accuracy in Parkinson's Disease: A Resting-State fMRI and Videooculographic Study. Brain Connectivity 3, 265-272, doi:10.1089/brain.2013.0146 (2013).
17. Zhang, D. & Raichle, M. E. Disease and the brain's dark energy. Nature reviews. Neurology 6, 15-28, doi:10.1038/nrneurol.2009.198 (2010).
18. Ress, D., Glover, G. H., Liu, J. & Wandelld, B. Laminar profiles of functional activity in the human brain. Neuroimage 34, 74-84 (2007).
19. Koopmans, P. J., Barth, M. & Norris, D. G. Layer-specific BOLD activation in human V1. Hum Brain Mapp 31, 1297-1304 (2010).
20. Olman, C. A. et al. Layer-specific fMRI reflects different neuronal computations at different depths in human V1. PLoS One 7, e32536 (2012).
21. Huber, L. et al. Cortical lamina-dependent blood volume changes in human brain at 7 T. Neuroimage 107, 23-33 (2015).
22. Muckli, L. et al. Contextual feedback to superficial layers of V1. Curr Biol 25, 2690-2695 (2015). 23. Kok, P., Bains, L. J., van Mourik, T., Norris, D. G. & de Lange, F. P. Selective activation of the deep layers of the human primary visual cortex by top-down feedback. Curr Biol 26, 371-376 (2016).
24. Nasr, S., Polimeni, J. R. & Tootell, R. B. Interdigitated color- and disparity-selective columns within human visual cortical areas V2 and V3. J Neurosci 36, 1841-1857 (2016).
25. Scheeringa, R., Koopmans, P. J., van Mourik, T., Jensen, O. & Norris, D. G. The relationship between oscillatory EEG activity and the laminar-specific BOLD signal. Proc Natl Acad Sci USA 113, 6761-6766 (2016).
26. De Martino, F. et al. Frequency preference and attention effects across cortical depths in the human primary auditory cortex. Proc Natl Acad Sci USA 112, 16036-16041 (2015).
27. Moerel, M. et al. Sensitivity and specificity considerations for fMRI encoding, decoding, and mapping of auditory cortex at ultra-high field. Neuroimage pii: S1053-8119, 30284-30287 (2017).
Figures