0388
Functional Mapping of Body Part Representations across Layers and Columns in Humans1SFIM, NIMH, Bethesda, MD, United States, 2University of Glasgow, Glasgow, United Kingdom, 3NIMH, Bethesda, MD, United States, 4MBIC, Maastricht, Netherlands
Synopsis
In this work, we seek to characterize the mesoscopic circuitry of the sensorimotor system across layers, columns and brain areas. We use a blood volume and BOLD signal sensitive fMRI methodology during task and rest with 0.78 mm resolution. We find ‘columnar’-dependent connectivity, representing the same body parts (e.g. digits) across different sensory and motor areas. In the hand knob, we find ‘columnar’ networks with a finer spatial scale than the regime of individual digit representations. Layer-dependent differences of task-induced and resting-state fMRI are indicative of different input-output-driven activity.
Purpose
Sensorimotor cortex consists of multiple brain areas, e.g. BA6 (premotor), BA4 (M1), BA3b (part of S1), BA1 (part of S1) areas. The connectivity between sensorimotor areas follows pathways that are uniquely distributed across cortical layers and columns.
This mesoscopic connectivity is in the focus of current research:
- ‘Columnar’ connectivity between BA3b and BA1 was found in monkeys to be specific to individual body parts (digits) [Shi 2017] with fMRI and electrophysiology.
- ‘Laminar’ resting-state fMRI fluctuations in M1 were found to show afferent vs. efferent connectivity in M1 [Huber 2017].
In this study, we seek to characterize both, the columnar and the laminar connectome simultaneously across all brain areas of the human sensorimotor network with ultra-high resolution resting-state blood-volume-sensitive fMRI.
Methods
32-min resting-state experiments were conducted with N=6 participants (approved by the Combined Neuroscience IRB of NIH (Bethesda)). Additionally, for validation of resting-state networks, somatotopic digit-mapping [Panchuelo 2016] was done (12-min block-design task of single-digit button-box presses of pinky and index finger. A slab of 0.4 mm MP2RAGE data (2 averages) was acquired to identify “septa” along the central sulcus [Kuehn 2017], which represent columns of low myelination at the borders between face/hand/trunk areas. Functional data of GE-BOLD and cerebral blood volume (CBV) were simultaneously acquired with SS-SI-VASO [Huber 2014]. fMRI sequence parameters were: in-plane resolution 0.78 mm, slice-thickness: 0.79 mm (N=2) or 1 mm (N=4). TE=32 ms, 24 slices, TR/TI=3.4/1.1 s, no PF, FLASH-GRAPPA=3, 3D-EPI readout [Poser 2010], 7T (Siemens Healthineers), 32-ch. NOVA coil, SC72 body gradient. Columnar and laminar analyses were conducted in EPI-space (Fig. 1) based on T1-weighting in VASO in a 3D-grid of ‘layers’, ‘columns’ and ‘brain areas’, upon manual correction of Freesurfer segmentations. Resting-state network evaluations were conducted with (a) ICA and (b) seed-based analysis:
- (a) MELODIC-ICA (FSL) was repeatedly applied. Upon first ICA decomposition, ICs where manually selected as ‘sensorimotor’ networks. Then, those ICs were used for further ICA-decomposition. ICs where successively decomposed into more and more sub-components (Fig. 2).
-
(b) Resting-state seeds were
placed in BA3b based on the location of tapping induced activation. Time
courses of different seed regions where temporally orthogonalized to account
for global vascular biases. We investigated the connectivity of those seed
regions with layers and columns in other sensory motor areas: BA1, BA4, and BA6
Fig. 5.
Results
The resting-state fMRI analysis method shown here allows single digit representation mapping across layers and columns in multiple areas of the sensorimotor system (Fig. 1-4). Due to the high resolution used here, we could spatially subdivide the sensorimotor network in multiple sub-components. Surprisingly, the sensorimotor network did not subdivide into the different anatomically defined areas (BA1, BA3b, BA4, BA6). But instead, it subdivided into body-part specific networks that span across multiple brain areas (Fig. 2C). We could identify >7 subcomponents within the hand knob in all participants. This means there are more networks than digits (Fig. 2D). Resting-state networks corresponded with activation patterns of taks-generated somatotopic maps (Fig. 3). The layer-dependent activity signatures differed for tapping-induced activity and resting-state networks (Fig. 3-4):
- Resting-state networks showed weaker activity in superficial laminae, presumably due to different input-output connectivity across cortical depths.
- Resting-state activity showed a wider columnar spread in deeper layers compared to superficial layers, in contrast with task-induced signals.
- Single-digit representations in Fig. 4E are further away from each other in BA3b (S1) compared to BA4 (M1), both in resting-state and task-induces data.
Investigating connectivity differences across seed regions reveals features about the directionality of functional connections. E.g. BA3b sends feed-back input in to upper layers of M1, while premotor cortex evokes output activity in deeper layers of M1 (Fig. 5).
Discussion
Reduced ‘columnar’ spread in deeper layers of task results compared to resting-state results might be due to attention related surround inhibition [Smith 2004] during the task. Due to the insensitivity of CBV-fMRI to large draining veins, this effect cannot be attributed to vascular bias. The fact that ICA can extract more than 7 independent components within the primary motor cortex, is not surprising and might be associated with the notion that primary motor cortex does not only contain a topographic map of the body parts, but also an ‘action map’ of motion sequences (in hand area, e.g., finger flexing and pinching) [Graziano 2016].Conclusion
We presented high resolution
task-fMRI and resting-state-fMRI results for the investigation of laminar and
columnar connectivity in the sensorimotor network. We found that the sensorimotor
resting-state network subdivides into independent components that match with
body-part representations up to a spatial scale that is finer than the
single-digit representation.Acknowledgements
We want to thank Esther Kuehn for inspiring discussions on heterogeneity within M1 and S1. We thank Dimo Ivanov for his help to transfer the 3D-EPI readout into the VASO sequence environment. This research is supported by the NIMH Intramural Research Program. We thank Andrew Hall and Kenny Chang for administrative support of human volunteer scanning.References
[Chen 2017] Chen et al., 2017, MRI, 39:71-81, Biophysical and neural basis of resting state functional connectivity: Evidence from non-human primates.
[Graziano 2016] Graziano, 2016, Cell, 20:121-132, Ethological Action Maps: A Paradigm Shift for the Motor Cortex
[Huber 2014] Huber et al., 2014, MRM 72:137-148, Slab-selective, BOLD-corrected VASO at 7 tesla provides measures of cerebral blood volume reactivity with high signal-to-noise ratio.
[Huber 2017] Huber et al., 2017, Neuron, accepted: in print, pii S0896-6273(17)31033-4, High-resolution CBV-fMRI allows mapping of laminar activity and connectivity of cortical input and output in human M1.
[Kuehn 2017] Kuehn et al., 2017, Cerebral Cortex, 27:3790-3805, Body Topography Parcellates Human Sensory and Motor Cortex
[Panchuelo 2016] Panchuelo et al., 2016, eLife, 6:e12812, Mapping quantal touch using 7 tesla functional magnetic resonance imaging and single-unit intraneural microstimulation.
[Poser 2010] Poser et al., 2010, NeuroImage, 51:261-266, Three dimensional echo-planar imaging at 7 tesla
[Shi 2017] Shi et al., 2017, PNAS, 20:5253–5258. High spatial correspondence at a columnar level between activation and resting state fMRI signals and local field potentials
[Smith 2004] Smith et al., 2004, HBM, 21:213-220. Negative BOLD in the visual cortex: Evidence against blood stealing.
Figures
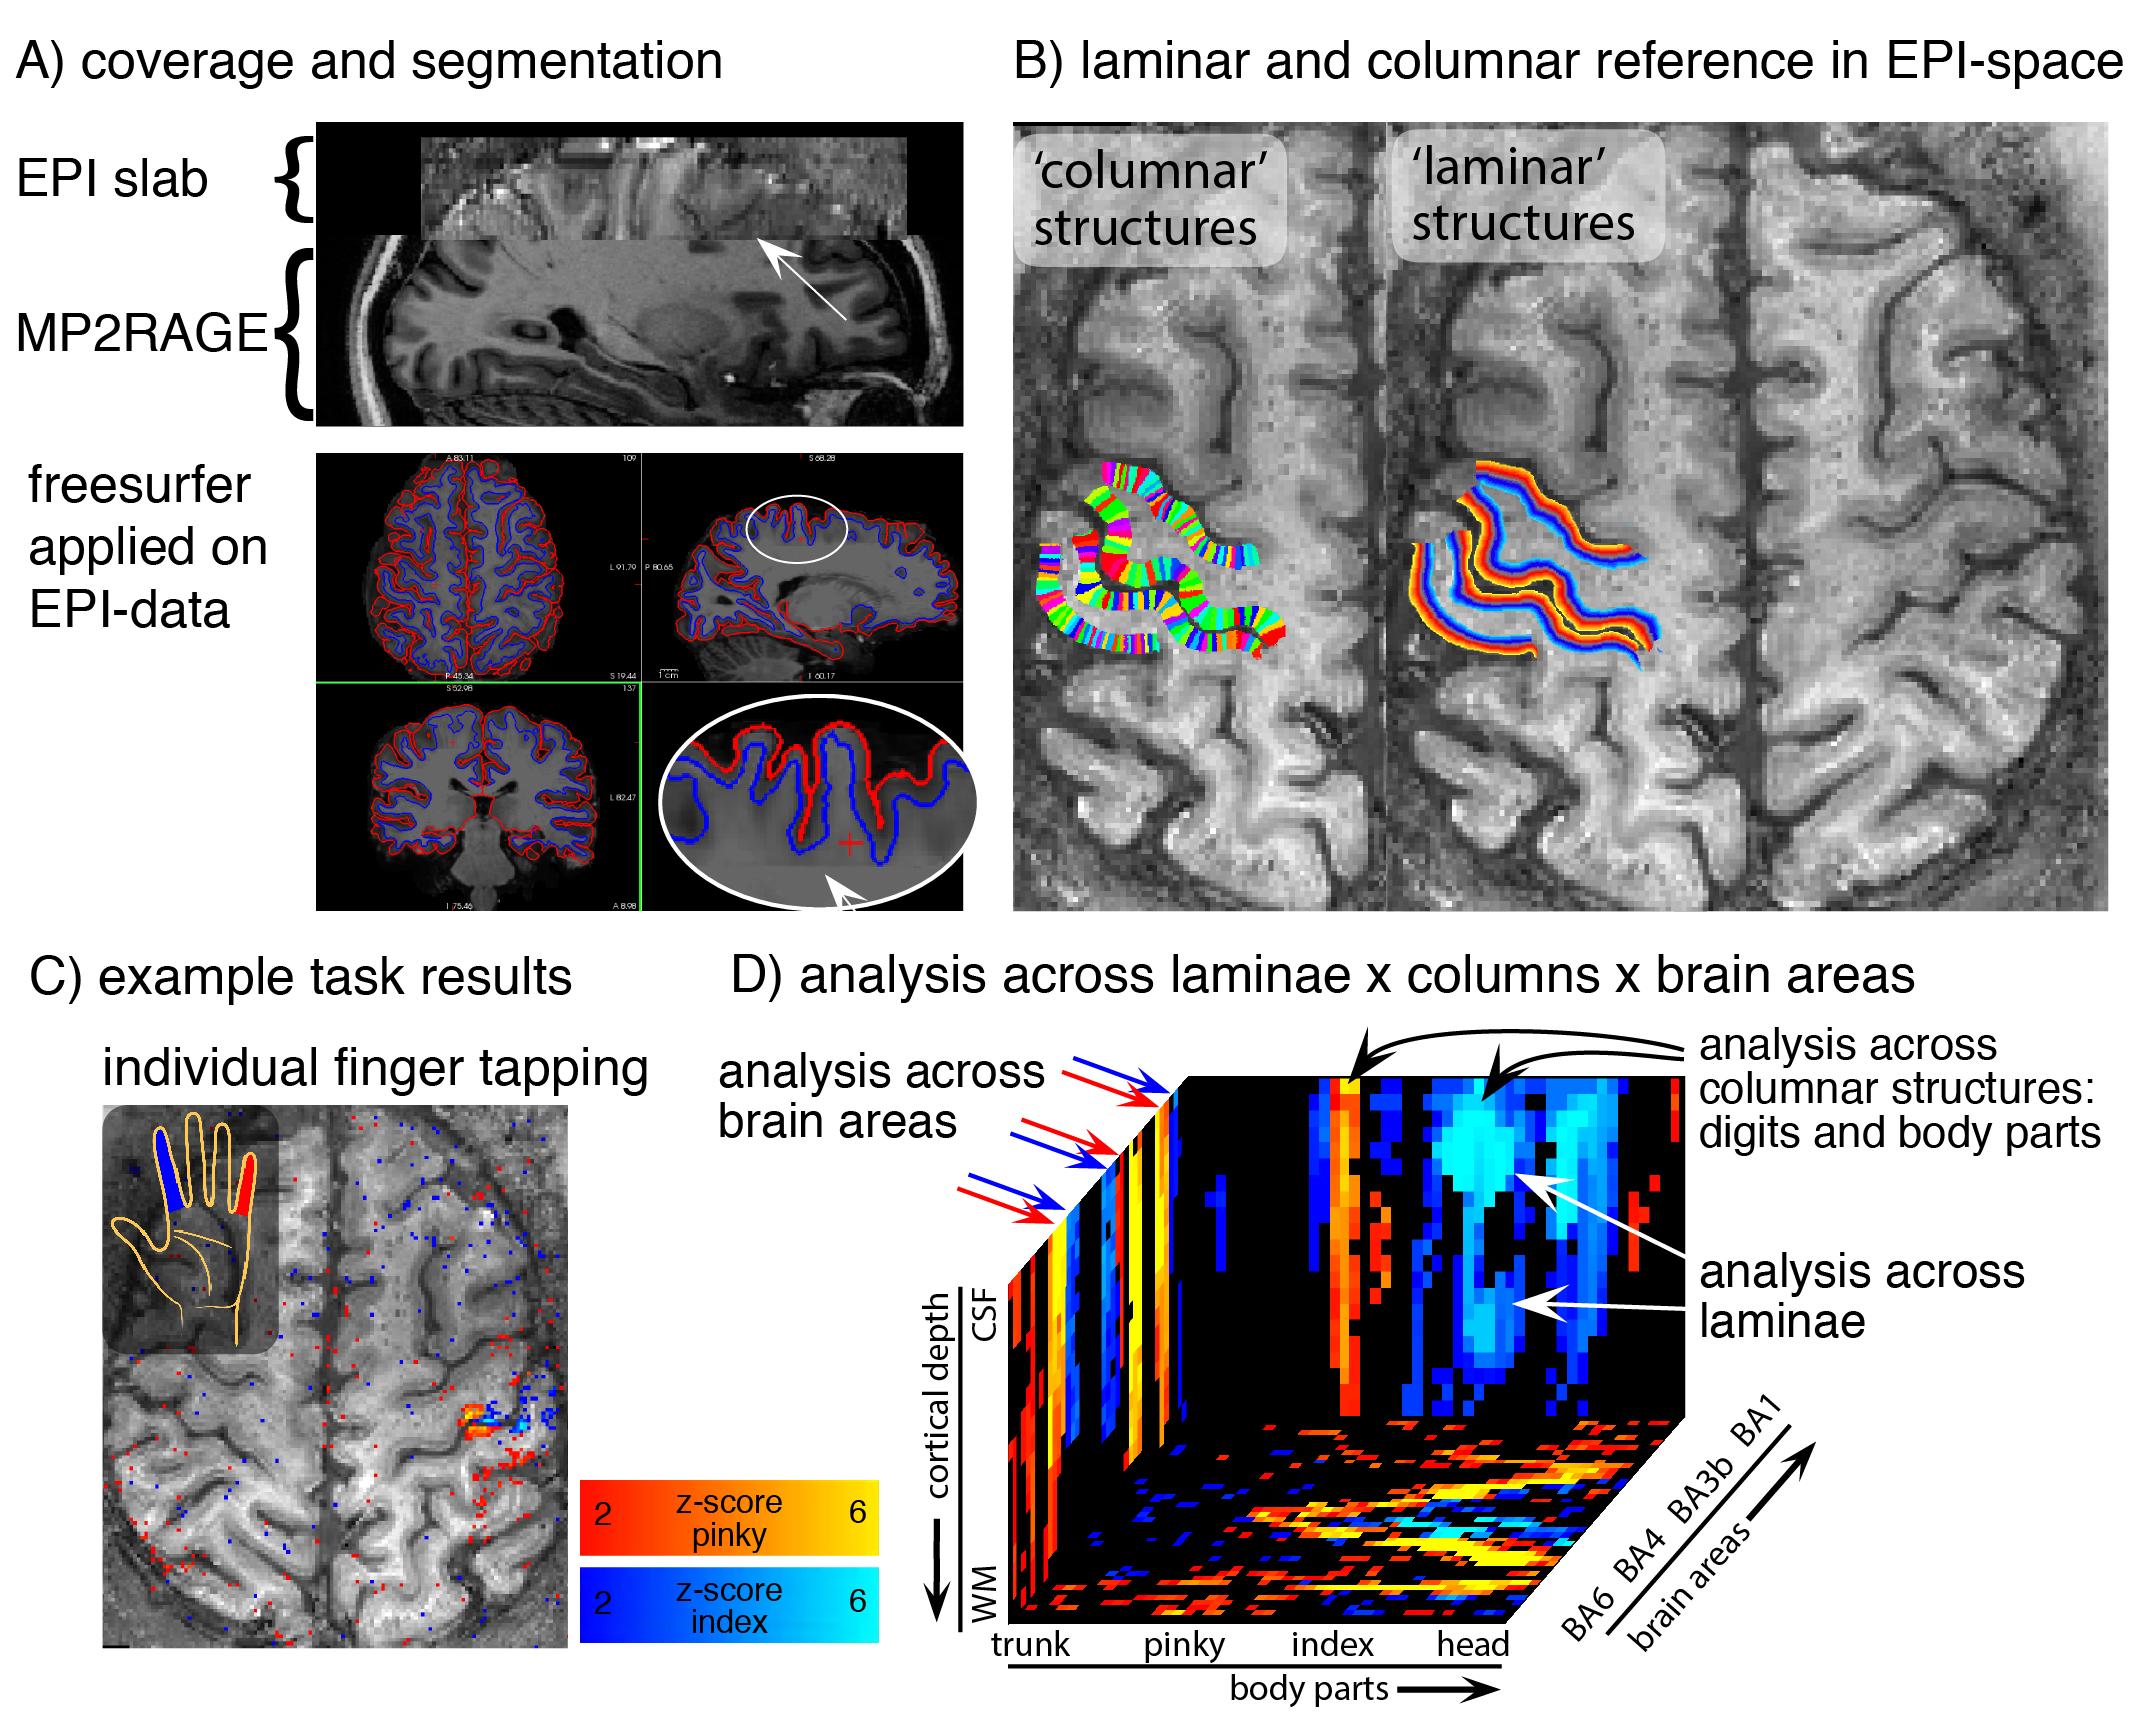
Fig. 1: Analysis methods across layers and columns.
A) For whole-brain Freesurfer analysis, missing coverage of EPI-slab is filled with ‘anatomical’ data. B) Columnar and laminar structures are calculated within the functional slab. C) Example finger tapping results to illustrate the laminar/columnar analysis pipeline in panel D). D) depicts the fMRI signal from C) in a 3D-cortical coordinate system, which allows straightforward fMRI signal evaluations across layers, columns, and brain areas.
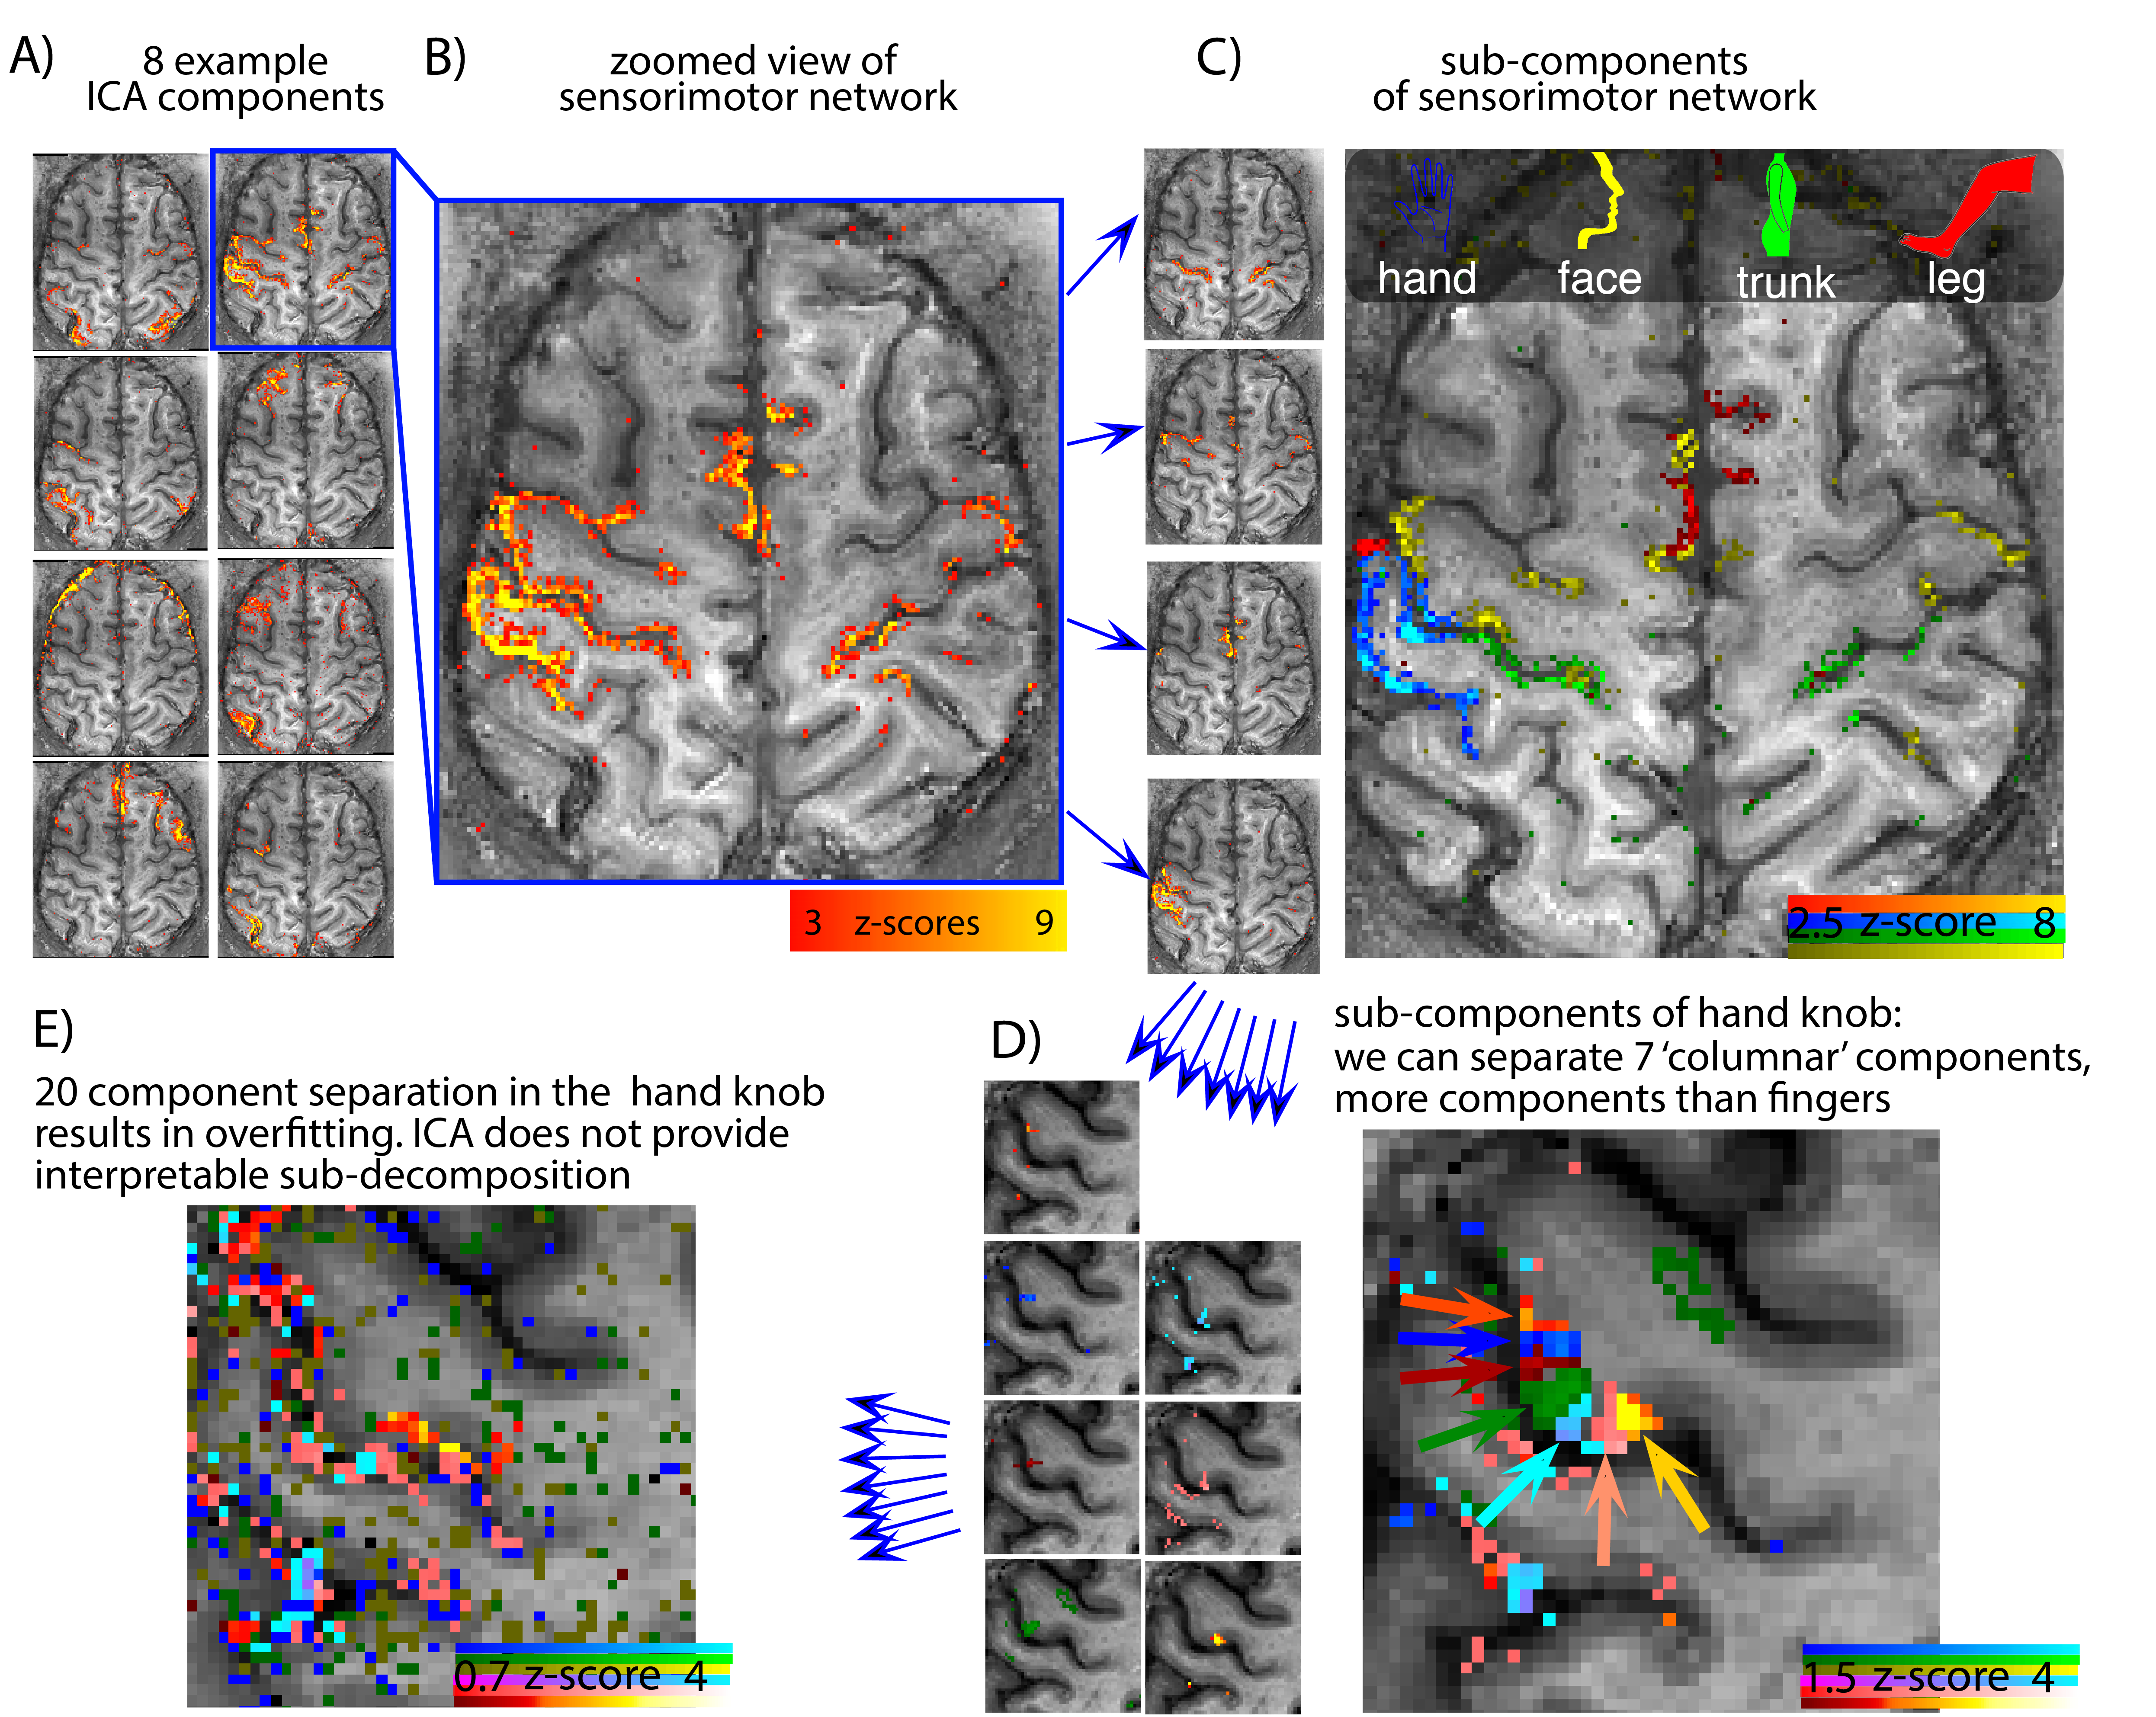
Fig. 2: Resting-state networks derived with ICA.
A) Automaic dimensionality estimation in MELODIC provided >61 components in all participants. B) The sensorimotor network is manually selected and used for further ICA decomposition. C) The sensorimotor network decomposes into sub-components that represent various body parts, such as hand, face, trunk, and leg. D) The further ICA decomposition in the hand knob into 10 sub-components reveals a segregation into 'columnar' structures along the GM ribbon (3 unstructured noise components were disregarded). E) ICA decomposition into even more components might be limited by overfitting and does not reveal functionally reasonable networks.
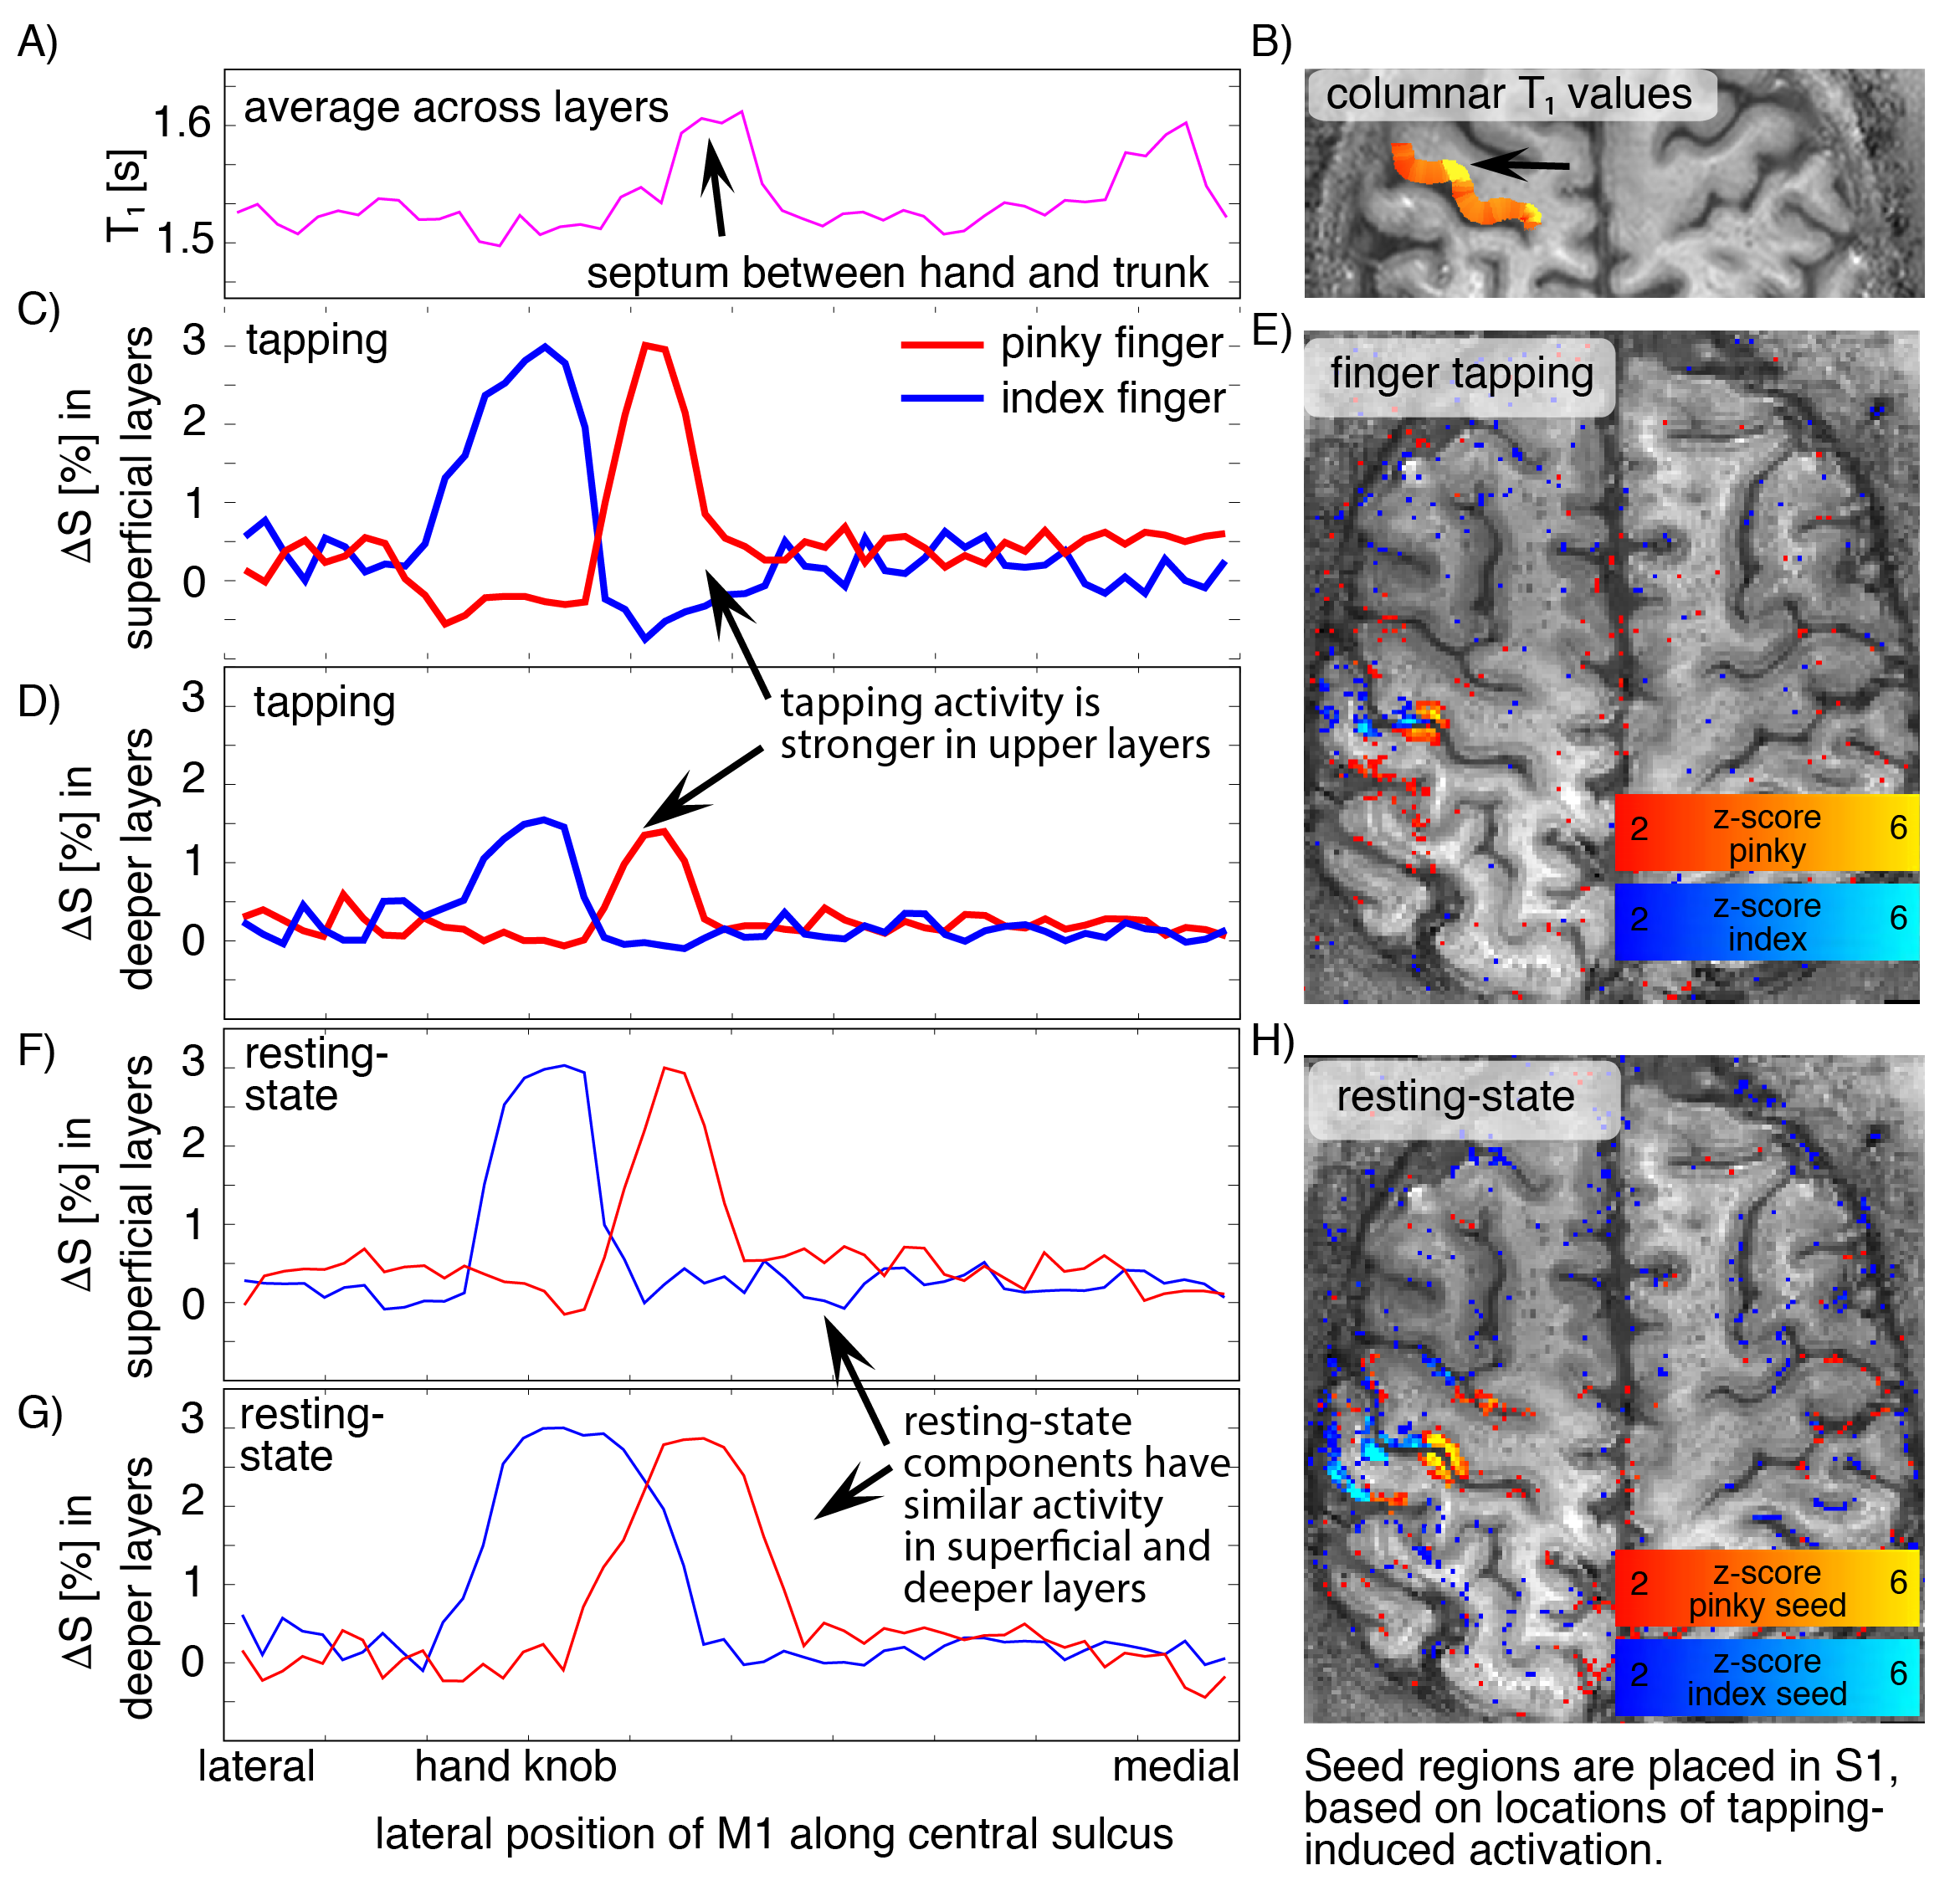
Fig. 3: Validation of single-digit resting-state networks with anatomical and task induced signals across columnar and laminar structures.
A-B) T1 values from 0.4 mm MP2RAGE across columnar structures. The high T1 region refers to a septum of low myelination between hand and trunk representations [Kuehn 2017]. C-E) tapping induced activity of index finger and pinky finger in superficial and deeper layers. F-H) Seed-based resting-state sensorimotor network. Note the spatial overlap of the tapping-induced activity across pre- and post-central sulci. While tapping-induced activity is stronger in superficial layers, resting-state networks have comparable amplitude in superficial and deeper layers (D and G).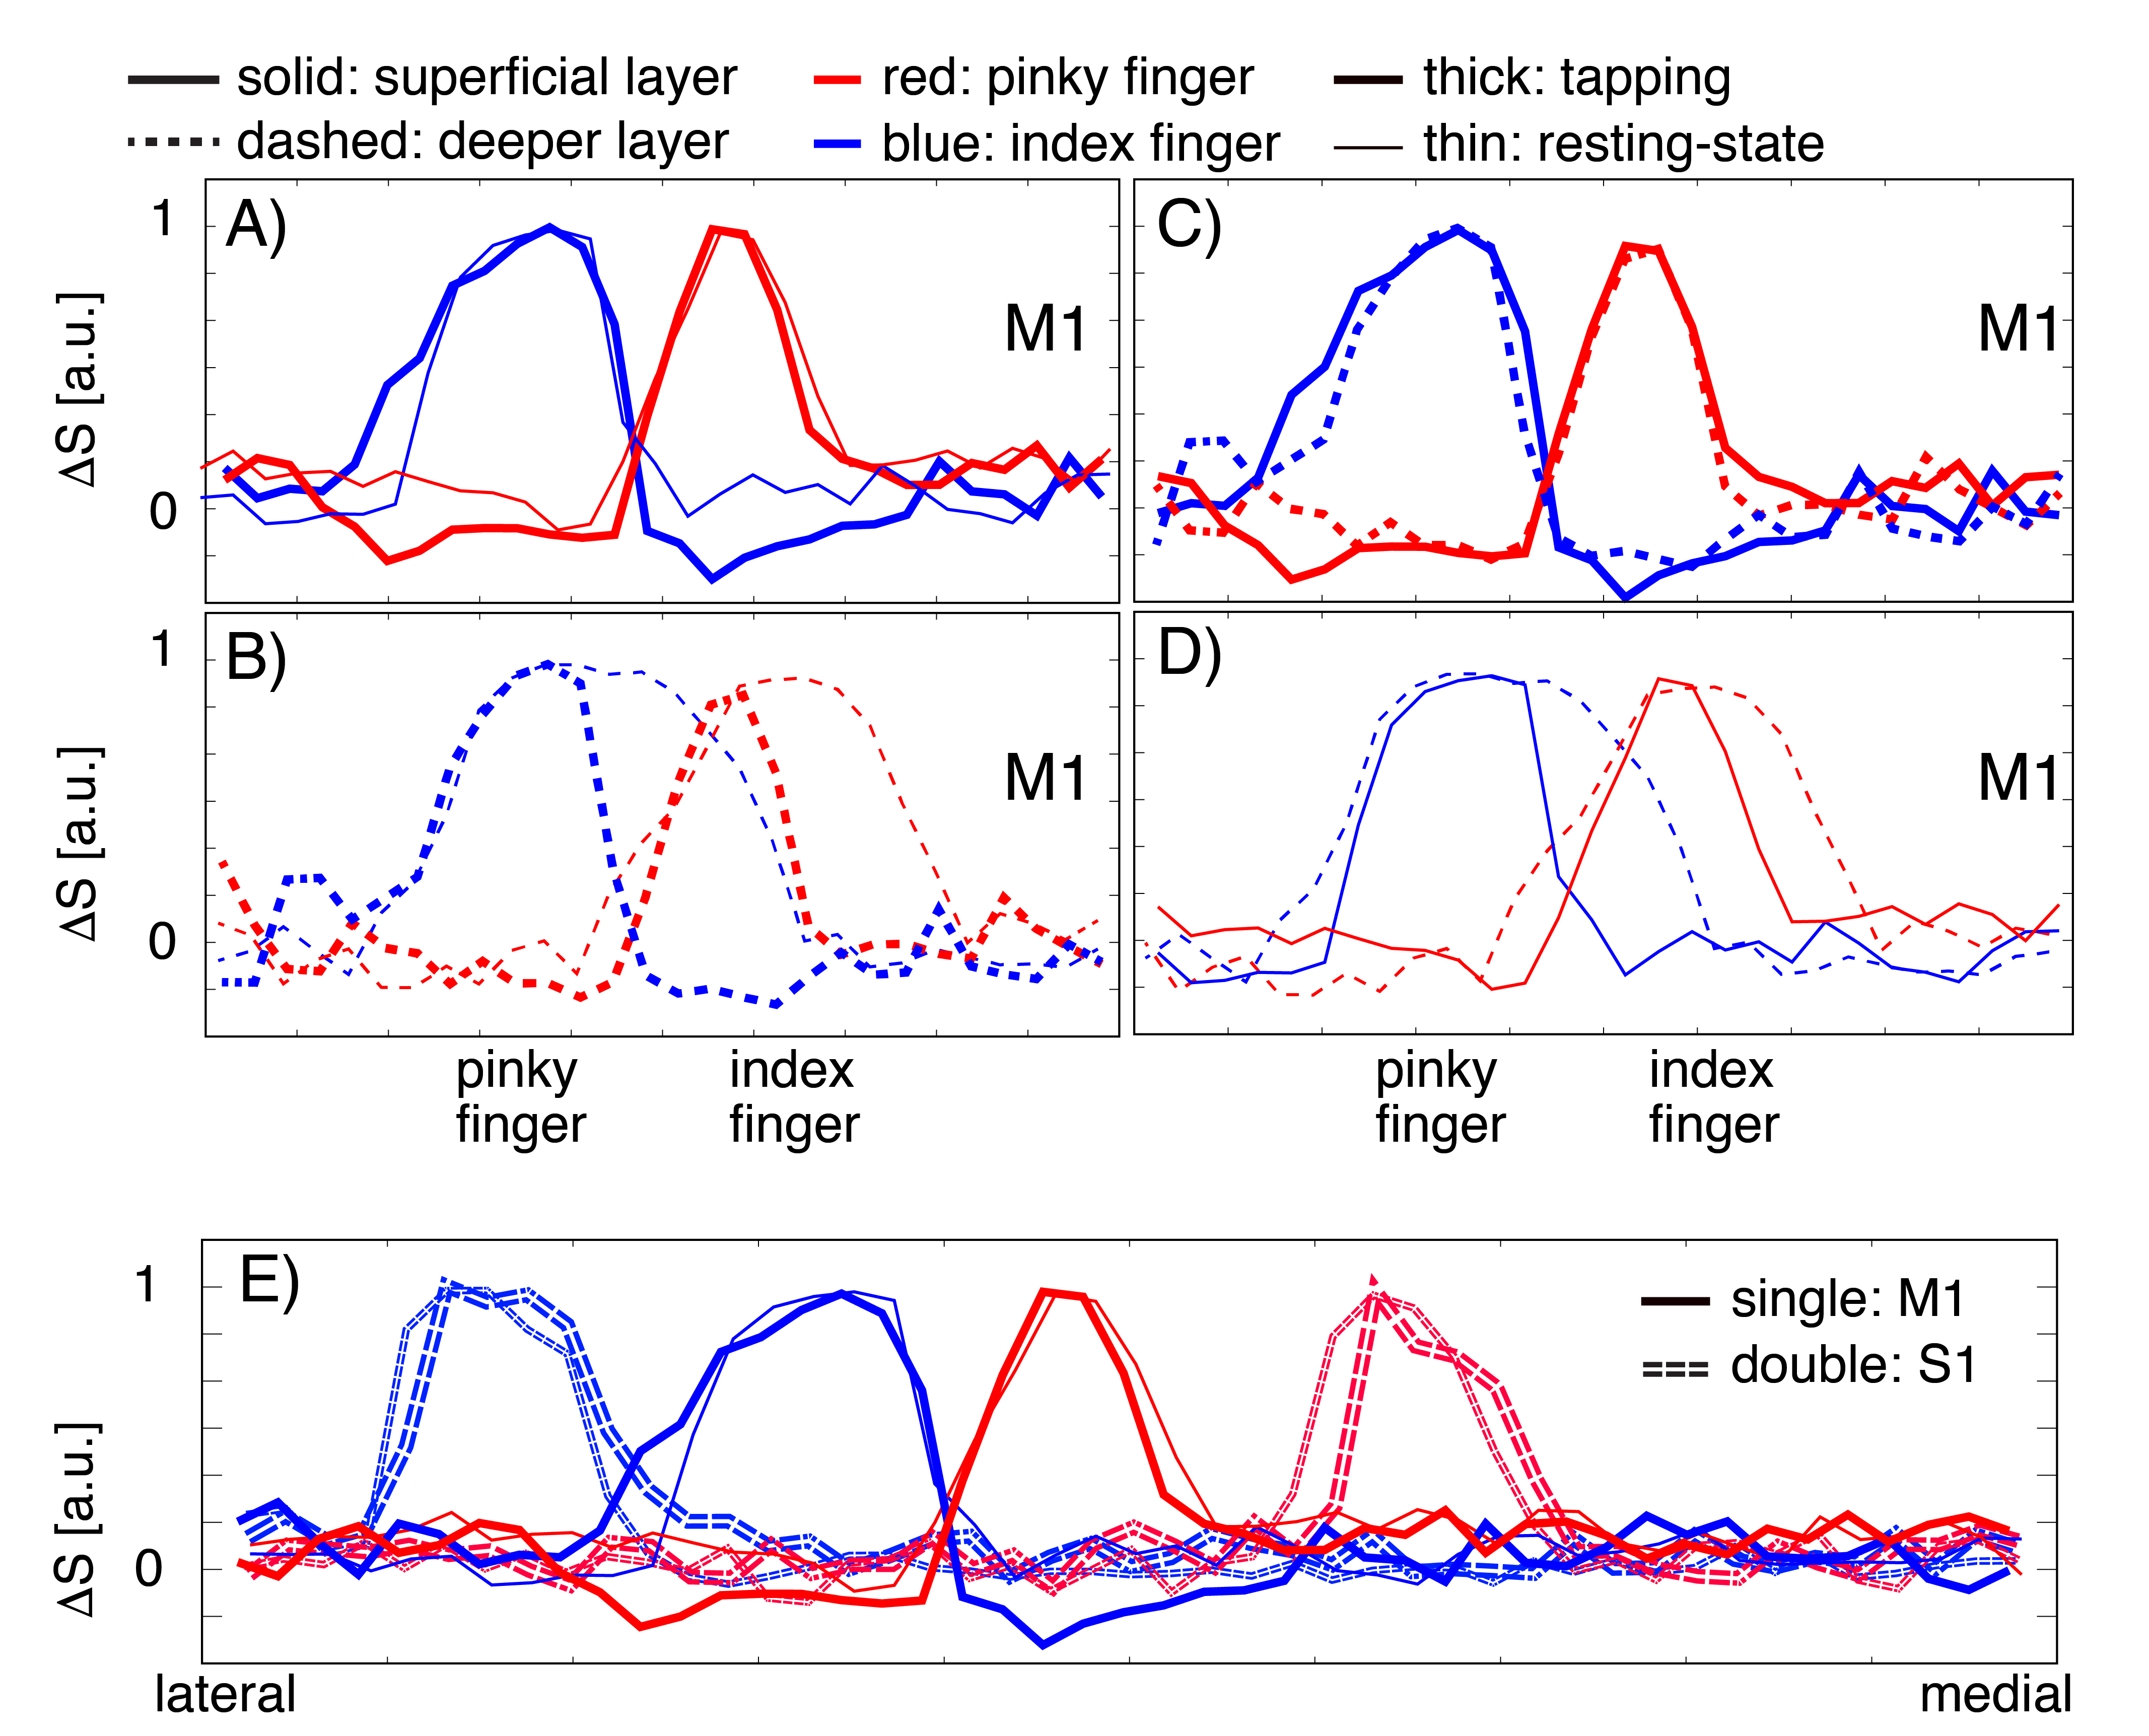
Fig. 4: Similarities and differences of ‘columnar’ and ‘laminar’ distribution during task and rest.
A) In superficial layers of M1, tapping-induced and resting-state signals show comparable columnar spread (FWHM). B) In deeper layers of M1, task-induced activity has a higher columnar specificity than resting-state signals (smaller lateral spread of thick lines). C) Tapping induced activity has similar spreads across cortical depth (blue and red lines overlap). D.) Resting-state networks have a bigger overlap in deeper layers than superficial layers (dashed lines are broader and overlap). E) Individual fingers are further apart in S1 compared to M1 (solid peaks are closer).
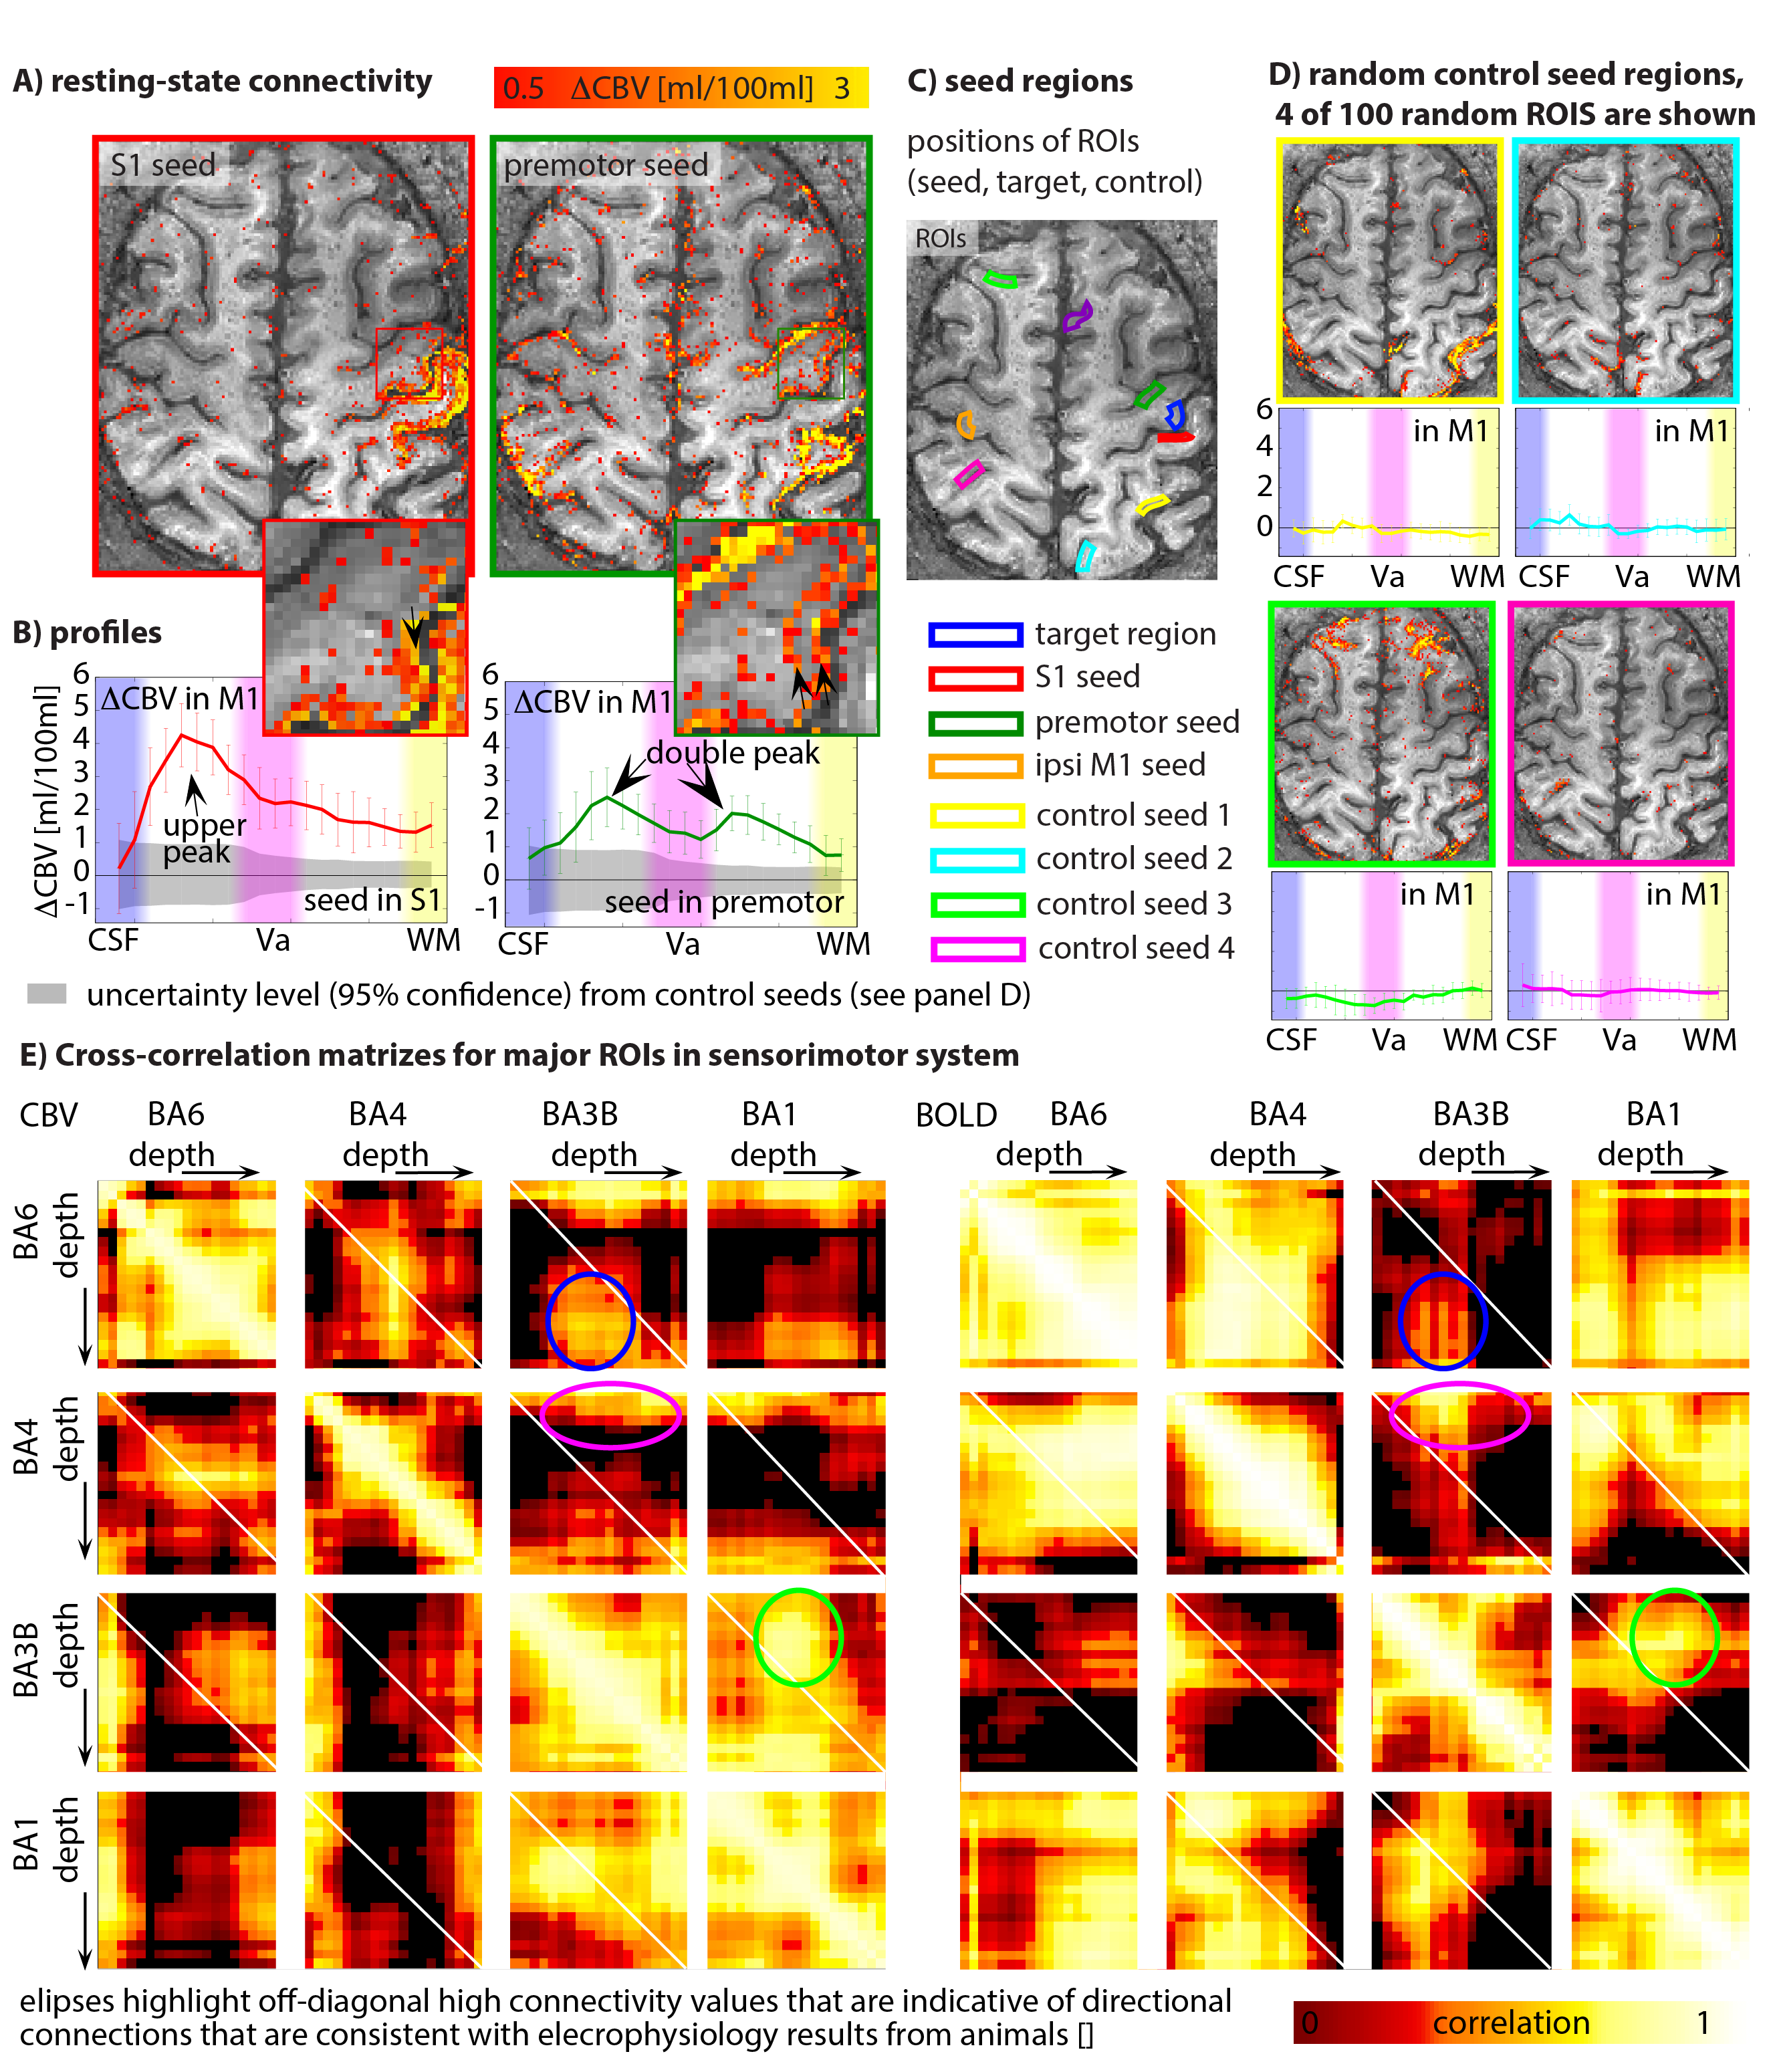
Fig. 5: Layer-dependent resting state for directional connectivity estimation.
Panel A) depicts the layer-dependent functional connectivity for seeds in S1 and premotor cortex. Connectivity with S1 shows strongest connectivity in superficial feed-back layers, while premotor connectivity is also associated with activity in deeper output-layers (B). These layer-dependent connectivity profiles are significantly different form random control seed regions (C-D). Layer-dependent cross-correlation matrices (E) give indications of layer-dependent connectivity between brain areas. As such, it can be seen that BA1 receives feed-forward input (presumably in layer IV) from BA3 in the superficial cortico-cortical connection layers (presumably layer II/III) (green ellipse).