0369
Macromolecular proton fraction closely correlates with myelin loss in the rat ischemic stroke model1Research Institute of Biology and Biophysics, Tomsk State University, Tomsk, Russian Federation, 2Massachusetts General Hospital, Charlestown, MA, United States, 3Institute of Cytology and Genetics SB RAS, Novosibirsk, Russian Federation, 4Siberian State Medical University, Tomsk, Russian Federation, 5Department of Radiology, University of Washington, Seattle, WA, United States
Synopsis
Non-invasive quantitative assessment of myelin damage in ischemic stroke is currently unavailable. The goal of this study was to evaluate a recently proposed myelin imaging technique, macromolecular proton fraction (MPF) mapping in the rat stroke model and compare it with histological myelin quantitation. MPF decrease in the brain infarct closely correlated (R = 0.81, p<0.001) with luxol fast blue staining on the 1st, 3rd, and 10th day after stroke. Further improvement in accuracy of myelin quantitation (R = 0.98) was achieved with the use of bivariate linear regression model including T2 to correct errors related to edema.
Introduction
Macromolecular proton fraction (MPF)1 has been recently histologically validated as a quantitative myelin biomarker in the normal rat brain and murine cuprisone-induced demyelination model2,3. A number of studies suggest that myelin damage occurs in ischemic stroke from the first hours after injury4,5. Non-invasive assessment of demyelination in stroke is currently unavailable. The goals of this study were to assess the feasibility of quantitative measurements of myelin loss in the rat stroke model using MPF and compare performance of this parameter with other commonly used imaging metrics including T1, T2, proton density (PD), and apparent diffusion coefficient (ADC).Material and Methods
Animal procedures: Ischemia was induced in fifteen Sprague Dawley rats by one-hour middle cerebral artery occlusion followed by reperfusion. All animals were divided into 3 groups and imaged on a 11.7 T scanner (Bruker BioSpec) on the 1st, 3rd or 10th days after MCAO. After MRI, animals were euthanized andbrains were processed for myelin staining with luxol fast blue (LFB).
MRI protocol: The following quantitative MRI techniques were used: multiple spin-echo T2 mapping (TR= 3000 ms, 16 echoes, TE range 10-160 ms, slice thickness 0.8 mm, in-plane resolution 200×200 μm2), single-shot spin-echo diffusion-weighted echo-planar (DW-EPI) ADC mapping (TR/TE=1500 /15.4ms, actual b-values 4.5, 484.2 and 946.5 s/mm2, slice thickness 0.8 mm, in-plane resolution 300×300 μm2), variable flip angle (VFA) T1 and PD mapping (3D spoiled gradient-echo with TR/TE=16/2.6 ms, flip angles 3 and 16°, resolution 200×200×400 μm3) and single-point synthetic reference MPF mapping5,6. Source data for MPF mapping included the above VFA images and spoiled gradient-echo images (TR/TE=22/2.6 ms, flip angle 8°, resolution 200×200×400 μm3) obtained with off-resonance saturation achieved by a Gaussian pulse with frequency offset 5 kHz, effective flip angle 900°, and duration 10 ms.
Image analysis: Regions of interest (ROI) on the histological images and MRI maps were outlined with ImageJ software. Circular ROIs of the standard size were placed into the ischemic lesion and a symmetric anatomic location in the contralateral hemisphere. LFB optical density (OD) was quantified from the intensity of the red channel on RGB images with background correction as detailed earlier2,3.
Statistical analysis: MRI parameters and LFB OD in the ischemic lesion were expressed as a percentage change relative to the contralateral hemisphere:
$$Change=\frac{ROIcontralateral-ROIlesion}{ROIcontralateral}\times100$$
Significance of percentage changes was assessed using one-sample t-test. Univariate and multivariate linear regression was used to test associations between percentage changes in LFB OD and MRI parameters.
Results
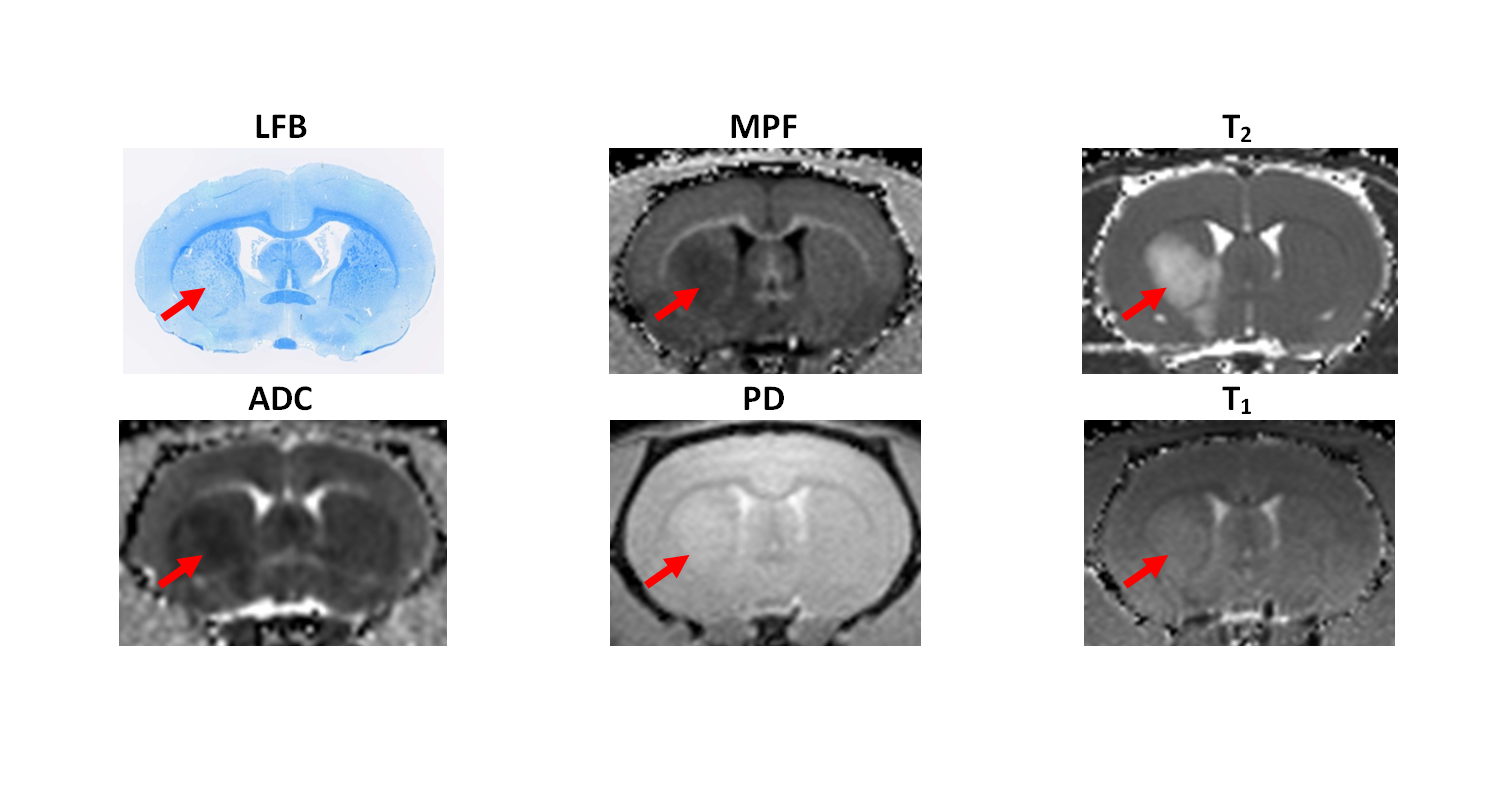
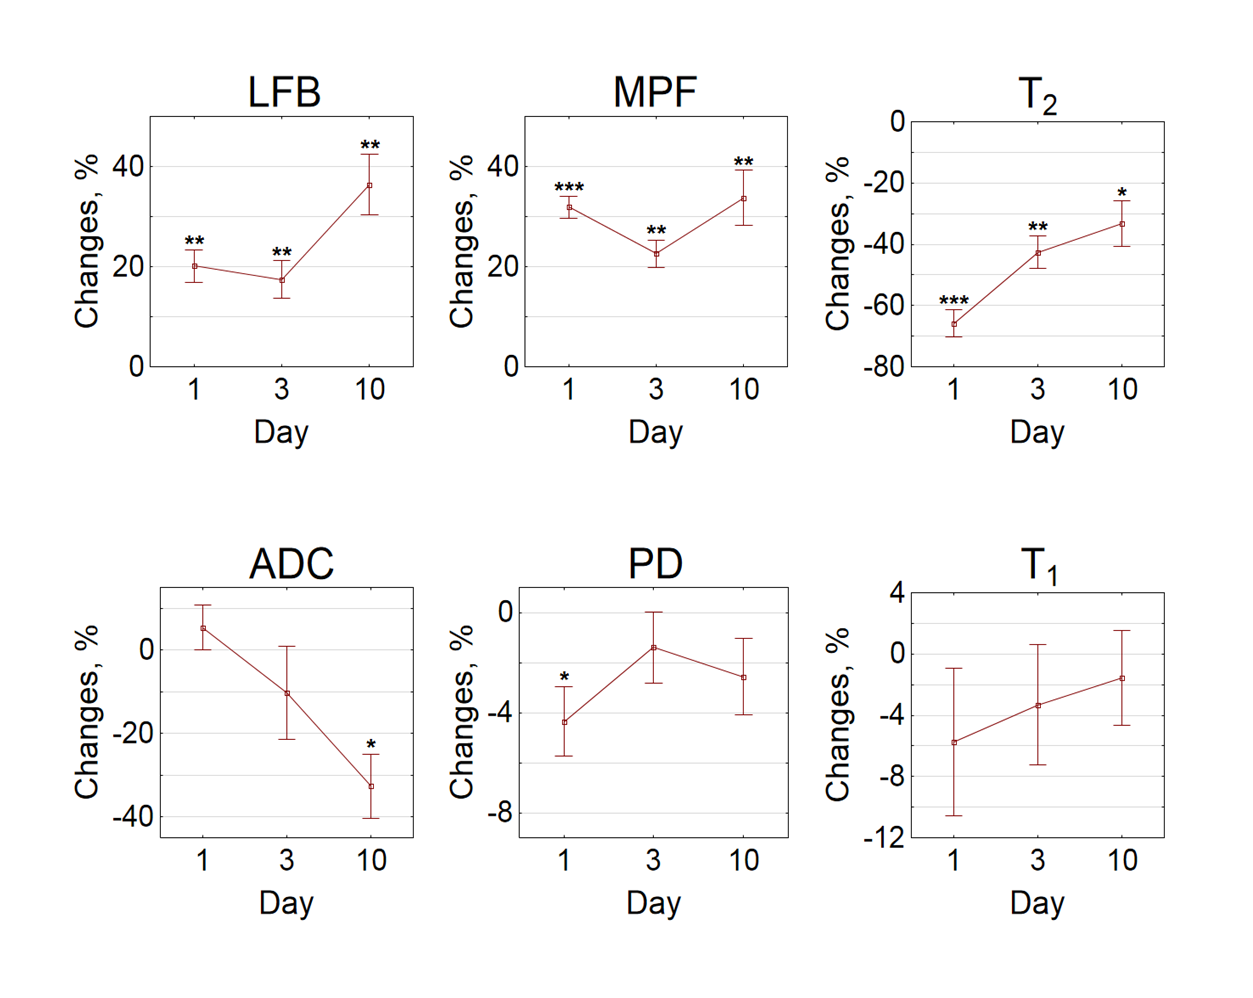
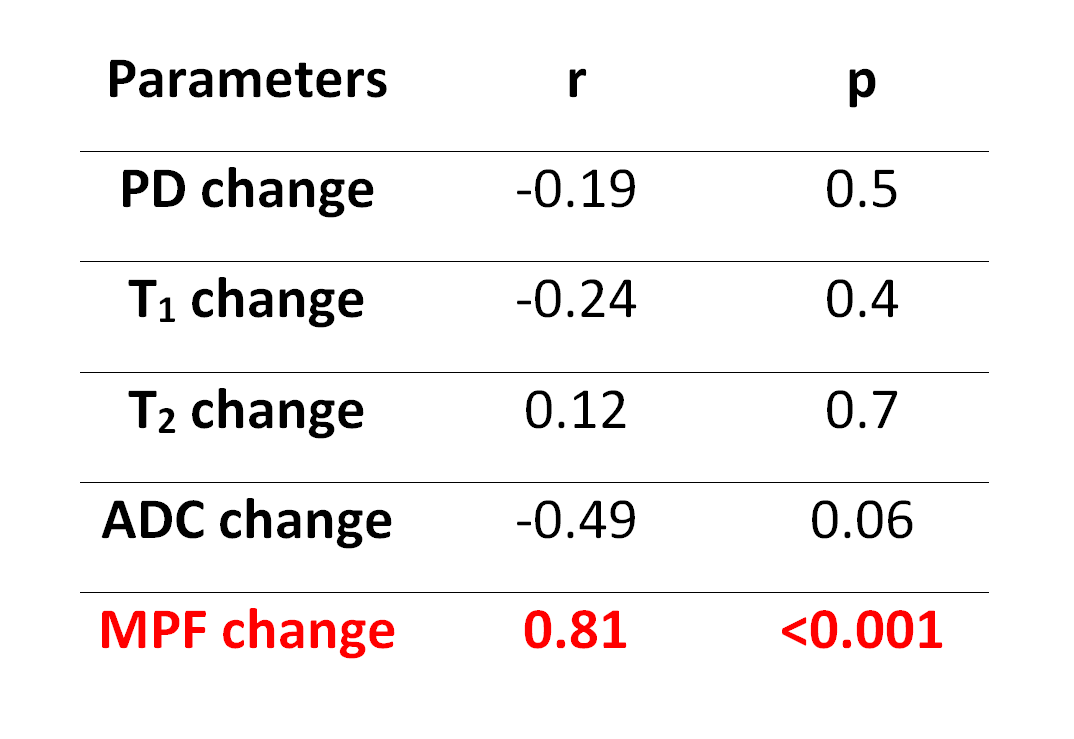
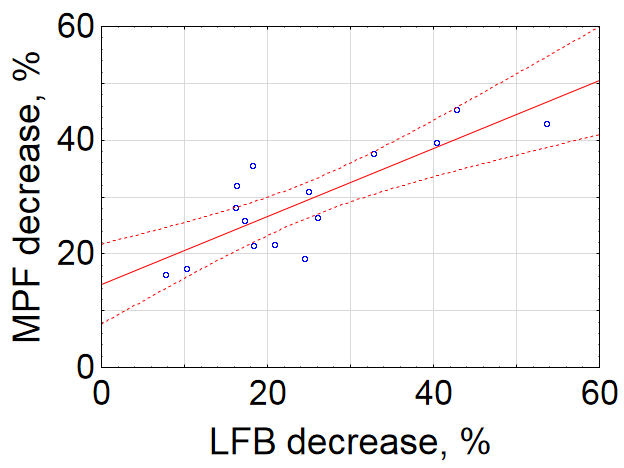
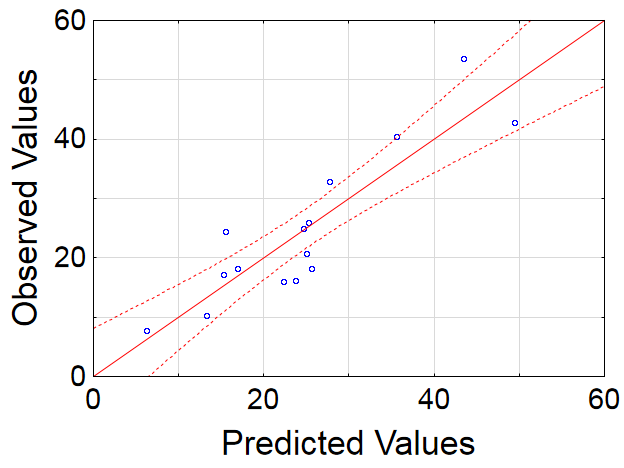
Example MRI parametric maps and a matched LFB stained section are presented in Fig. 1. Percentage changes in MRI parameters and LFB OD in the stroke lesion are shown in Fig. 2. LFB OD, MPF, and T2 demonstrated significant changes in all groups. ADC was significantly increased in the lesion (negative percentage change) only in the 10-day group. PD showed a significant change in the 1-day group. T1 changes did not reach significance. Patterns of a relative decrease in MPF and LFB OD appeared rather similar with only an about 10% mismatch for the 1-day group (Fig. 2). Among all MRI parameters, only MPF significantly correlated with LFB OD (R = 0.81, P<0.001) (table in Fig. 3, Fig. 4). In stepwise multivariate regression analysis (Fig. 5), MPF and T2 were retained as significant predictors of LFB OD. The resulting model provided very strong agreement with experimental data (adjusted R2 = 0.95).Discussion
MPF showed the best specificity to myelin damage in the ischemic lesion. In subacute stroke, MPF is also subjected to the effect of edema that diminishes during lesion evolution. Changes in other studied MRI parameters appeared non-specific to myelin and mostly driven by edema and necrosis. Particularly, minimal positive and negative ADC changes in the 1-day and 3-day groups are consistent with concurrent effects of cytotoxic and vasogenic edema. T1 maps showed limited utility due to convergence of T1 values in ultra-high magnetic fields7.Conclusion
This study establishes MPF as a quantitative imaging biomarker of demyelination in the ischemic stroke lesions. An MPF decrease in the ischemic brain infarct is mostly determined by myelin damage with a minor confounding effect of edema. Highly accurate quantitation of myelin loss in the ischemic lesion is possible using a bivariate linear regression model including MPF and a complimentary T2 measurement providing correction for residual errors caused by edema.Acknowledgements
The study was performed with financial support of Russian Science Foundation grant, the project №14-45-00040. The authors thank Petrovskiy D., Kudabaeva M., Nemirovich-Danchenko N., and Svetlik M. for their contribution in carrying out of surgery and data analysis.References
1. Yarnykh VL. Fast macromolecular proton fraction mapping from a single off-resonance magnetization transfer measurement. Magn Reson Med. 2012;68(1):166–178.
2. Underhill HR, Rostomily RC, Mikheev AM, et al. Fast bound pool fraction imaging of the in vivo rat brain: Association with myelin content and validation in the C6 glioma model. Neuroimage 2011;54:2052-2065.
3. Khodanovich MY, Sorokina IV, Glazacheva VY, et al. Histological validation of fast macromolecular proton fraction mapping as a quantitative myelin imaging method in the cuprizone demyelination model. Sci Rep 2017;7:46686.
4. Wang Y, Liu G, Hong D, et al. White matter injury in ischemic stroke. Prog Neurobiol. 2016;141:45–60.
5. McIver SR, Muccigrosso M, Gonzales ER, et al. Oligodendrocyte degeneration and recovery after focal cerebral ischemia. Neuroscience. 2010;169:1364–1375.
6. Yarnykh VL. Time-efficient, high-resolution, whole brain three-dimensional macromolecular proton fraction mapping. Magn Reson Med 2016;75:2100-2106.
7. Naumova AV, Akulov AE, Khodanovich MY, et al. High-resolution three-dimensional macromolecular proton fraction mapping for quantitative neuroanatomical imaging of the rodent brain in ultra-high magnetic fields. NeuroImage. 2017;147:985-993.
Figures