0366
Assessment of Regional Myocardial Velocities by Tissue Phase Mapping and Feature Tracking in Healthy Children and Pediatric Patients with Hypertrophic Cardiomyopathy: A Comparison Study1Department of Radiology, Feinberg School of Medicine, Northwestern University, Chicago, IL, United States, 2Feinberg School of Medicine, Northwestern University, Chicago, IL, United States, 3Department of Pediatrics, Division of Pediatric Cardiology, Ann & Robert H. Lurie Children's Hospital of Chicago, Chicago, IL, United States, 4Department of Pediatrics, Feinberg School of Medicine, Northwestern University, Chicago, IL, United States, 5Department of Medical Imaging, Ann & Robert H. Lurie Children's Hospital of Chicago, Chicago, IL, United States, 6Department of Biomedical Engineering, McCormick School of Engineering, Northwestern University, Chicago, IL, United States
Synopsis
In this study, we compare tissue phase mapping (TPM) and feature tracking (FT) of standard cine SSFP images for the assessment of regional myocardial velocities in 15 pediatric patients with hypertrophic cardiomyopathy (HCM) and 20 age-matched healthy controls. Data analysis included the calculation of segmental (AHA 16-segment model) left ventricular radial and long-axis peak velocities in systole and diastole. Both techniques detected significantly decreased diastolic velocities in HCM patients compared to controls, suggesting reduced myocardial relaxation despite normal ejection fraction. Lower temporal resolution of FT derived velocities resulted in systematically lower peak velocities compared to directly measured TPM velocities.
Introduction
Methods
Fifteen pediatric
HCM patients (15±4y, 9f) and 20 age-matched controls (16±4y [p=0.6], 10f) underwent standard CMR (1.5T
Siemens Aera) including k-t accelerated (R=5) TPM using a prospectively gated, black-blood
prepared phase-contrast sequence with 3-directional velocity encoding1,6,19 in short-axis orientation
(base, mid, apex; each in one breath-hold; in-plane resolution = (1.6-2.5 mm)2;
temporal resolution = 21-25 ms). FT analysis was performed on standard short-
(base, mid, apex) and long-axis (2, 3 and 4 chamber views) retrospectively
gated cine SSFP images (in-plane resolution = (0.7-1.1 mm)2; true
temporal resolution = 30±5 ms) using commercially available software (TomTec
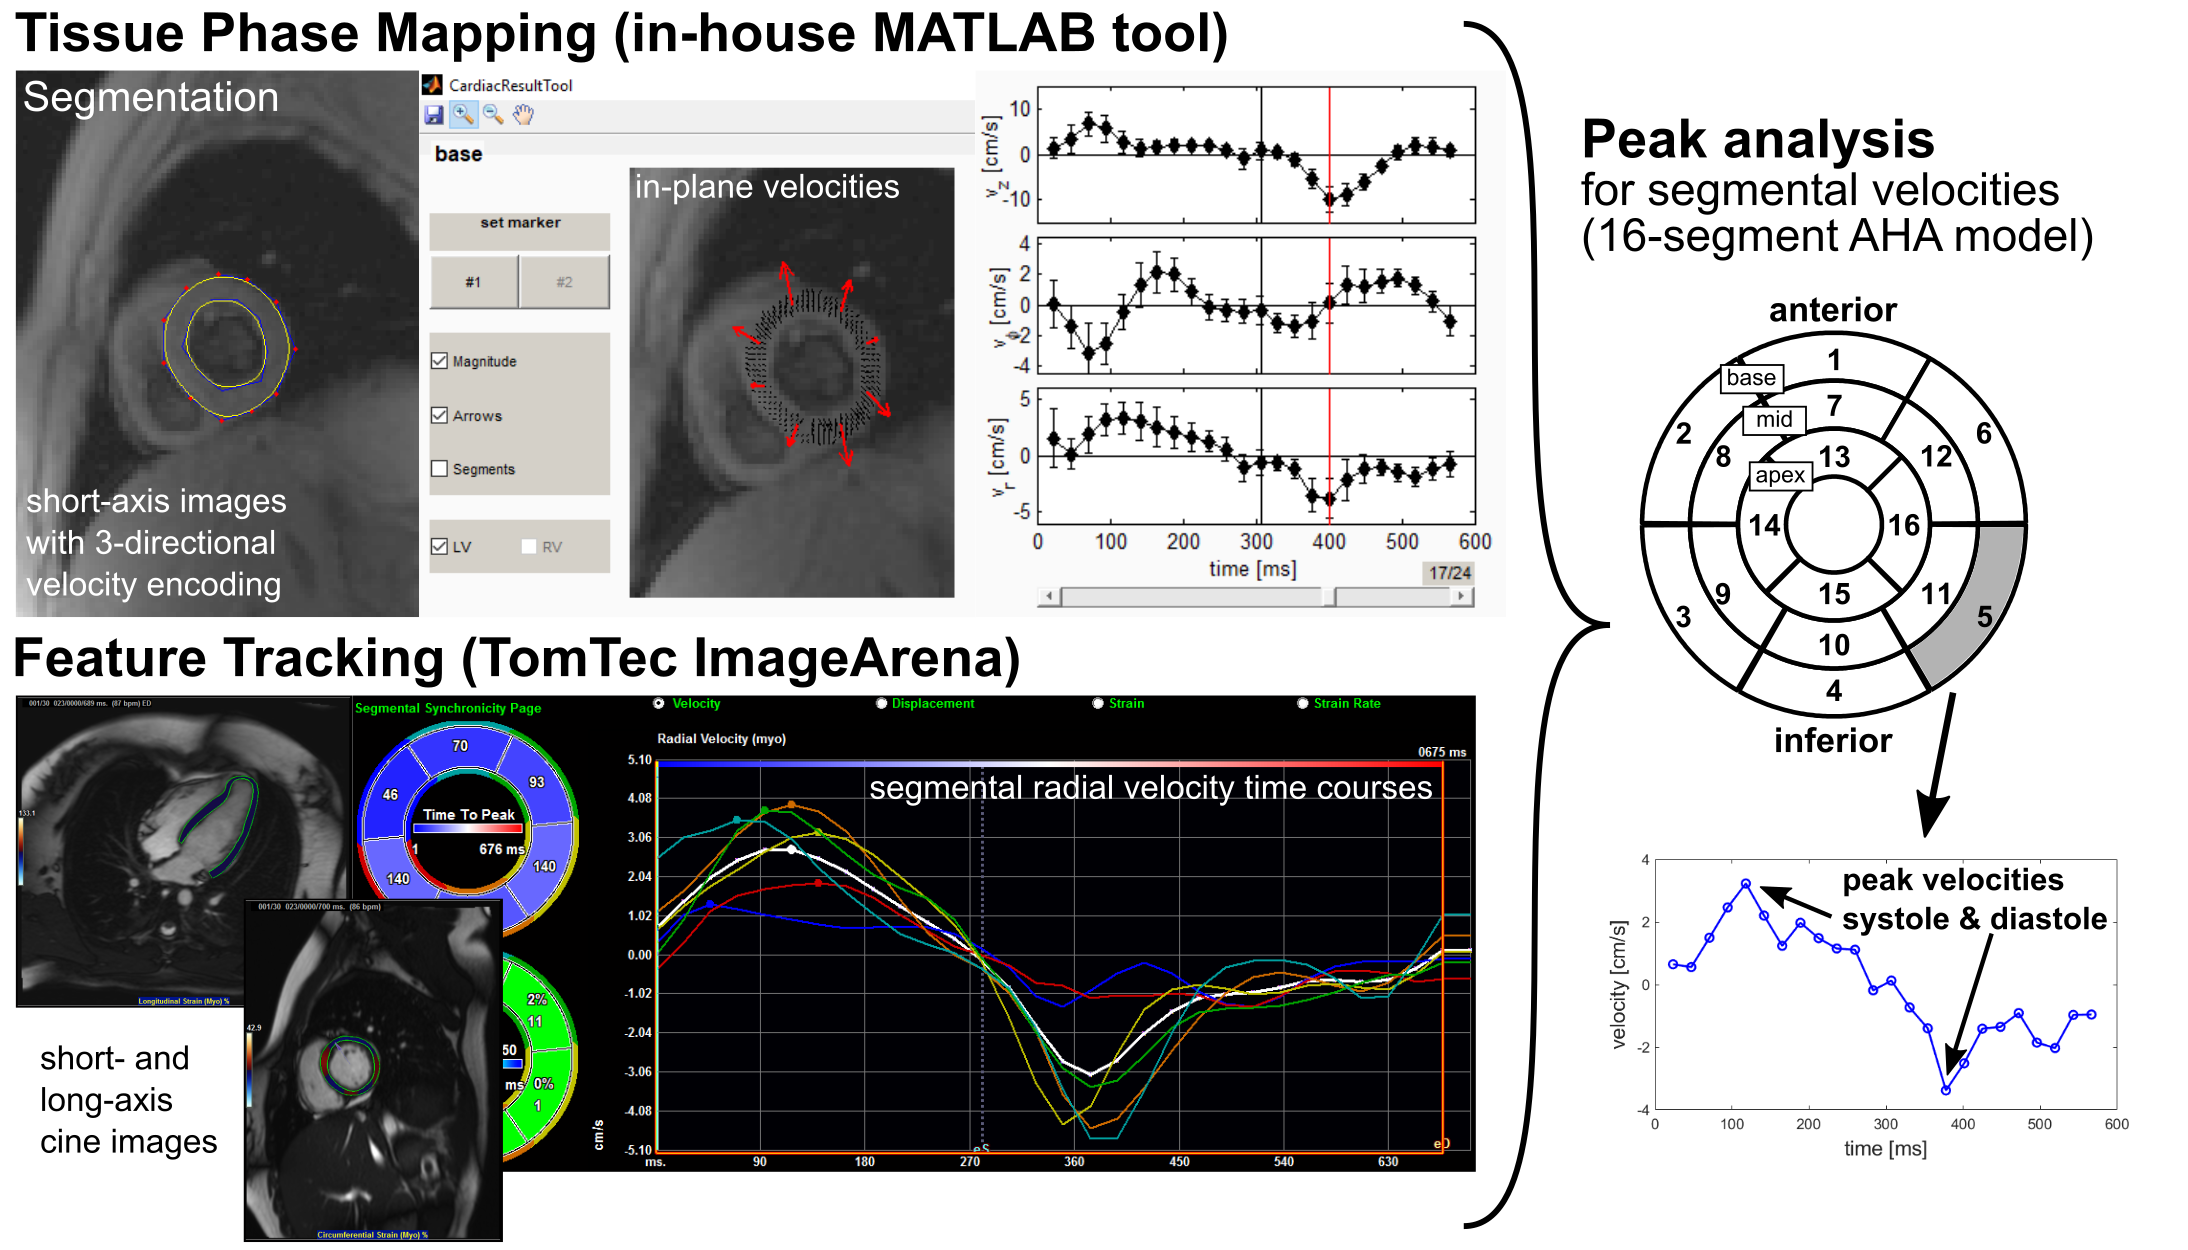
ImageArena). For TPM data analysis an in-house developed MATLAB tool was used
to manually segment LV endo-/epicardial contours and to transform the measured
Cartesian velocities (vx,vy,vz) to radial (vr),
circumferential (vΦ) and long-axis (vz) velocity components more
closely resembling LV contraction, rotation, and shortening. For both FT and
TPM the AHA 16-segment model was used to obtain systolic and diastolic, radial
and long-axis peak velocities for each segment (Fig. 1). For 5 controls and 3
patients not all cine long-axis views have been acquired resulting in
incomplete FT segmental information. Thus, these subjects had to be excluded
for long-axis analysis.Results
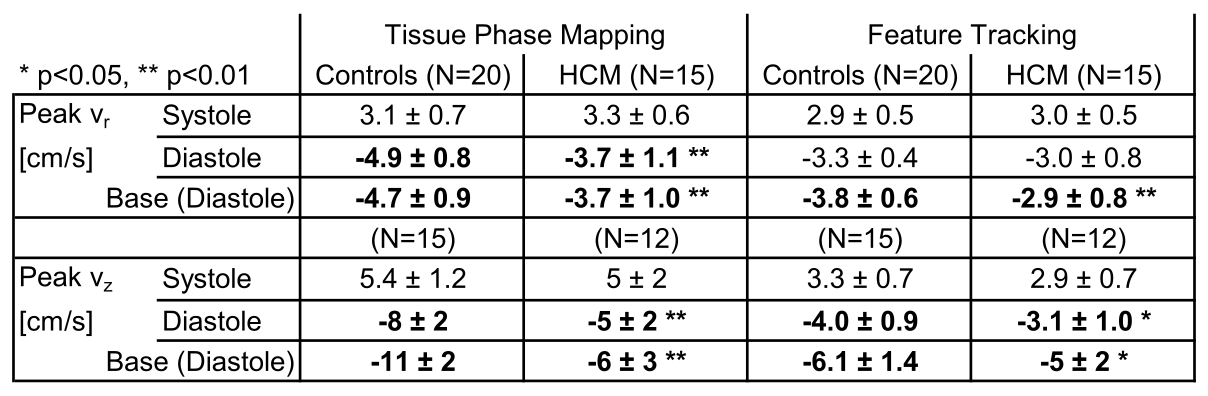
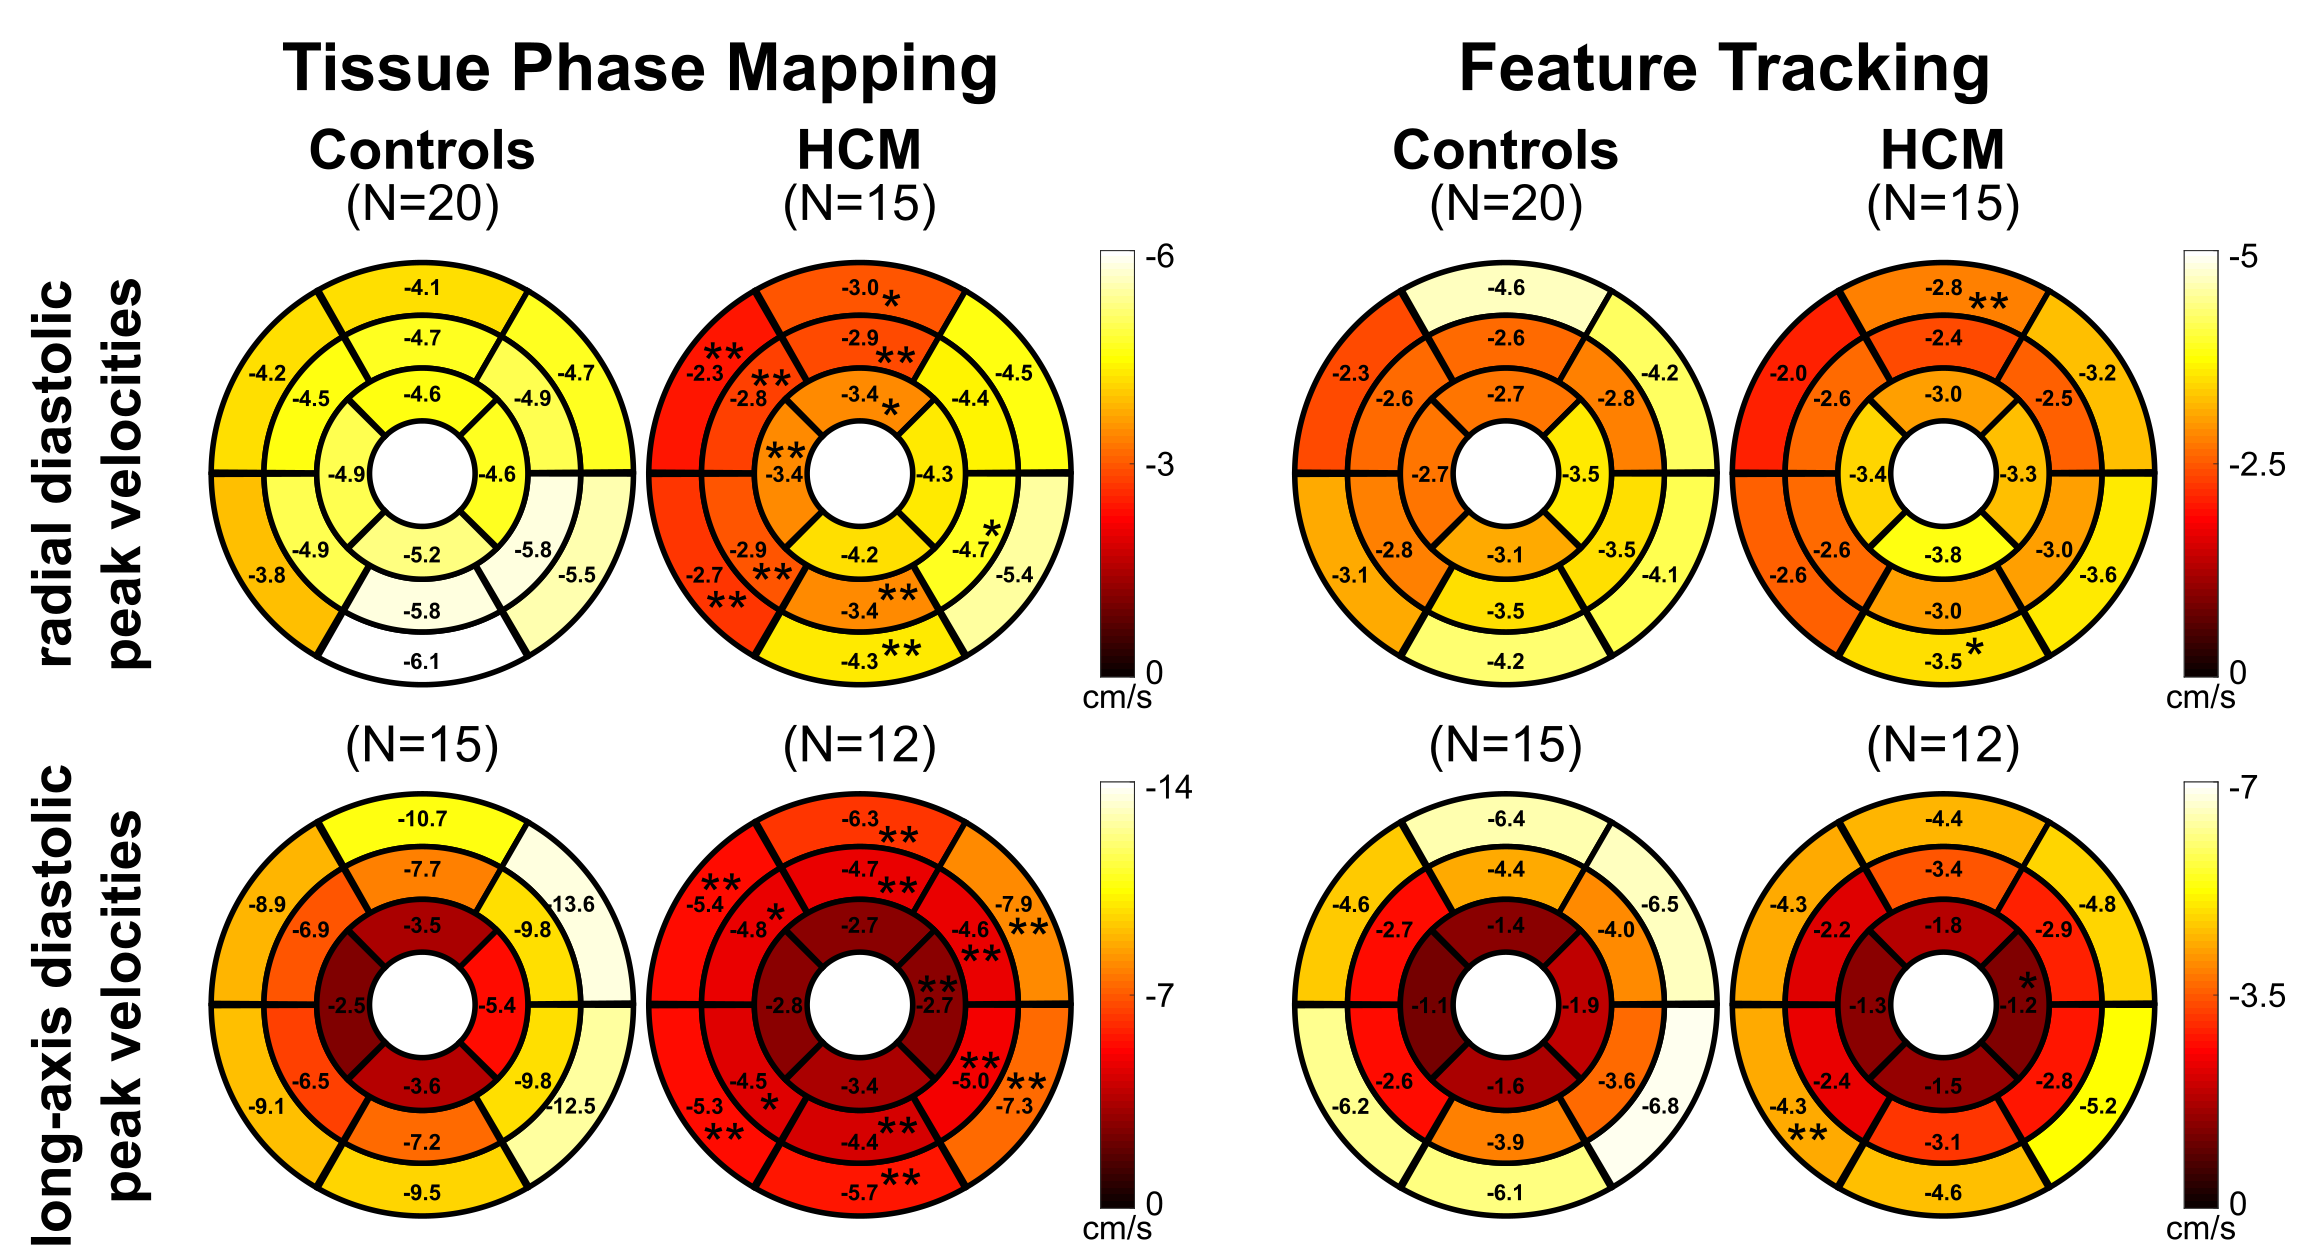
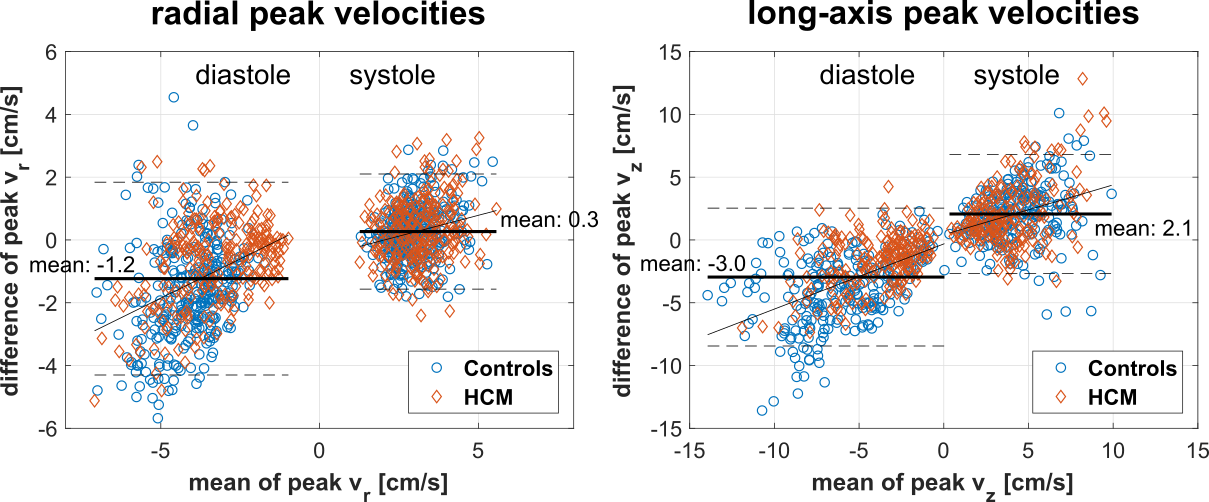
Table 1 lists global LV peak velocities (averaged over all segments) showing significantly reduced diastolic radial and long-axis peak velocities for HCM patients using both TPM (p<0.01) and FT (only vz significant with p<0.05), while LVEF in HCM patients was normal (65±8%). These global differences in diastolic peak velocities were also present on the segmental level as depicted in Fig. 2. Although both TPM and FT showed significant differences between HCM patients and controls on the global and regional level, peak velocities obtained from FT were generally lower compared to TPM. Bland-Altman analysis comparing FT with TPM regional velocities (Fig. 3) demonstrated a systematic underestimation for FT compared to TPM with an increasing difference for higher peak velocities. Nevertheless, there were significant correlations between the segmental radial and long-axis peak velocities (systole and diastole) obtained from both techniques, 0.44<r<0.65 with p<0.001.Discussion
While two previous FT studies on children only investigated systolic strain / strain rate,11,13 the present study is the first to assess diastolic function in pediatric HCM patients via radial and long-axis peak velocities. Here, both TPM and FT demonstrate reduced diastolic function in patients, which is in agreement with previous studies on adults.12,18 However, the derived FT velocities are systematically lower than the directly measured TPM velocities. This underestimation might be explained by enhanced temporal averaging for FT. First, the temporal resolution of the cine images is lower (30±5ms vs. 23.5±0.6ms for TPM), and second, more importantly, the FT algorithm needs at least two time points to derive one velocity value, whereas TPM directly measures the velocity for each time point. Thus, the effective temporal resolution for FT velocities is more than two times lower than for TPM. For future studies it might be beneficial to use high temporal resolution cine images20 for FT applicationsConclusion
Both TPM and FT show decreased diastolic myocardial velocities in HCM patients, suggesting reduced myocardial relaxation despite normal LVEF. This may be an early indicator of disease and helpful in multiparametric HCM patient analysis. This study further shows that FT systematically underestimates myocardial velocities compared to directly measured TPM velocities. This implies that a quantitative comparison of velocities obtained from different techniques needs to be treated carefully.Acknowledgements
Grant support by the National Institute of Heart, Lung and Blood Disorders (NHLBI) R01 HL 117888.References
1. Hennig J, Schneider B, Peschl S, Markl
M, Laubenberger TKJ. Analysis of Myocardial Motion Based on Velocity
Measurements with a Black Blood Prepared Segmented Gradient-Echo Sequence:
Methodology and Applications to Normal Volunteers and Patients. J Magn Reson
Imaging. 1998;8:868–77.
2. Jung B,
Föll D, Böttler P, Petersen S, Hennig J, Markl M. Detailed Analysis of
Myocardial Motion in Volunteers and Patients Using High-Temporal-Resolution MR
Tissue Phase Mapping. J Magn Reson
Imaging. 2006;24:1033–9.
3. Föll D, Jung B, Schilli E, Staehle F,
Geibel A, Hennig J, et al. Magnetic Resonance Tissue Phase Mapping of
Myocardial Motion: New Insight in Age and Gender. Circ Cardiovasc Imaging.
2010;3:54–64.
4. Lin K, Chowdhary V, Benzuly KH, Yancy CW, Lomasney JW, Rigolin VH, et al. Reproducibility and observer variability of tissue phase mapping for the quantification of regional myocardial velocities. Int J Cardiovasc Imaging. 2016;32:1227–34.
5. Foell D, Jung B, Germann E, Staehle F, Bode C, Markl M. Hypertensive heart disease: {MR} tissue phase mapping reveals altered left ventricular rotation and regional myocardial long-axis velocities. Eur Radiol. 2013;23:339–47.
6. Markl M, Rustogi R, Galizia M, Goyal A, Collins J, Usman A, et al. Myocardial T2-Mapping and Velocity Mapping: Changes in Regional Left Ventricular Structure and Function after Heart Transplantation. Magn Reson Med. 2013;70:517–26.
7. Collins J, Sommerville C, Magrath P, Spottiswoode B, Freed BH, Benzuly KH, et al. Extracellular Volume Fraction Is More Closely Associated With Altered Regional Left Ventricular Velocities Than Left Ventricular Ejection Fraction in Nonischemic Cardiomyopathy. Circ Cardiovasc Imaging. 2014;8:e001998.
8. von Knobelsdorff-Brenkenhoff F, Hennig P, Menza M, Dieringer MA, Foell D, Jung B, et al. Myocardial Dysfunction in Patients With Aortic Stenosis and Hypertensive Heart Disease Assessed by MR Tissue Phase Mapping. J Magn Reson Imaging. 2016;44:168–77.
9. Chang M-C, Wu M-T, Weng K-P, Su M-Y, Menza M, Huang H-C, et al. Left ventricular regional myocardial motion and twist function in repaired tetralogy of Fallot evaluated by magnetic resonance tissue phase mapping. Eur Radiol. 2017;doi:10.1007/s00330-017-4908-7.
10. Hor KN, Gottliebson WM, Carson C, Wash E, Cnota J, Fleck R, et al. Comparison of Magnetic Resonance Feature Tracking for Strain Calculation With Harmonic Phase Imaging Analysis. JACC Cardiovasc Imaging. 2010;3:144–51.
11. Smith BM, Dorfman AL, Yu S, Russell MW, Agarwal PP, Ghadimi Mahani M, et al. Relation of Strain by Feature Tracking and Clinical Outcome in Children, Adolescents, and Young Adults With Hypertrophic Cardiomyopathy. Am J Cardiol. 2014;114:1275–80.
12. Nucifora G, Muser D, Gianfagna P, Morocutti G, Proclemer A. Systolic and diastolic myocardial mechanics in hypertrophic cardiomyopathy and their link to the extent of hypertrophy, replacement fibrosis and interstitial fibrosis. Int J Cardiovasc Imaging. 2015;31:1603–10.
13. Bogarapu S, Puchalski MD, Everitt MD, Williams R V., Weng HY, Menon SC. Novel Cardiac Magnetic Resonance Feature Tracking (CMR-FT) Analysis for Detection of Myocardial Fibrosis in Pediatric Hypertrophic Cardiomyopathy. Pediatr Cardiol. 2016;37:663–73.
14. Jing L, Wehner GJ, Suever JD, Charnigo RJ, Alhadad S, Stearns E, et al. Left and right ventricular dyssynchrony and strains from cardiovascular magnetic resonance feature tracking do not predict deterioration of ventricular function in patients with repaired tetralogy of Fallot. J Cardiovasc Magn Reson. 2016;18:49.
15. Orwat S, Diller G-P, Kempny A, Radke R, Peters B, Kühne T, et al. Myocardial deformation parameters predict outcome in patients with repaired tetralogy of Fallot. Heart. 2016;102:209–15.
16. Gersh BJ, Maron BJ, Bonow RO, Dearani JA, Fifer MA, Link MS, et al. 2011 ACCF/AHA Guideline for the Diagnosis and Treatment of Hypertrophic Cardiomyopathy: Executive Aummary: A report of the American College of Cardiology Foundation/American Heart Association Task Force on Practice Guidelines. Circulation. 2011;124:2761–96.
17. Young AA, Kramer CM, Ferrari VA, Axel L, Reichek N. Three-Dimensional Left Ventricular Deformation in Hypertrophic Cardiomyopathy. Circulation. 1994;90:854–67.
18. Ennis DB, Epstein FH, Kellman P, Fananapazir L, McVeigh ER, Arai AE. Assessment of Regional Systolic and Diastolic Dysfunction in Familial Hypertrophic Cardiomyopathy Using MR Tagging. Magn Reson Med. 2003;50:638–42.
19. Jung B, Honal M, Ullmann P, Hennig J, Markl M. Highly k-t-Space-Accelerated Phase-Contrast MRI. Magn Reson Med. 2008;60:1169–77.
20. Krishnamurthy R, Cheong B, Pednekar A, Muthupillai R. High-temporal resolution (<6 ms) Cine Steady-State Free Precession (SSFP) imaging for assessing LV diastolic function. J Cardiovasc Magn Reson. 2009;11(Suppl 1):P74.
Figures