0363
Non-invasive pressure-volume loops from cardiovascular magnetic resonance and brachial pressure1Department of Clinical Physiology, Skåne University Hospital, Lund University, Lund, Sweden, 2Department of Biomedical Engineering, Faculty of Engineering, Lund University, Lund, Sweden
Synopsis
Cardiac pressure-volume loop analysis provides important information on cardiac function, but is currently not widely utilized clinically since invasive measurements are required. This study aimed to develop and validate a non-invasive method of estimating pressure-volume loops, via a model-based framework using cardiovascular magnetic resonance. The method yields individualized pressure-volume loops computed using time-varying elastance, with left ventricular volume and brachial pressure as input. Experimental validation showed strong agreement to in-vivo measurements, and application to healthy controls and heart failure patients yielded expected results. Hence, the model is a promising method for obtaining pressure-volume loops from magnetic resonance imaging.
Introduction
Pressure-volume (PV) loop analysis provides a wealth of clinically important information on cardiovascular function such as stroke work and ventricular efficiency [1]. PV-loops are generated by time-resolved recording of ventricular pressure and volume. The gold standard for measuring volumes in the heart is cardiovascular magnetic resonance (CMR), but absolute pressure can only be measured invasively. Invasive pressure measurements carry a risk for the patient and are not recommended for repeated application [2]. Hence, PV-loops are not readily available in clinical routine or in clinical trials. This study aimed to expand the capabilities of CMR by combining imaging with mathematical modeling, in order to develop and validate a framework for computing individualized PV-loops non-invasively.Methods
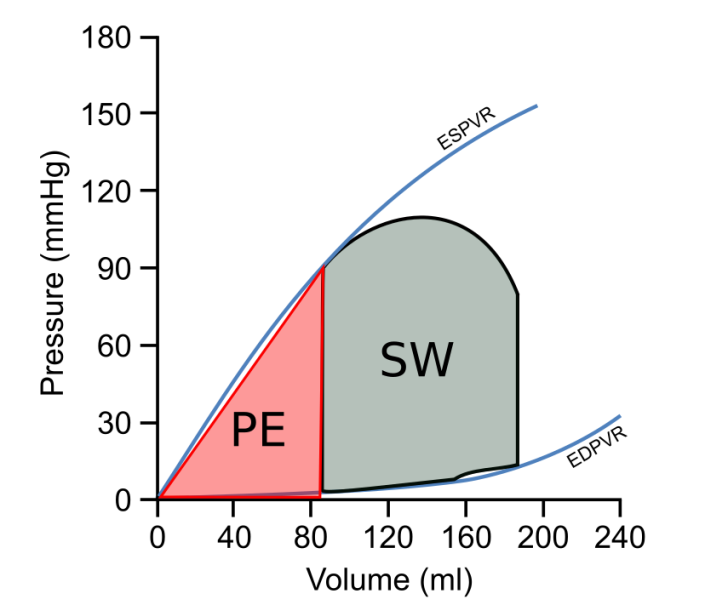
The method is based on a model of the time-varying elastance, represented by the double-Hill equation [3,4]. Model input was used to scale the elastance model in amplitude and time. Input data was non-invasive pressure by cuff sphygmomanometry, and a time-resolved left ventricular (LV) volume curve delineated from short-axis cine steady-state-free-precession CMR images. Ten pigs were included for training (n=5) and validation (n=5) purposes. In the training set, LV elastance curves were derived from measurements obtained by a PV-transducer. The pigs in the validation set underwent CMR, cuff pressure in the tail, and invasive LV pressure catheterization. Furthermore, the model was applied to healthy controls (n=13) and heart failure patients (n=28) who underwent CMR and brachial cuff pressure measurements. The double-Hill equation parameters were optimized using the in-vivo data in the training set. Validation was performed by comparing stroke work, mechanical potential energy and ventricular efficiency (see Figure 1) calculated from in-vivo measured and model derived PV-loops. The model was implemented as a plugin in the software Segment 2.1 R5752 (http://segment.heiberg.se) [5], and is available upon requests for research collaborations.Results
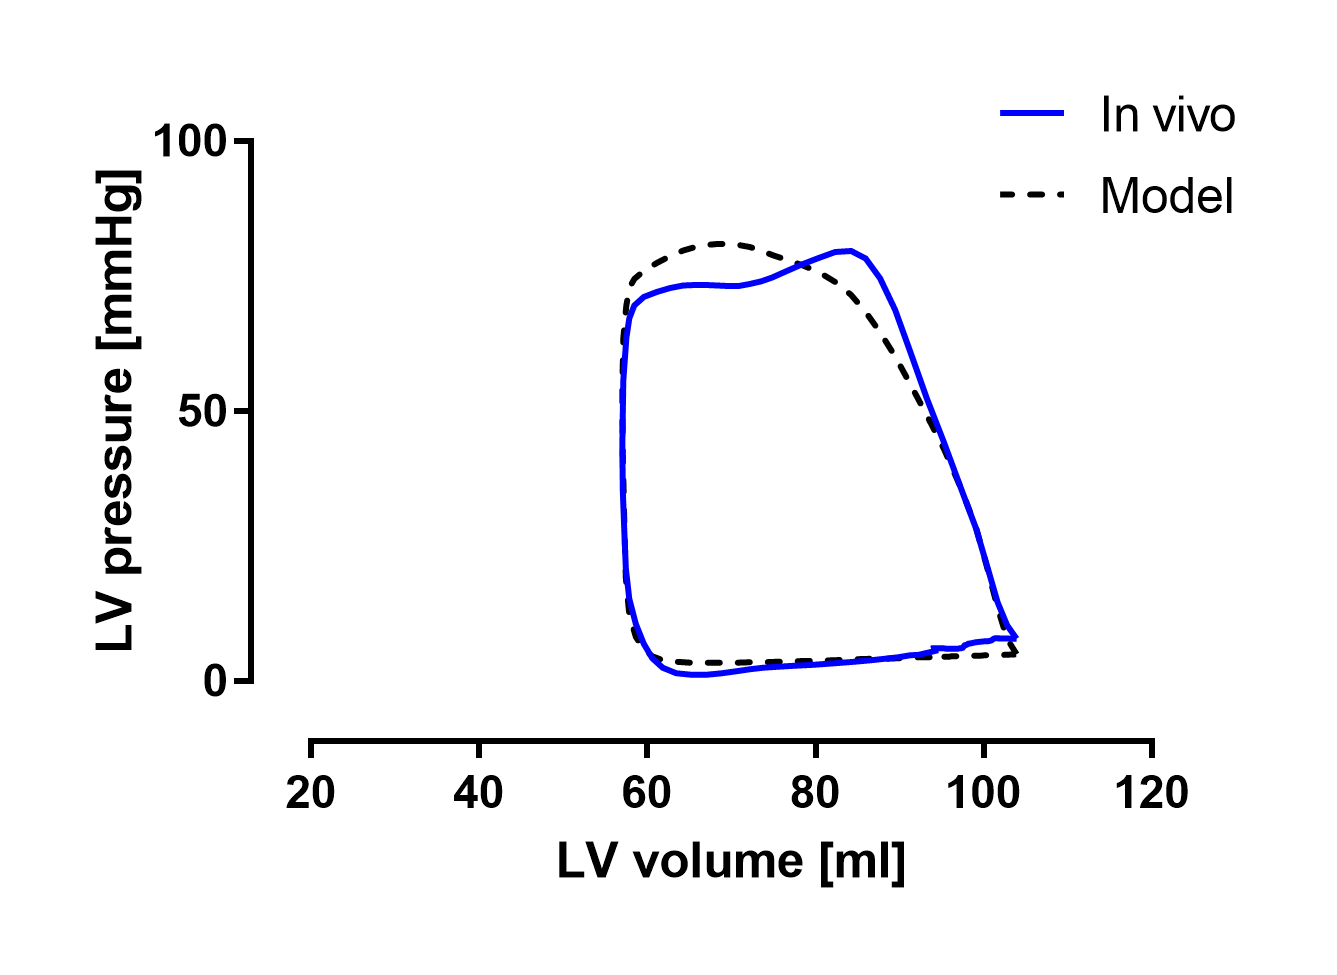
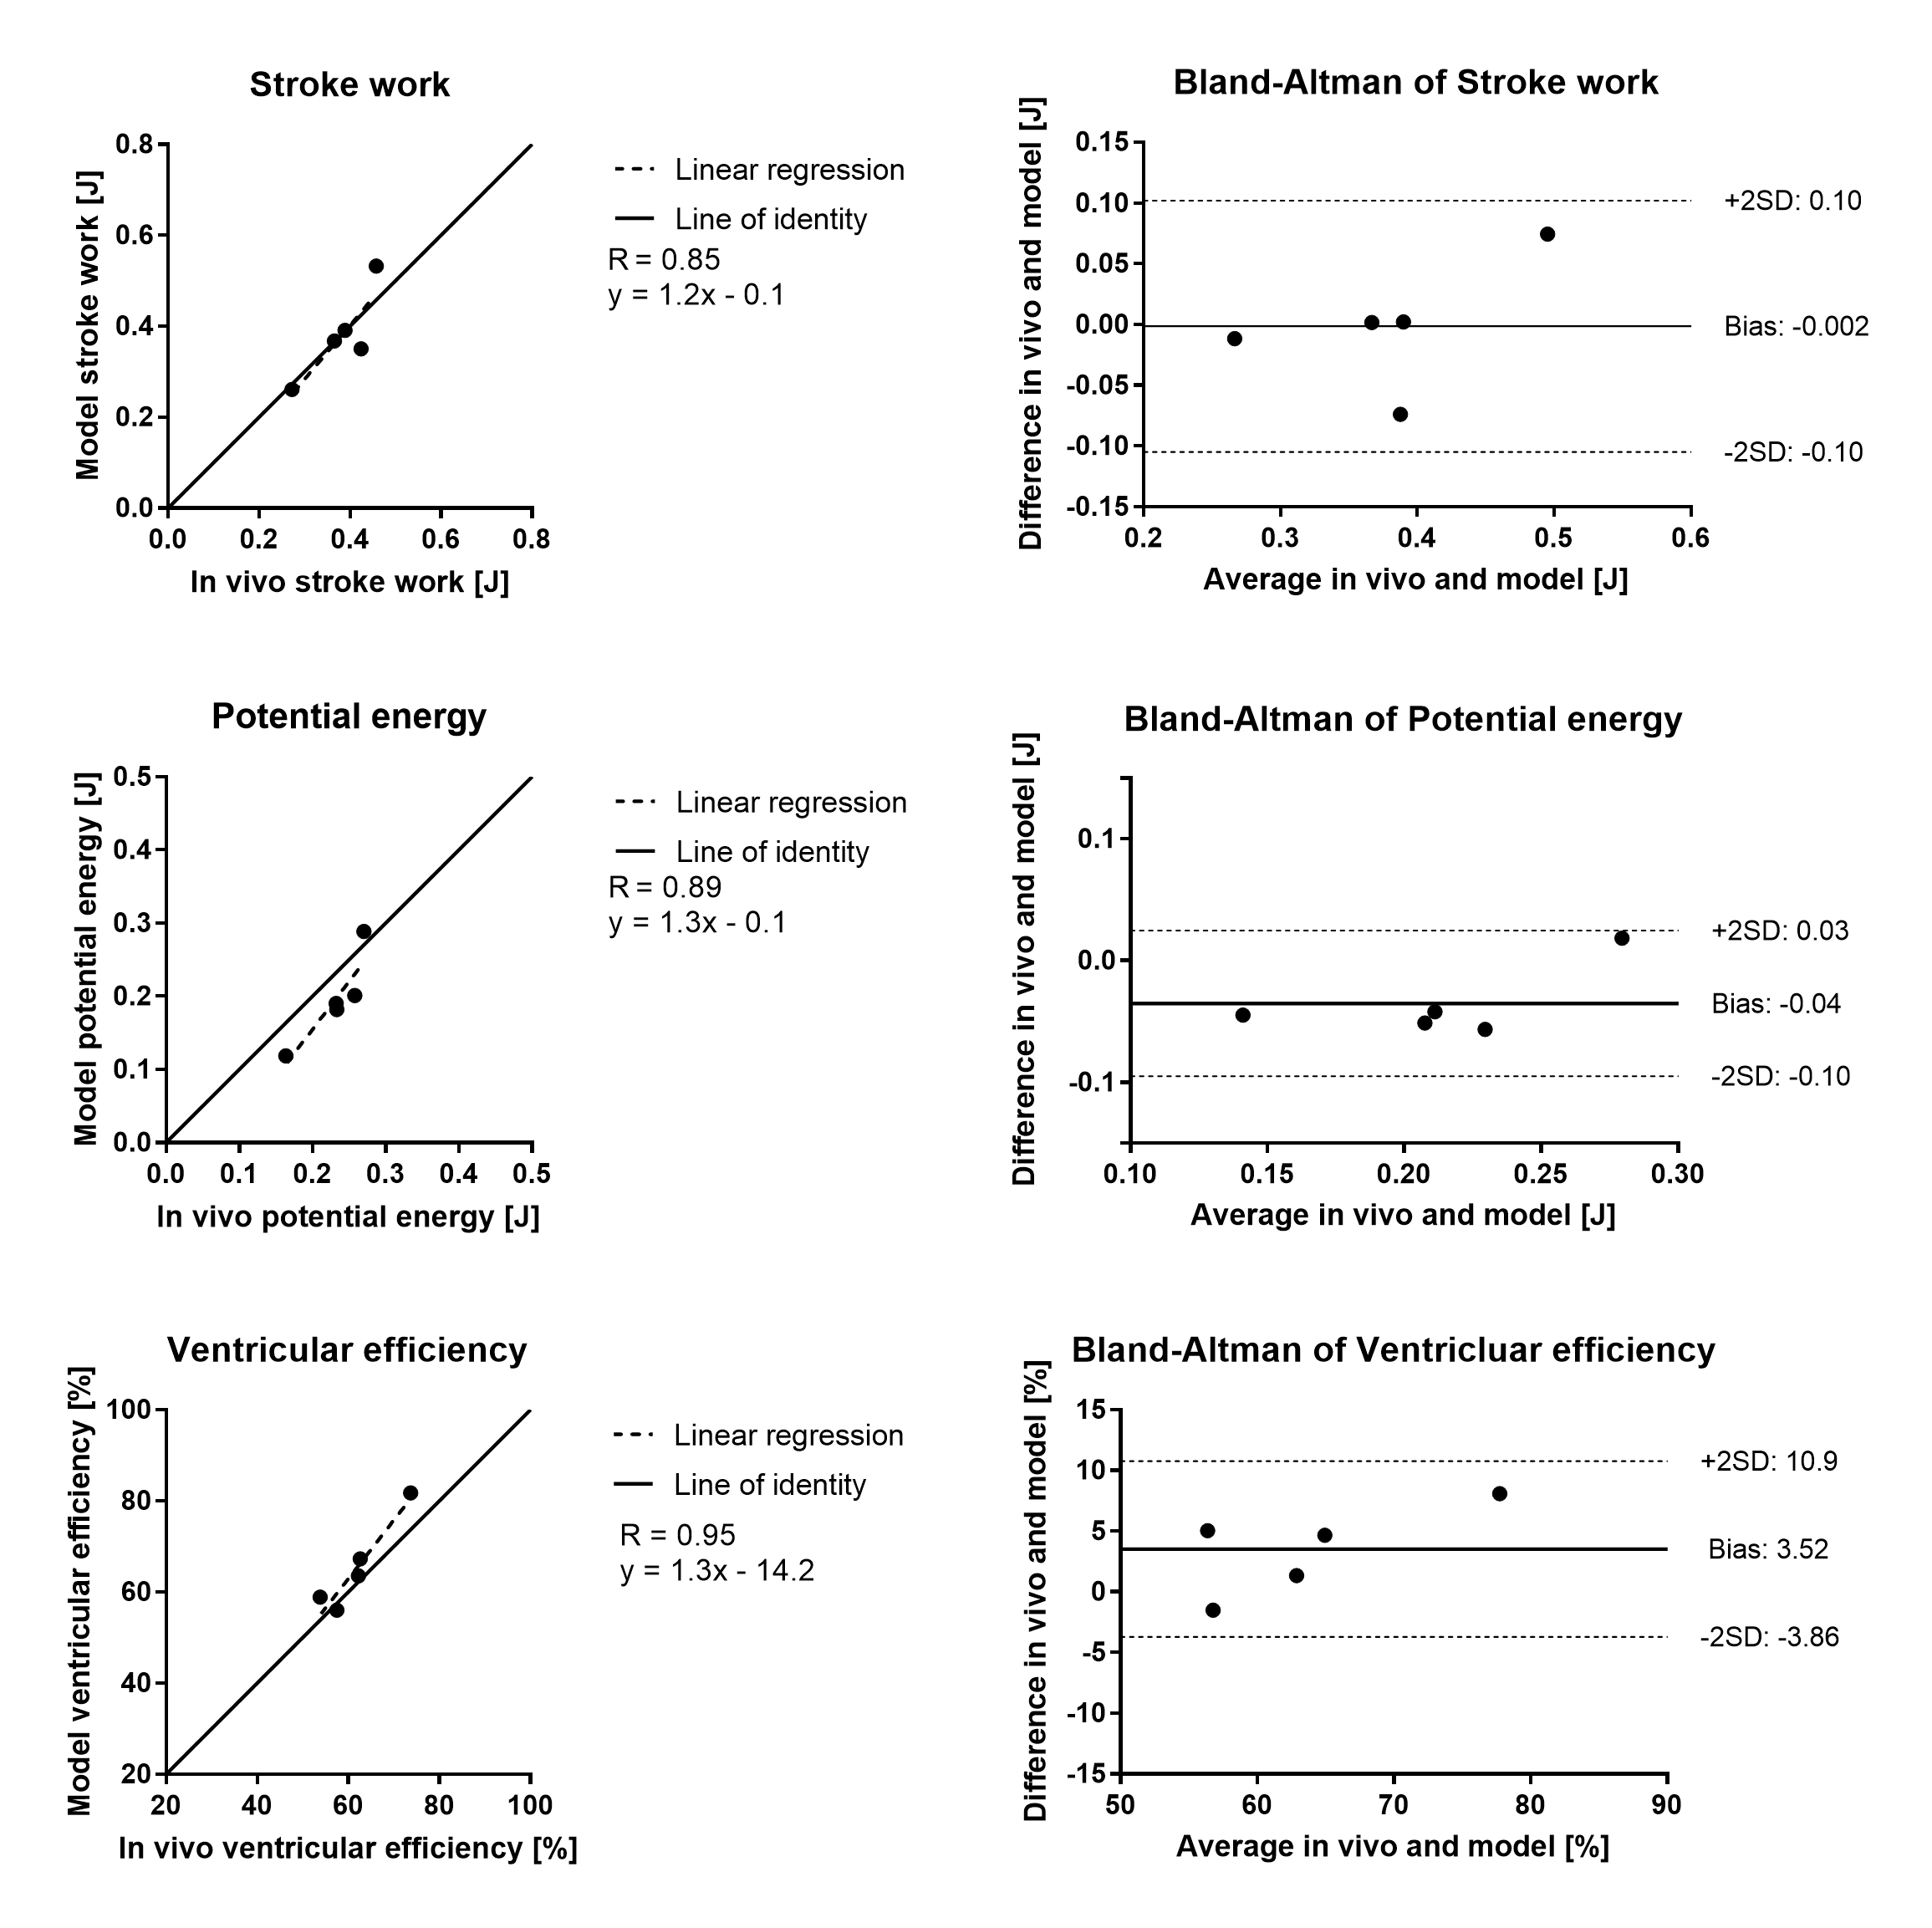
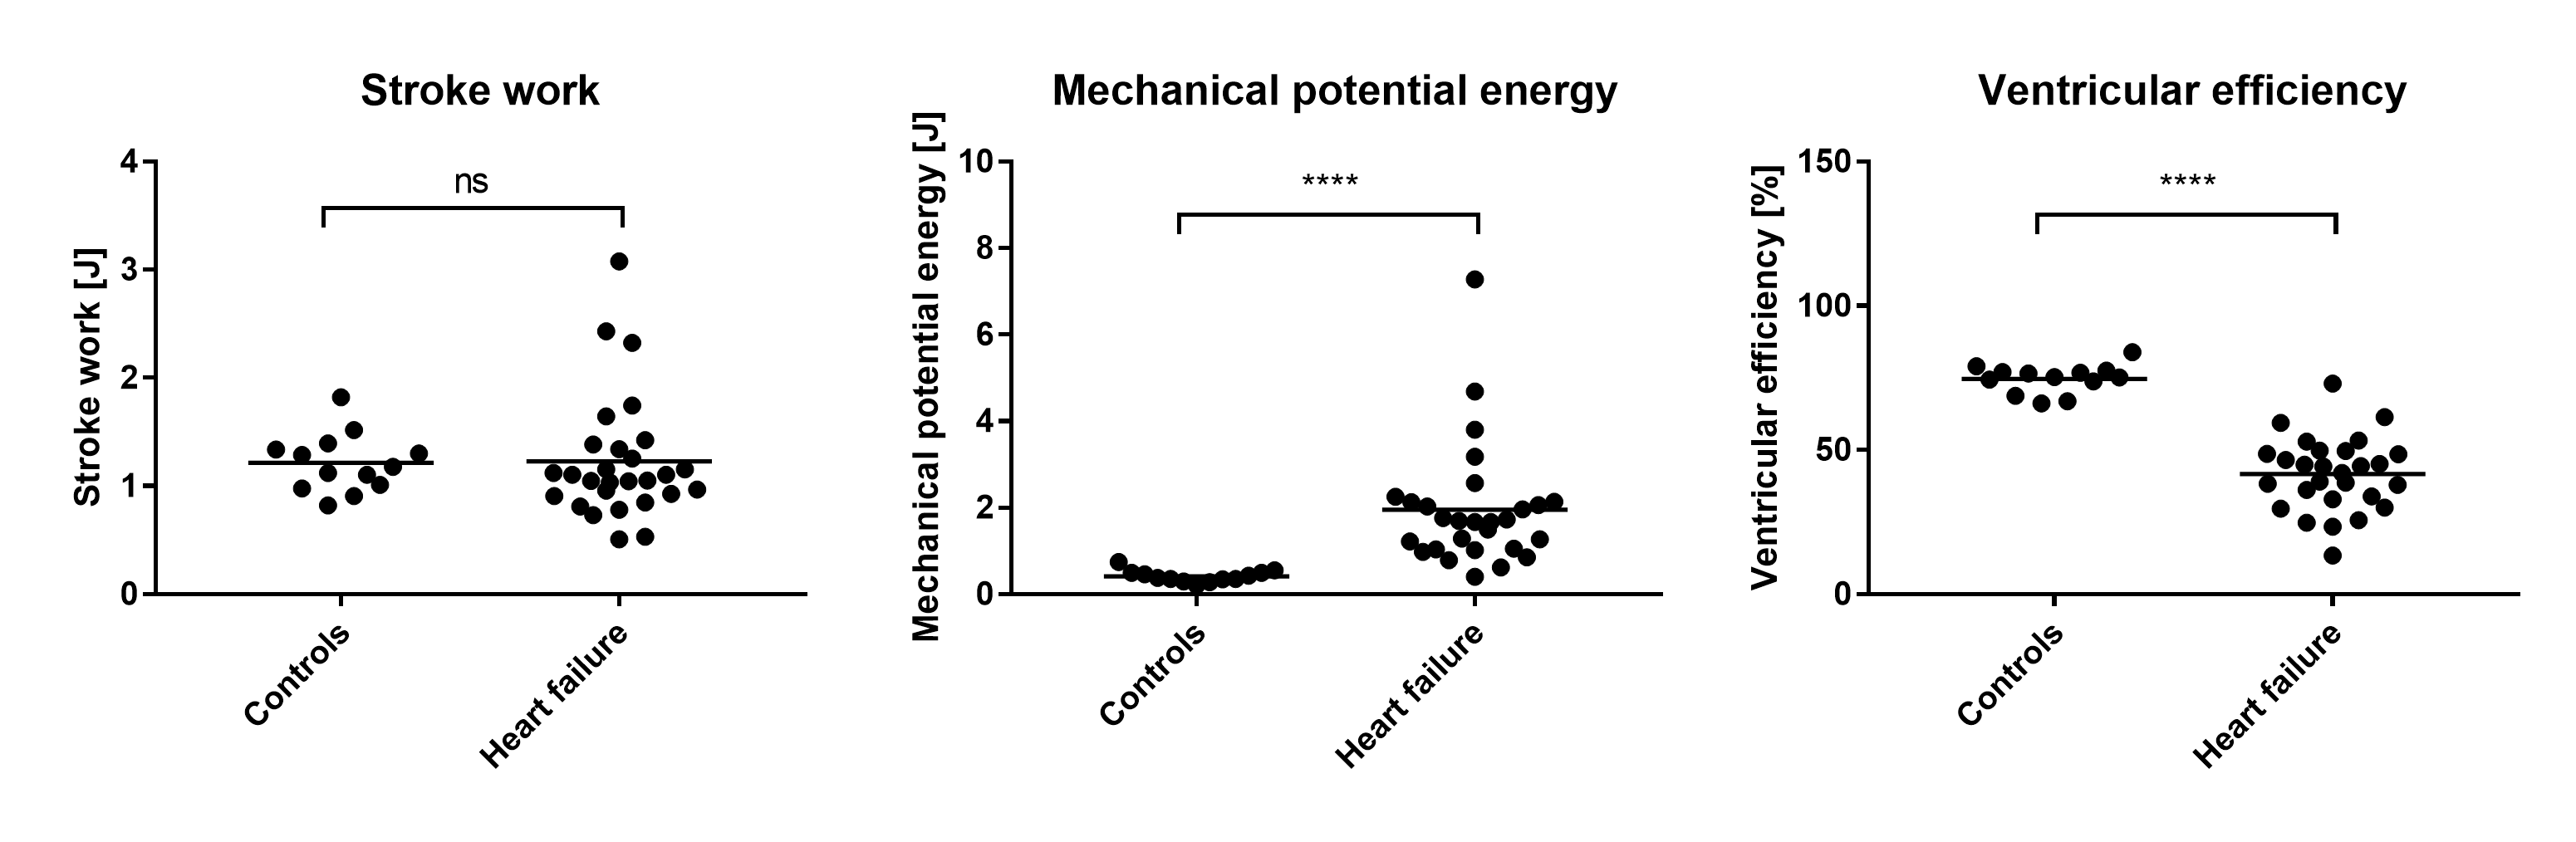
A model calculated PV-loop is shown together with the corresponding in-vivo measured data in Figure 2. There was a strong agreement between in-vivo measured and model calculated stroke work (R=0.85, bias -0.002±0.05 J), mechanical potential energy (R=0.89, bias -0.04±0.03 J) and ventricular efficiency (R=0.95, bias 3.52±3.69%), see Figure 3. As shown in Figure 4, the model yielded lower ventricular efficiency (p<0.0001) in patients compared to controls, and a higher potential energy (p<0.0001). There was no difference in stroke work between the cohorts. Furthermore, the model produced realistic values of stroke work, and physiologically representative PV-loops.Conclusions
The proposed model is the first validated, non-invasive method to derive individualized left ventricular pressure-volume loops and associated quantitative measures, for potential use in the clinic or in clinical trials. The experimental validation showed a strong agreement between model output and in-vivo derived measurements. Application in healthy controls and heart failure patients yielded expected cohort differences.
Acknowledgements
No acknowledgement found.References
1. Burkhoff D, Mirsky I, Suga H. Assessment of systolic and diastolic ventricular properties via pressure-volume analysis: a guide for clinical, translational, and basic researchers. AJP Hear Circ Physiol 2005;289:H501–H512.
2. Braunwald E, Zipes DP, Libby P. Heart Disease: A textbook of Cardiovascular Medicine. 6th ed. Philadelphia; London: Saunders Company; 2001.
3. Suga H, Sagawa K, Shoukas a a. Load independence of the instantaneous pressure-volume ratio of the canine left ventricle and effects of epinephrine and heart rate on the ratio. Circ Res 1973;32:314–322.
4. Stergiopulos N, Meister JJ, Westerhof N. Determinants of stroke volume and systolic and diastolic aortic pressure. Am J Physiol 1996;270:H2050-9.
5. Heiberg E, Sjögren J, Ugander M, Carlsson M, Engblom H, Arheden H. Design and validation of Segment - freely available software for cardiovascular image analysis. BMC Med Imaging 2010;10:1.
Figures