0360
Feasibility of absolute myocardial blood flow quantification using Simultaneous Multi Slice (SMS) SSFP first-pass myocardial perfusion imaging and iterative reconstruction at 1.5 Tesla.1Biomedical Engineering and Imaging Sciences, King's College London, London, United Kingdom, 2MR Research Collaborations, Siemens Healthcare Limited, Frimley, United Kingdom, 3Siemens Healthcare, Erlangen, Germany, 4The Centre for Advanced Imaging, The University of Queensland, Brisbane, Australia
Synopsis
Quantification of myocardial blood flow (MBF) enhances diagnosis and provides prognostic information. Simultaneous Multi Slice (SMS) imaging allows greater spatial coverage of the heart with minimal signal-to-noise penalty and is thus desirable for perfusion imaging. 5 patients underwent two rest perfusion scans using a dual-bolus technique with SMS protocol (6 slices) and iterative reconstruction and standard 3 slice bSSFP sequence. Absolute MBF was quantified with a fermi-constrained deconvolution algorithm. Global and territorial MBF was comparable between the different methods. Future evaluation in patients with stress testing and greater heart coverage may provide clinical utility in patients with coronary artery disease.
Introduction
Cardiac Magnetic Resonance (CMR) first-pass myocardial perfusion imaging has limited spatial coverage to 3 slices in routine clinical practice. PET (Positron Emission Tomography) provides true whole heart coverage and is considered the in vivo gold standard for quantification of myocardial blood flow (MBF). 1 MBF quantification with CMR is feasible using a dual-bolus or dual-sequence approach and a Fermi-constrained deconvolution algorithm can be used to calculate MBF. 2 Simultaneous multi-slice (SMS) imaging is an acceleration technique which enables simultaneous acquisition of multiple slices with potential to increase spatial coverage of CMR perfusion. 3 In addition, SMS acquisition can be further accelerated using undersampled acquisition which can then be reconstructed using parallel imaging or compressed sensing techniques. 4 We sought to determine the feasibility of quantification of absolute MBF in 6-slices with SMS imaging and L1-regularized iterative reconstruction and compare to a standard 3 slice approach.Methods
Five patients were recruited and imaged at 1.5T (MAGNETOM Aera, Siemens Healthcare, Erlangen, Germany). Two rest contrast perfusion protocols were acquired in random order using standard bSSFP imaging (3-slices) and a prototype SMS bSSFP sequence (6-slices) in each patient using a dual-bolus technique with 0.0075 + 0.075mmol/kg of Gadovist (Bayer, Berlin, Germany) as previously described. 5 The two protocols were separated by a minimum time interval of 15 minutes to allow for contrast washout and the imaging parameters were matched between sequences (TR/TE/α: 2.9ms/1.24ms/50° [SMS], TR/TE/α: 2.5ms/1.04ms/50° [standard], voxel size: 1.9x1.9mm2, slice thickness: 10mm, FOV: 332x332mm2, TI 120ms [SMS] 105ms [standard], bandwidth 1093Hz/px). SMS data were reconstructed using a non-linear iterative reconstruction with L1 regularization in wavelet space (SMS-iter). 4 Standard bSSFP and SMS data were also reconstructed using standard TGRAPPA reconstruction. 6 Images were processed using an in-house non-rigid motion correction method implemented in Matlab (The MathWorks, Natick, MA, USA). The endocardium and epicardium were manually segmented and the Arterial Input Function (AIF) obtained from the left ventricular (LV) blood pool cavity of the corresponding slice. Global and territory absolute MBF was quantified using a Fermi-constrained deconvolution algorithm. 7Results
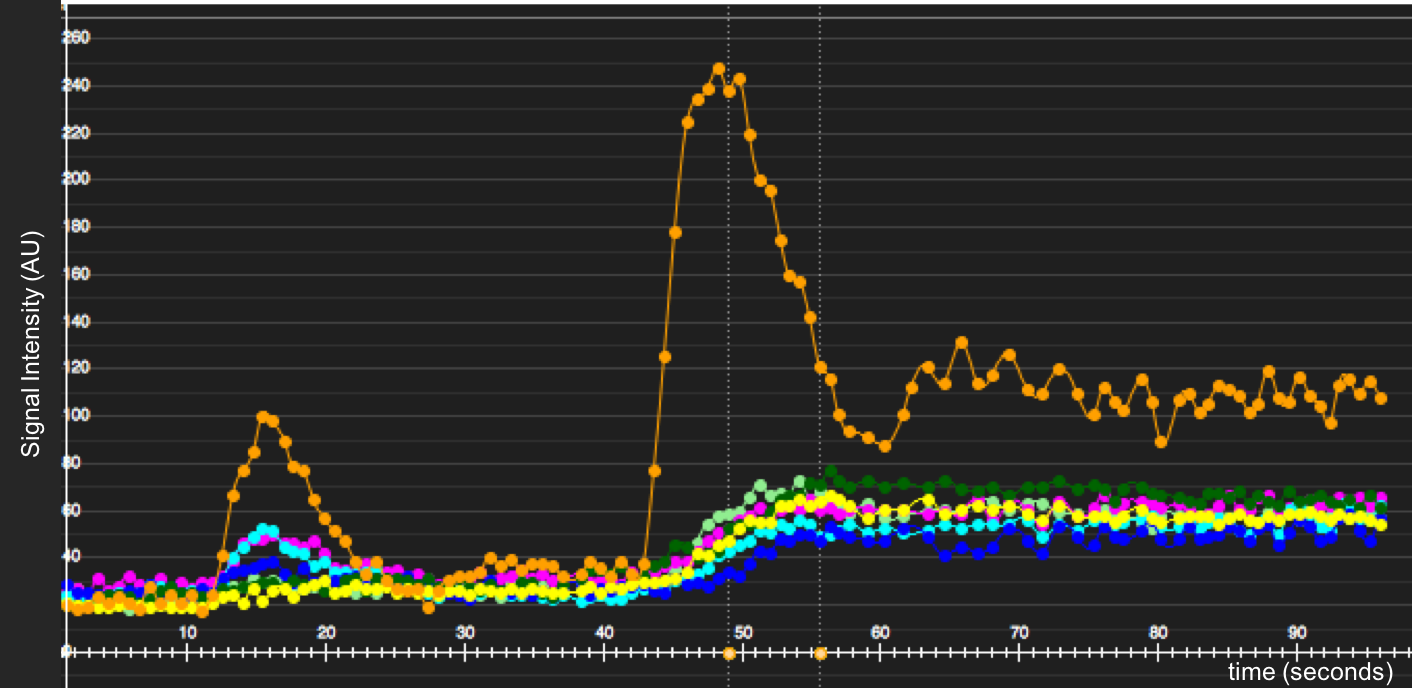
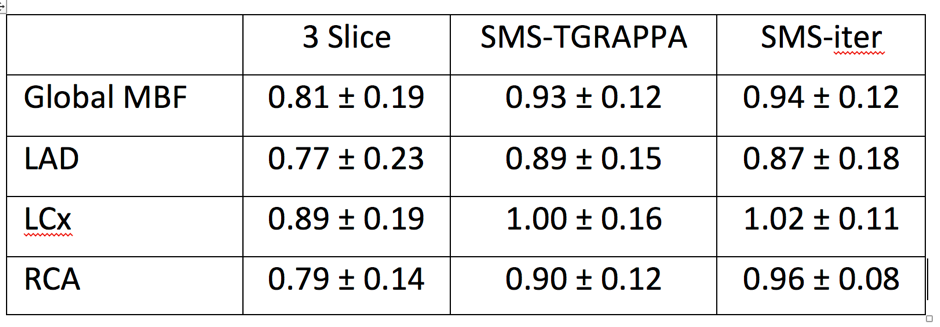
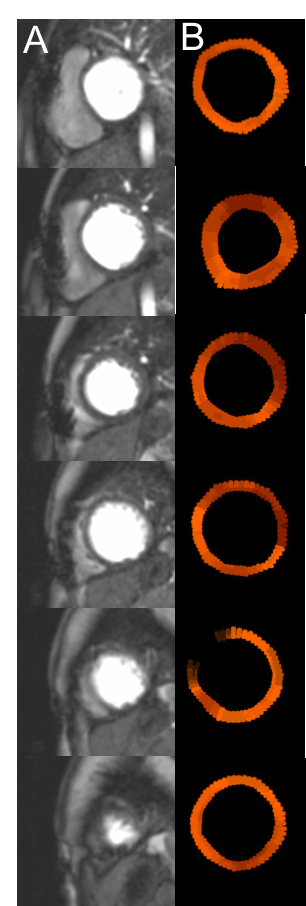
Figure 1 demonstrates signal intensity-time curves of the myocardial tissue and the AIF from the LV blood pool. There was no significant difference in absolute global MBF when quantified with 3 slice, SMS-TGRAPPA and SMS-iter (figure 2). In addition, there was no significant difference of MBF values on the territory level between the three methods (all p>0.05). Finally, all MBF values were within the expected range for a normal resting perfusion (0.42 – 1.41 mL/g/min). Figure 3 provides a comparison between peak LV contrast and fully quantified pixel wise MBF maps for corresponding slices with SMS-iter.Discussion
In this study, we demonstrate the feasibility of fully quantitative absolute MBF using SMS imaging in 6 slices with greater spatial coverage of the heart without prolongation of scan duration. The AIF was sampled from the LV blood pool cavity from the corresponding slice. However, the sampling location of the AIF is of much debate, and SMS imaging may provide extended coverage to sample the AIF from alternative locations such as the proximal aorta, which may provide more accurate absolute MBF values. Furthermore, MBF quantification is gaining widespread interest as it may remove the observer variability of dynamic perfusion imaging.Conclusion
Fully quantitative absolute MBF is feasible in patients with SMS imaging with 6-slice myocardial coverage. Future work may investigate quantitative MBF values with whole-heart stress testing in patients with ischaemic heart disease to generate truly objective parameters of ischaemia and potentially provide improved diagnostic and prognostic data for patients.Acknowledgements
This study received funding from NIHR Healthcare Technology Co-operative for Cardiovascular Disease at Guy’s and St Thomas’ NHS Foundation Trust and was supported by a fellowship from the Medical Research Council for MSN. This work was also supported by the Wellcome EPSRC Centre for Medical Engineering at King’s College London (WT 203148/Z/16/Z), and the EPSRC grant (EP/R010935/1).References
1. Bratis K, Mahmoud I, Chiribiri A, Nagel E. Quantitative myocardial perfusion imaging by cardiovascular magnetic resonance and positron emission tomography. Journal of Nuclear Cardiology 2013;20:860-70; quiz 857-9, 871-3.
2. Jerosch-Herold M. Quantification of myocardial perfusion by cardiovascular magnetic resonance. JCardiovascMagnReson 2010;12:57.
3. Stäb D, Wech T, Breuer FA et al. High resolution myocardial first-pass perfusion imaging with extended anatomic coverage. Journal of Magnetic Resonance Imaging 2014;39:1575-1587.
4. Lustig M, Donoho D, Pauly JM. Sparse MRI: The application of compressed sensing for rapid MR imaging. MagnResonMed 2007;58:1182-1195.
5. Ishida M, Schuster A, Morton G et al. Development of a universal dual-bolus injection scheme for the quantitative assessment of myocardial perfusion cardiovascular magnetic resonance. JCardiovascMagnReson 2011;13:28.
6. Breuer FA, Kellman P, Griswold MA, Jakob PM. Dynamic autocalibrated parallel imaging using temporal GRAPPA (TGRAPPA). Magnetic resonance in medicine : official journal of the Society of Magnetic Resonance in Medicine / Society of Magnetic Resonance in Medicine 2005;53:981-5.
7. Jerosch-Herold M, Seethamraju RT, Swingen CM, Wilke NM, Stillman AE. Analysis of myocardial perfusion MRI. J Magn Reson Imaging 2004;19:758-70.
Figures