0354
Staging hemodynamic failure: BOLD fMRI cerebrovascular reactivity beats [15O]-H2O-PET.1Neuroradiology, University Hospital Zurich, Zurich, Switzerland, 2Neurosurgery, University Hospital Zurich, Zurich, Switzerland, 3Pharmacology & Toxicology, University Hospital Zurich, Zurich, Switzerland, 4Neurology, University Hospital Zurich, Zurich, Switzerland, 5Nuclear Medicine, University Hospital Zurich, Zurich, Switzerland
Synopsis
The actual gold standard stroke risk assessment is cerebral blood flow (CBF) measured with [15O]-H2O-PET, which is available only in few specialized centers and requires ~1mSv radioactive dose.
Otherwise, quantitative CVR measurements derived (with our temporal decomposition iterative algorithm) from Blood-Oxygen-Level-Dependent (BOLD) fMRI with CO2 challenge might apply as a surrogate imaging-marker for hemodynamic failure, as the <7 minutes acquisition can easily be clinically implemented, and has – as proved in this study – twice higher specificity*sensitivity for staging hemodynamic failure in chronic cerebrovascular steno-occlusive diseases than PET.
Therefore, BOLD CVR shall be widely implemented for assessing stroke risk.
Introduction
Among the various hemodynamic parameters associated with stroke risk in cerebrovascular diseases, such as cerebrovascular reactivity (CVR), mean transit time (MTT), cerebral blood volume (CBV), oxygen extraction fraction (OEF), cerebral metabolic rate of oxygen (CMRO2), the gold standard remains cerebral blood flow (CBF) measured with [15O]-H2O-Positron Emission Tomography (PET) due to the linear relationship between PET signal and CBF.
The degree of hemodynamic failure is estimated using an acetazolamide (=Diamox) challenge applied during a second PET scan. Hemodynamic failure described as “Stage0”: normal CBF and normal perfusion reserve, Stage1: normal CBF, decreased perfusion reserve, and Stage2: decreased CBF and decreased perfusion reserve, implies increasing stroke risk.
[15O]-H2O-PET examinations are available only in few specialized centers and requires a radioactive dose of ~1mSv. Otherwise quantitative CVR measurements derived from Blood-Oxygen-Level-Dependent (BOLD) fMRI might apply as a surrogate imaging-marker for hemodynamic failure, as the single and brief (<7 minutes) acquisition can easily be implemented on clinical MR scanners.
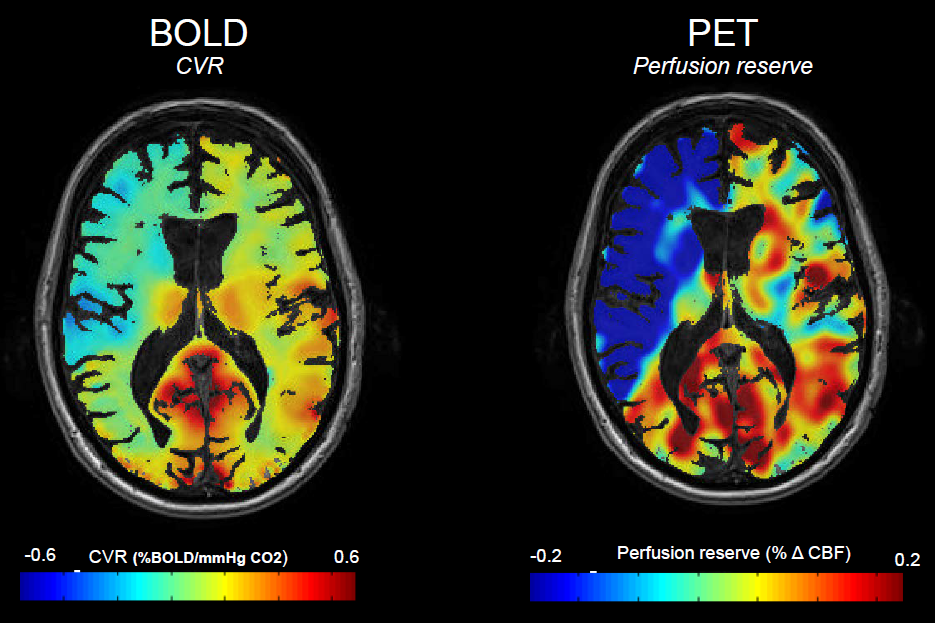
CVR, defined as the percentage change in BOLD signal per mmHg change in carbon dioxide (CO2), indicates how much cerebrovascular reserve remains in a given vascular bed. CVR reductions can range from a blunted increase in CBF in mild cases, to “paradoxical” reduction in regional CBF, indicating steal phenomenon, in severe cases.
Since quantitative BOLD CVR is only an indirect measurement of “perfusion reserve”, we investigated the utility of quantitative CVR as a surrogate imaging-marker for hemodynamic failure. Therefore, we studied patients with cerebrovascular steno-occlusive disease exhibiting unilateral hemodynamic failure that had undergone both Diamox challenged [15O]-H2O-PET and BOLD CVR exams.
Methods
Nineteen datasets of subjects with chronic cerebrovascular steno-occlusive disease (age 60±11, 4 females) and unilaterally impaired perfusion reserve on Diamox-challenged [15O]-H2O PET were compared to standardized BOLD fMRI + CO2 examinations.1
Hemodynamic failure was staged based on the qualitative PET scan by an experienced nuclear radiologist. Patients’ BOLD CVR values were compared between the three hemodynamic failure stages as determined on the qualitative PET.
Agreement between quantitative CBF (PET-based) and quantitative CVR (MR-based) perfusion reserve was assessed.
Finally, the agreement between BOLD CVR versus PET derived perfusion reserve for staging hemodynamic failure in the MCA territory was assessed.
Results
CVR were significantly lower in patients compared to healthy (0.11±0.07 vs. 0.23±0.03, p<0.01), and – interestingly –for both affected and unaffected hemisphere (p<0.01). Significant differences were found also between affected and unaffected hemispheres for both BOLD (0.08 vs 0.15, p<0.01) and PET (0.33 vs 0.47, p<0.01) and between the affected versus unaffected MCA perfusion territories (BOLD CVR: 0.04 vs 0.15, p<0.01; PET perfusion reserve: 0.19 vs 0.44, p<0.01).
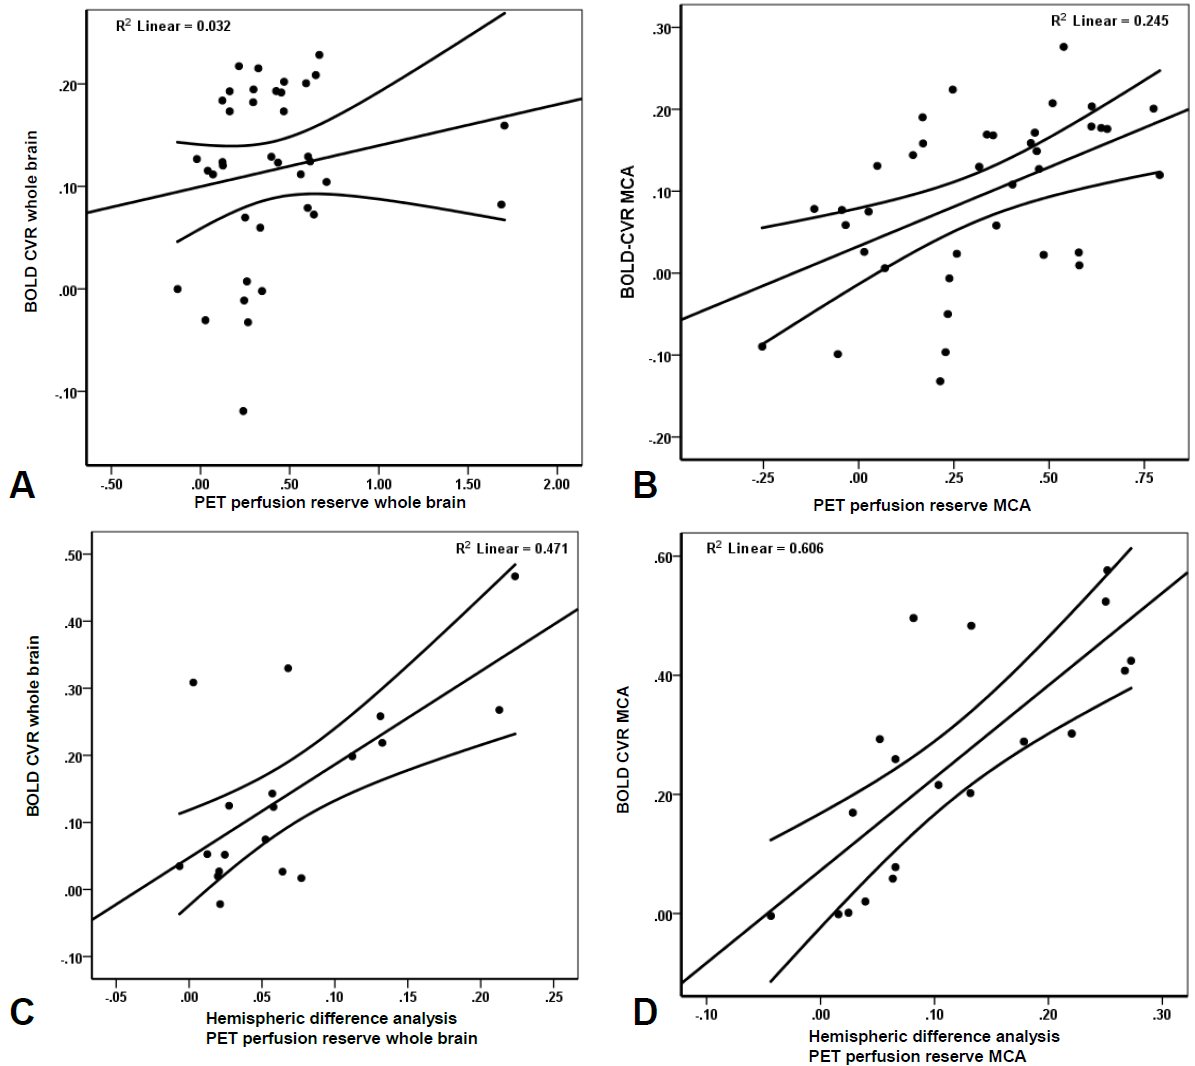
The quantitative BOLD CVR and PET of the MCA territories showed significant agreement, although weak (p= 0.02, R2= 0.25, Figure 2B). Interestingly, after subtracting the values of the affected hemisphere from the unaffected hemisphere (i.e. performing a difference analysis), a significant correlation was found for the hemispheric difference (p<0.01, R2=0.47, Figure 2C) as well as for the MCA territory (p<0.01, R2= 0.61, Figure 2D).
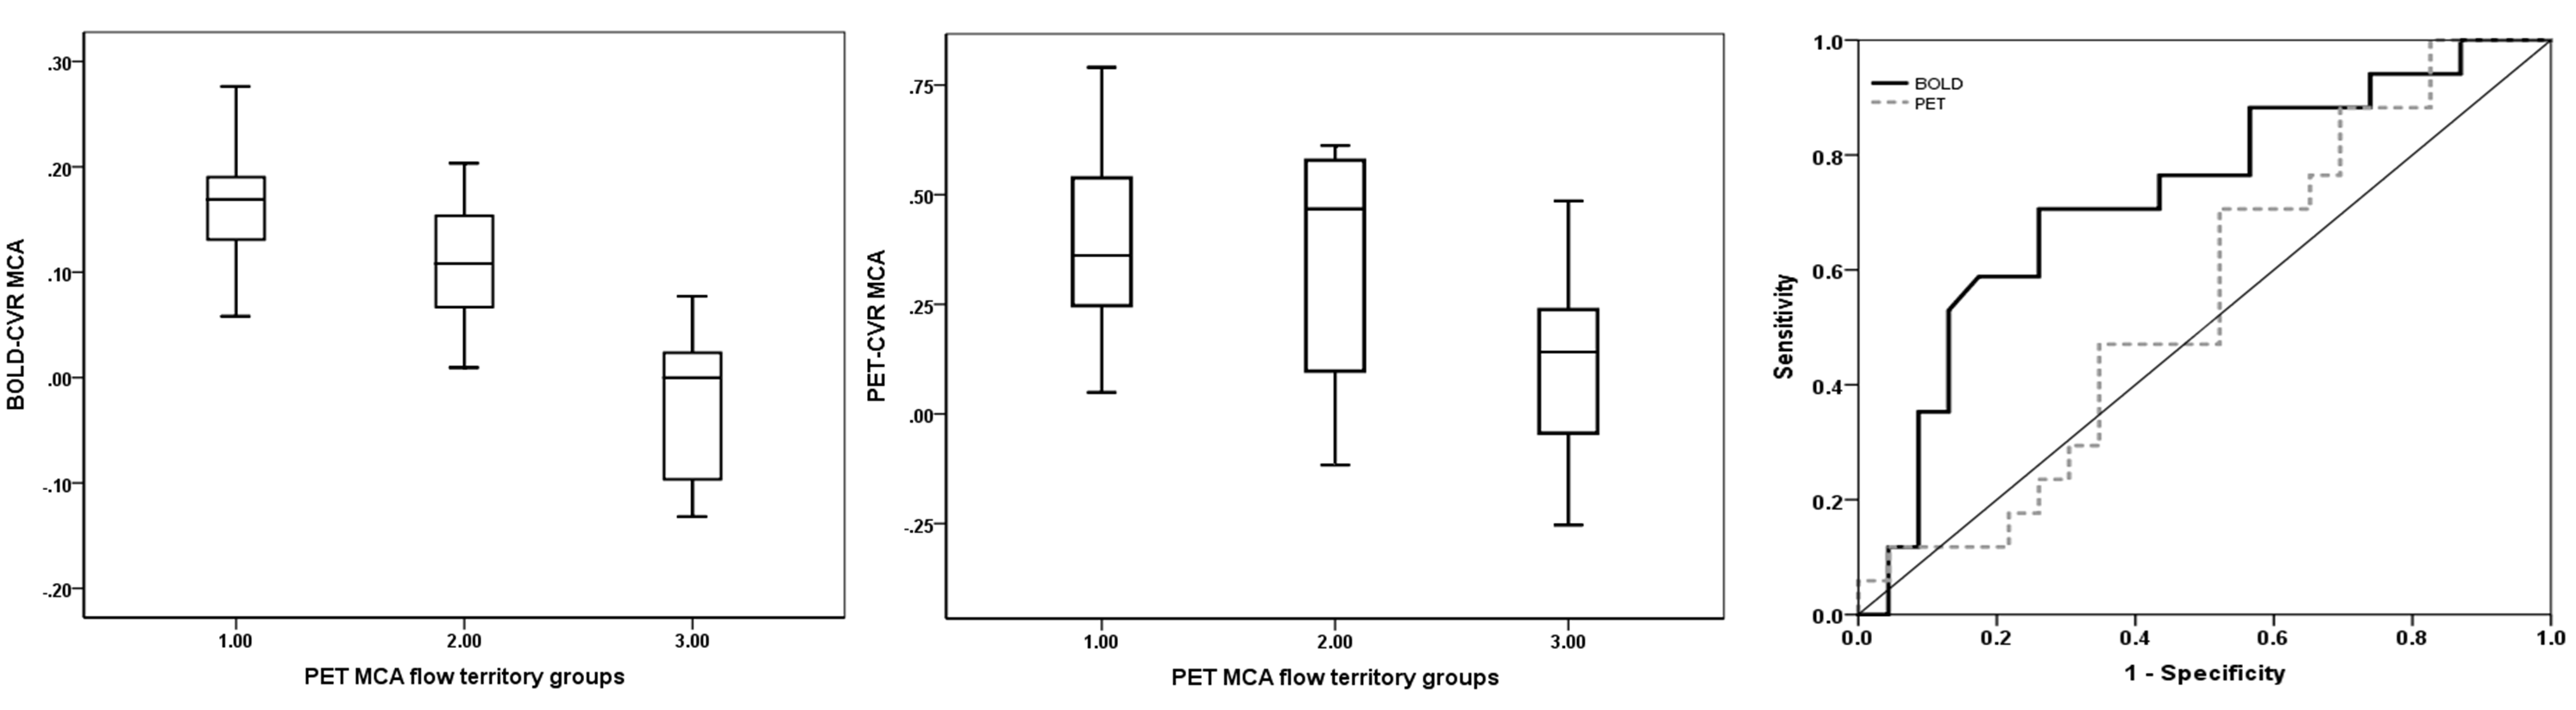
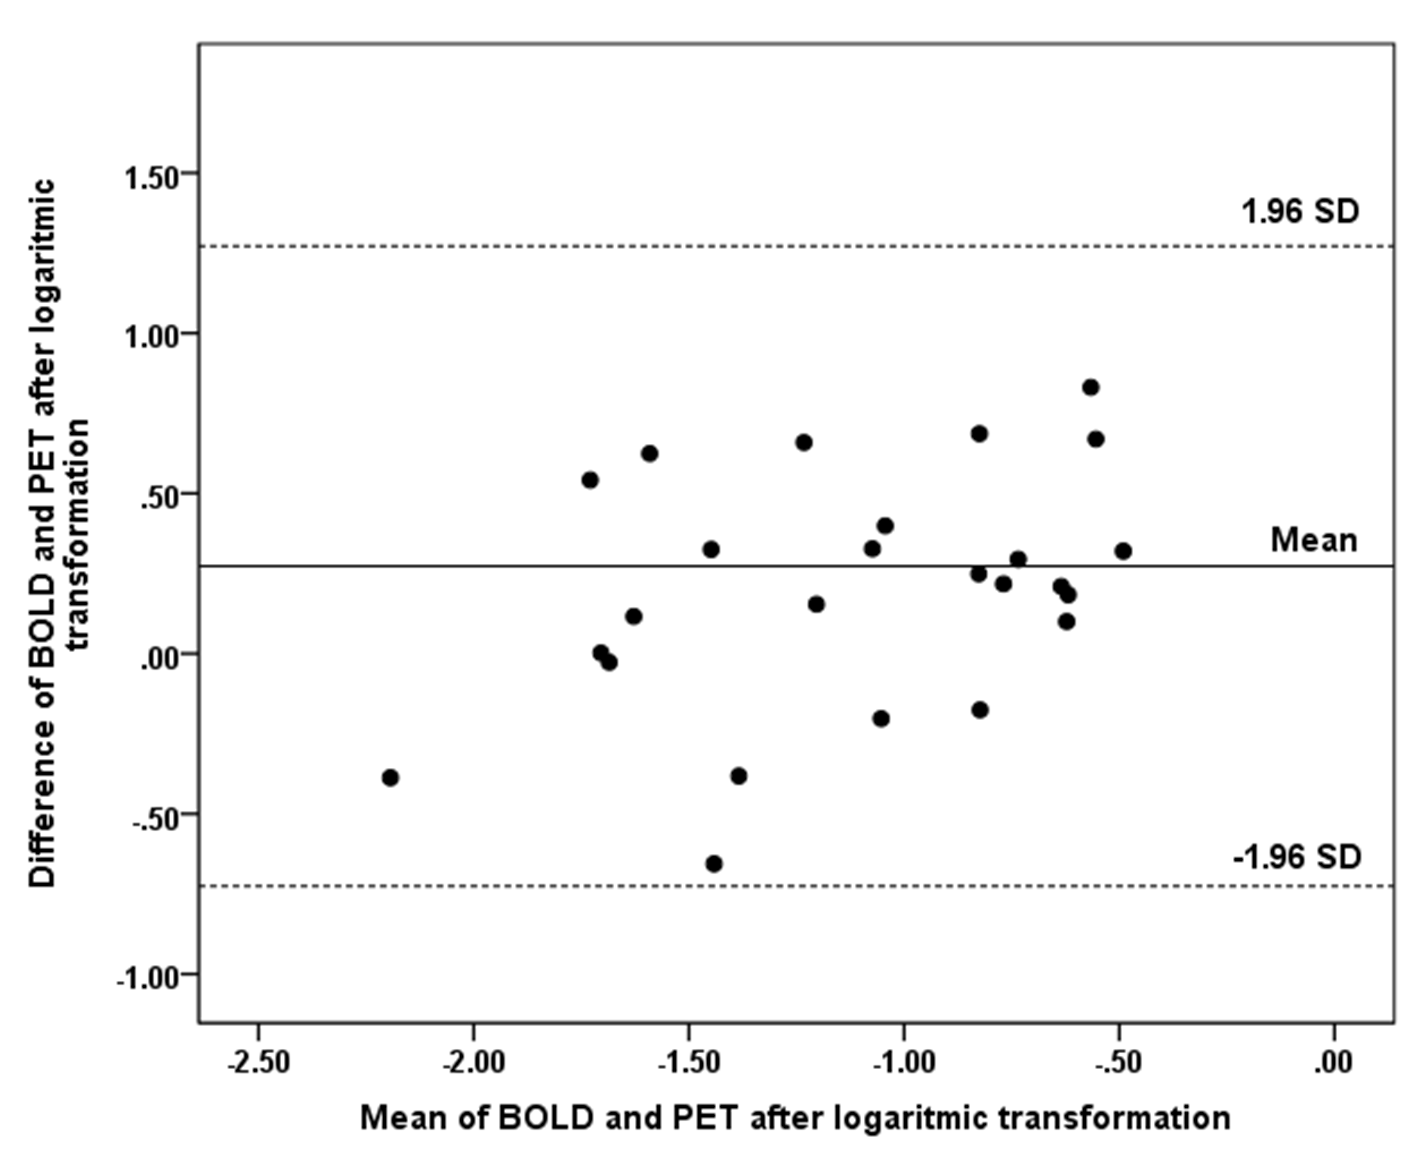
No significant difference was found between Stage0 and Stage1 for both exams, however, BOLD CVR showed a trend towards more impairment for Stage1 (BOLD CVR: 0.15 vs 0.11 p=0.07; PET: 0.41 vs 0.34, p=0.46). PET-based Stage1 versus Stage2 hemodynamic failure could be clearly separated with BOLD CVR (0.11 vs -0.03; p<0.01). The PET perfusion reserve showed a weaker separation of the two stages (PET perfusion reserve Stage1 vs Stage2: 0.34 vs 0.12, p=0.05). The mean values, distribution and agreement of BOLD CVR and PET perfusion reserve findings for all three stages are presented in Figure3&4.
Discussion
In this study, we demonstrated that BOLD CVR can be used as a surrogate imaging marker for hemodynamic failure. MR-Based Quantitative CVR surpassed PET in sensitivity and specificity.
BOLD CVR versus CBF perfusion reserve measurements obtained from [15O]-H2O-PET demonstrated good agreement for hemodynamic failure in affected hemisphere and MCA territory and for identifying hemodynamic failure Stage2.
Interestingly, we noted contralateral CVR impairment in the assumingly “unaffected” hemisphere in all 19 datasets, something that did not become apparent from PET perfusion reserve measurements. CBF might still be maintained with a small degree of CVR impairment, possibly explaining the presence of chronic tissue injury without apparent tissue loss on anatomical imaging, i.e. cortical thinning.
Conclusion
BOLD CVR may be considered as a widely implementable tool for assessing stroke risk in chronic cerebrovascular steno-occlusive diseases.Acknowledgements
No acknowledgement found.References
van Niftrik CHB, Piccirelli M, et al. Iterative analysis of cerebrovascular reactivity dynamic response by temporal decomposition. Brain and behavior. 2017.Figures