0346
Targeted Biopsy Validation of Peripheral Zone Prostate Cancer Characterization with MR Fingerprinting and Diffusion MappingAnanya Panda1, Gregory O'Connor2, Yun Jiang1, Alice Yu3, Shivani Pahwa4, Sara Dastmalchian4, Seunghee Margevicius5, Mark Schluchter5, Robert Abouassaly6, Chaitra Badve1,2,4, Mark Griswold1,2,4, Lee Ponsky2,7, and Vikas Gulani1,2,4
1Radiology, Case Western Reserve University, Cleveland, OH, United States, 2School of Medicine, Case Western Reserve University, Cleveland, OH, United States, 3Radiology, Johns Hopkins University, Baltimore, MD, United States, 4Radiology, University Hospitals Cleveland Medical Center, Cleveland, OH, United States, 5Biostatistics, Case Western Reserve University, Cleveland, OH, United States, 6Urology, Cleveland Clinic, Cleveland, OH, United States, 7Urology, University Hospitals Cleveland Medical Center, Cleveland, OH, United States
Synopsis
Targeted biopsy validation is presented for characterization of peripheral zone (PZ) prostate cancer grades and differentiation of prostate cancer from prostatitis, using a quantitative MR protocol comprising of MRF-relaxometry and standard EPI based ADC mapping. Mean T1, T2 and ADC in prostate cancer were significantly lower than in NPZ. Mean T2 and ADC in low-grade cancer were significantly higher than intermediate and high-grade cancer with similar AUCs (0.80) for both for differentiating grades. Mean T2 and ADC in prostate cancer were significantly lower than prostatitis. T2 was a significant predictor for prostate cancer over prostatitis while ADC was not significant.
Target Audience
Those interested in prostate MR, quantitative MR, relaxometryPurpose
To further validate a combined MR Fingerprinting (MRF) and apparent diffusion coefficient (ADC) mapping exam for differentiating grades of prostate cancer and distinguishing prostate cancer from prostatitis, using targeted prostate biopsy correlation.Introduction
There is increasing interest in quantitative relaxometry and ADC mapping for prostate cancer [1, 2]. MRF allows simultaneous time-efficient measurement of T1 and T2 relaxation times [3]. Previous work based on TRUS biopsy showed that a combined exam consisting of MRF and ADC mapping could differentiate prostate cancer and prostatitis from normal peripheral zone (NPZ) [4]. MR-targeted biopsy can provide more precise pathologic correlation for cancer-suspicious regions reported on MRI [5]. Here we evaluate performance of MRF and ADC for differentiating low-grade versus intermediate/high grade cancer and prostatitis versus cancer, using a targeted biopsy reference.Methods
In this IRB approved retrospective analysis of prospectively collected data, 92 peripheral zone cancer suspicious regions were studied from 74 patients who prospectively underwent MRF, limited clinical prostate MRI (high resolution T2w and ADC mapping), and targeted biopsy (cognitive targeting: 52 patients, in-gantry targeting: 22 patients). A MRF-FISP acquisition was used to cover the whole gland [6]. Settings: FOV 400 mm, TR 11-13 ms, FA 5-75 degree, resolution 1x1 mm2, slice thickness 5 mm. ADC mapping was performed using EPI acquisition with b-values 50–1400 sec/mm2, FOV 240 x 240 mm2, resolution 1.2 x 1.2 x 3 mm3. Based on clinical reads by a radiologist (16 years experience), another radiologist (7 years experience) blinded to final pathology diagnosis drew regions of interest (ROIs) on targeted cancer suspicious regions and contralateral NPZ on MRF-based T2 maps. The same ROIs were replicated on ADC maps in the same location and in NPZ. ROI sizes ranged from 6-445 mm2 (median 41 mm2). Mean T1, T2 and ADC were compared using linear mixed models. Generalized estimating equations logistic regression analyses were used to evaluate MRF and ADC in differentiating NPZ, cancer grades and prostatitis.Results
Figures 1 and 2 depict representative prostate cancer and prostatitis cases, respectively. Prostatitis was seen in 13 regions and 52 regions were prostate cancer (Low Grade/Gleason score 6 = 8, Intermediate Grade/Gleason score 7 = 33, High Grade/Gleason score 8 and above =11). 27 regions yielding other diagnoses were not included for analysis at this time. T1, T2 and ADC in prostate cancer (mean ± SD, 1705 ± 255 ms, 59 ± 21 ms, 0.690 x 10⁻³ ± 0.247 x 10⁻³ mm2/s) were significantly lower than NPZ (mean ± SD, 2344 ± 355 ms, 147 ± 58 ms, 1.637x10⁻³ mm2/s ± 0.306 x 10⁻³ mm2/s) (p < 0.0001 for each) and together produced the best separation (AUC =0.99) (Figure 1). T2 and ADC values in low-grade cancer (mean ± SD, 80 ± 30 ms, 0.947 x10⁻³ mm2/s ± 0.380 x 10⁻³ mm2/s) were significantly higher than intermediate and high-grade cancer (mean ± SD, 55 ± 16 ms, 0.644 x10⁻³ mm2/s ± 0.184 x 10⁻³ mm2/s) (p = 0.003 for T2, p = 0.0002 for ADC). Both ADC and T2 performed similarly in differentiation of cancer grades (AUC T2:0.80, ADC: 0.81) (Figure 3). T2 and ADC values in prostate cancer (mean ± SD, 59 ± 20 ms, 0.690 x10⁻³ mm2/s ± 0.247 x 10⁻³ mm2/s) were significantly lower than prostatitis (mean ± SD, 77 ± 39 ms, 0.971 x10⁻³ mm2/s ± 0.308 x 10⁻³ mm2/s) (p = 0.021 for T2, p = 0.0012 for ADC). ADC was not a significant predictor (p =0.055) while T2 was a significant predictor for prostate cancer over prostatitis (p = 0.03). Figure 4 shows ADC versus T2 for NPZ, prostatitis and prostate cancer.Discussion
Targeted biopsy verification is provided for performance of MRF and ADC for prostate imaging reported previously (4). Excellent separation is seen between NPZ and cancer (Figure 4). While there remains overlap between prostatitis and cancer, the work suggests that some prostatitis patients could potentially be spared biopsy based on quantitative criteria in the future. ADC mapping is often corrupted by artifacts due to rectal gas (Figures 1 and 2). Thus T1 and T2 mapping may be of clinical utility even in situations where ADC mapping is the most sensitive quantitative parameter, such as differentiation of low versus intermediate/high-grade cancer (Figure 3). Future work will include validation of MRF against more in-gantry biopsies and prostatectomy specimens as these provide the most precise pathologic diagnosis for MRI-detected abnormalities.Conclusion
Targeted biopsy validation is presented for characterization of prostate cancer grade and differentiation of prostate cancer from prostatitis, using MRF-derived relaxometry and standard EPI-based ADC mapping.Acknowledgements
Research Support: NIH grants 1R01EB016728, 1R01CA208236 1R01DK098503 and Siemens HealthineersReferences
1. Langer DL, et al. Prostate cancer detection with multi-parametric MRI: logistic regression analysis of quantitative T2, diffusion-weighted imaging, and dynamic contrast-enhanced MRI. JMR .2009;30:327-334. 2. Wu LM, et al. Feasibility and preliminary experience of quantitative T2* mapping at 3.0 T for detection and assessment of aggressiveness of prostate cancer.Acad Radiol .2014;21:1020-1026 3. Ma D, et al. Magnetic Resonance Fingerprinting, .Nature .2013.495;187-192. 4. Yu A, et al. Development of a Combined MR Fingerprinting and Diffusion Examination for Prostate Cancer Radiology .20177;.283:729-738. 5. Nagel KN, et al. Differentiation of prostatitis and prostate cancer by using diffusion-weighted MR imaging and MR-guided biopsy at 3 T.Radiology .2013;267:164-172 6. Jiang Y, et al. MR Fingerprinting Using Fast Imaging with Steady State Precession with Spiral Readout. MRM .2015;74: 1621-1631 7. Latifoltojar A, et al. Evolution of multi-parametric MRI quantitative parameters following transrectal ultrasound-guided biopsy of the prostate .Prost Can.2015;18: 343-351.Figures
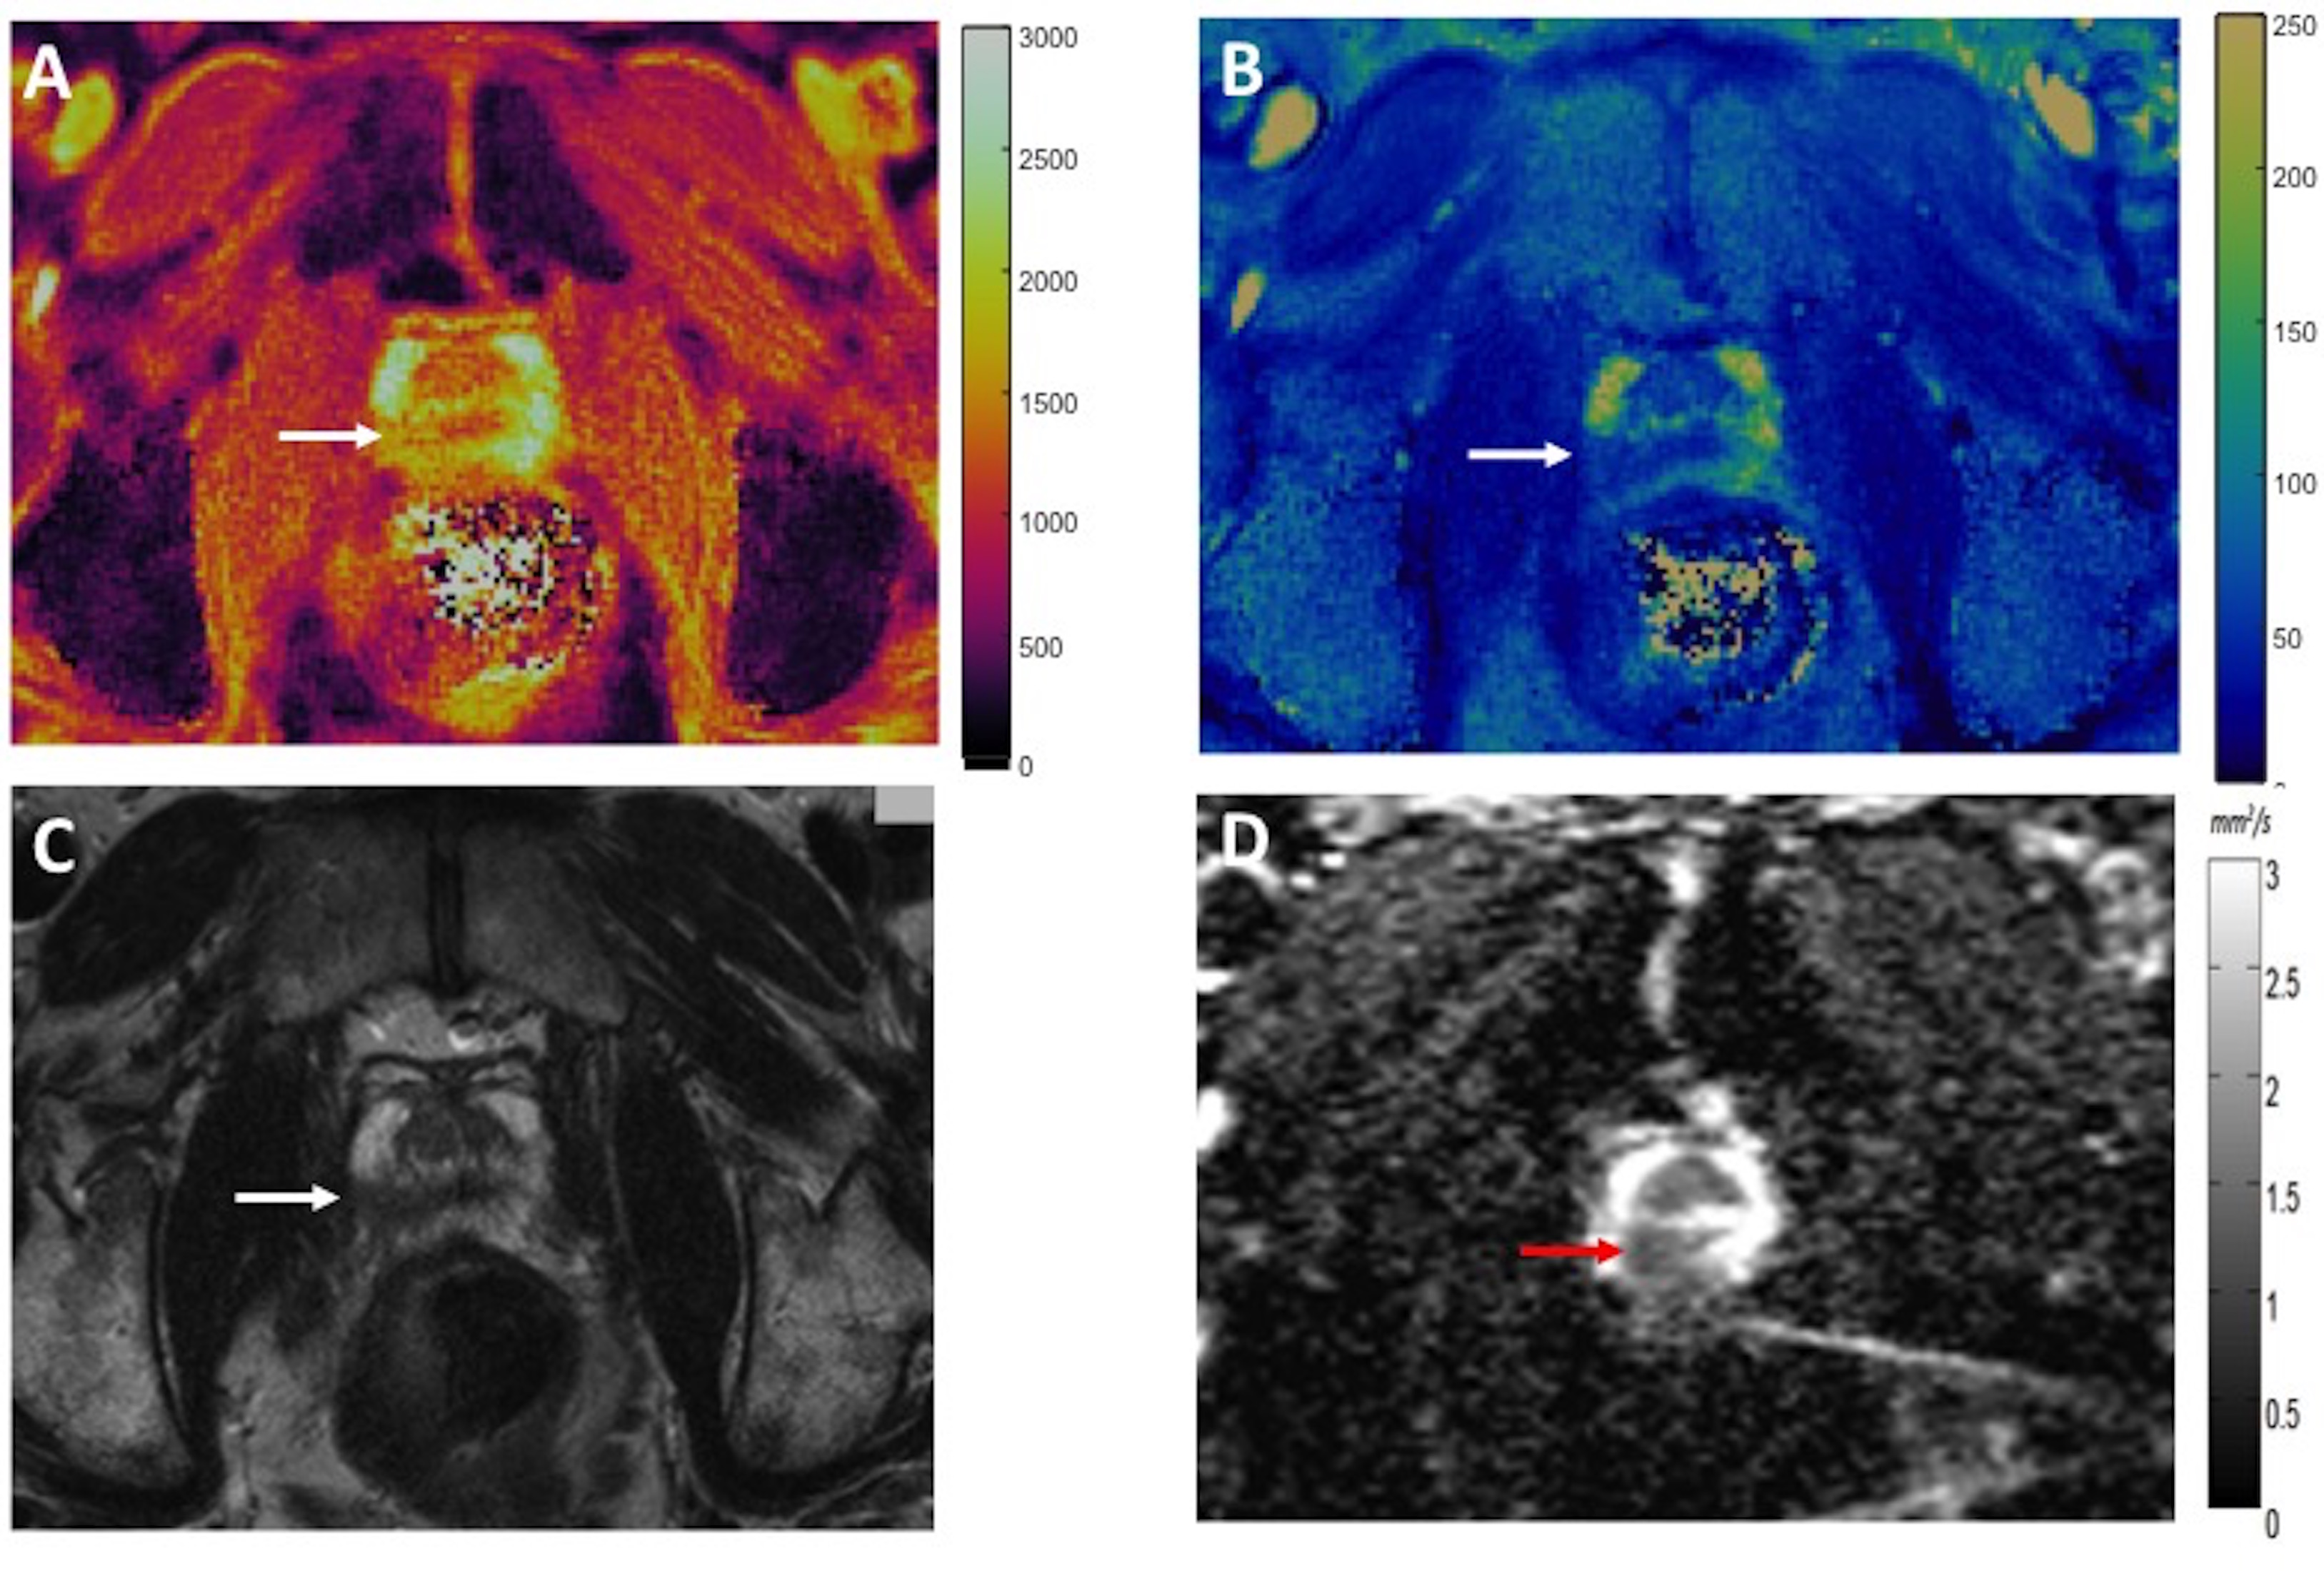
Figure 1: T1 (A)
and T2 (B)
MRF colormaps, T2w image (C) and ADC map (D) in a biopsy proven case of
Gleason 4+3 = 7 prostate cancer in the right peripheral zone (arrows). Note
susceptibility induced distortion in the ADC map due to gas in the rectum
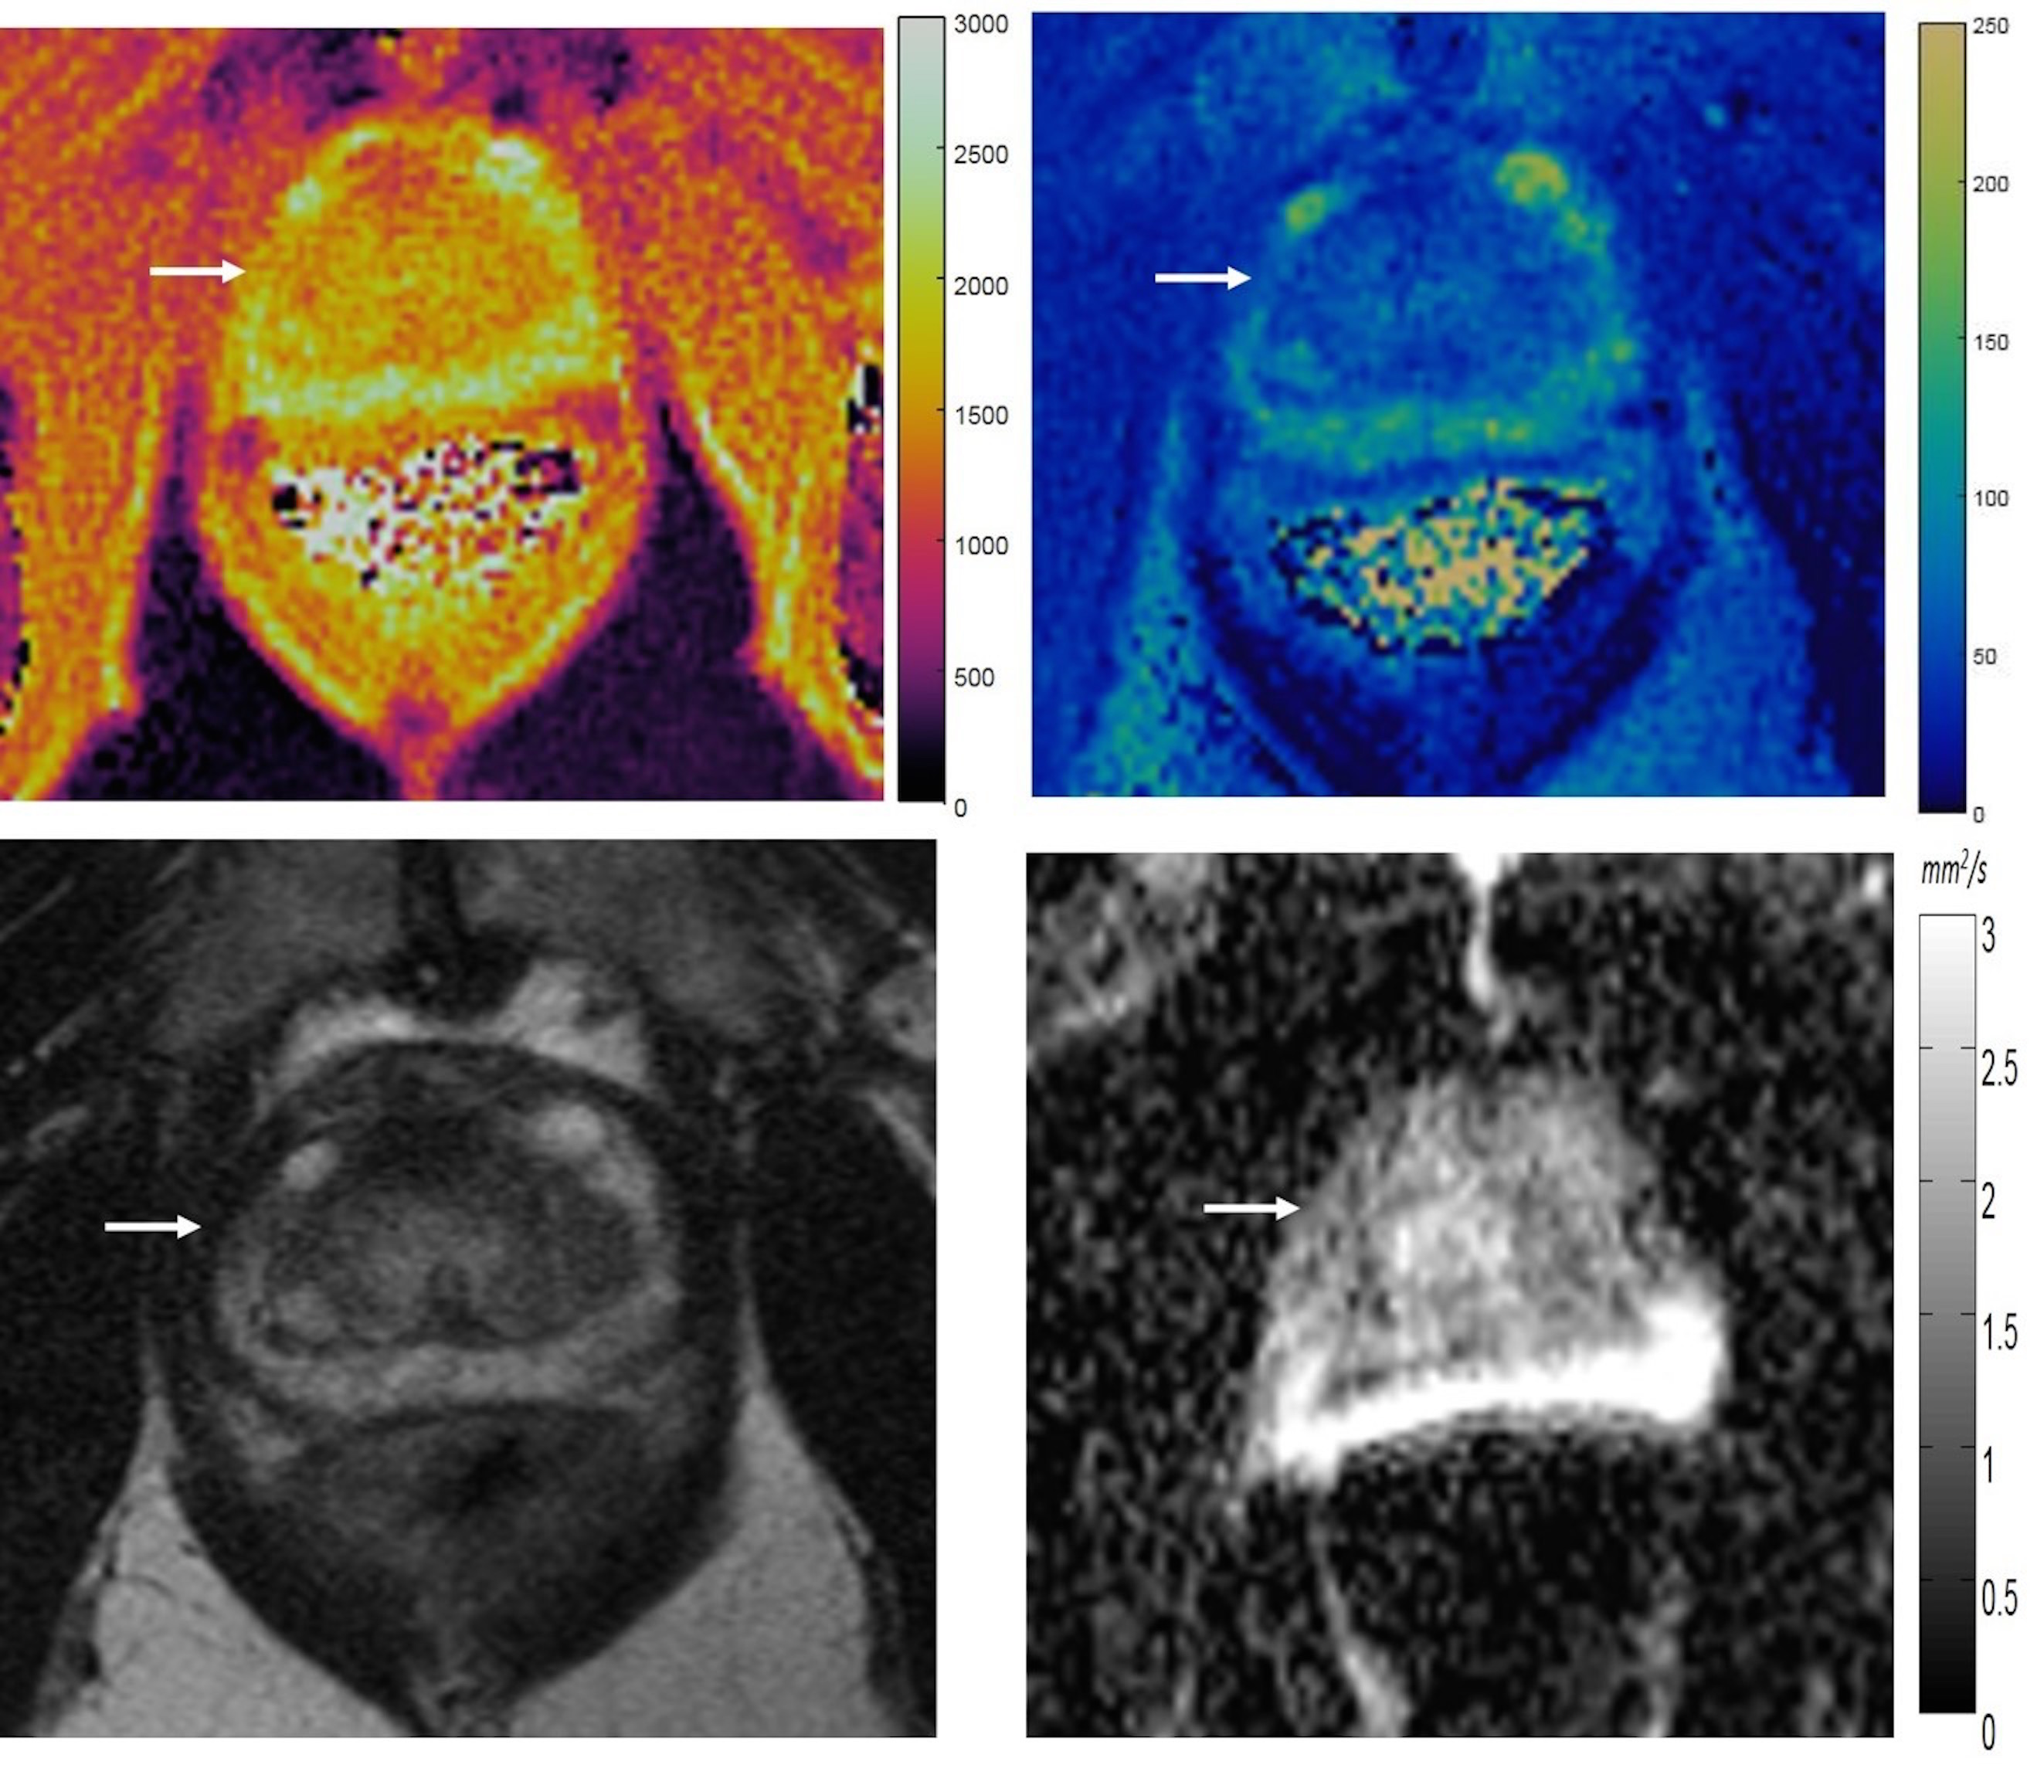
Figure 2: T1 (A) and T2 (B) MRF colormaps, T2w image
(C) and ADC map (D) in a biopsy proven case of prostatitis. The lesion is wedge
shaped, as often seen with prostatitis. Again please note susceptibility
induced distortion on ADC mapping due to gas in the rectum.

Figure 3: Receiver Operating Characteristic (ROC) curves for T2 and ADC for
predicting low versus intermediate and high-grade prostate cancer

Figure 4: Scatter plot showing ADC versus T2 for NPZ (green), prostate cancer
(blue) and prostatitis (yellow)