0343
Radiomics measured with mpMRI predicts histopathological and genomics markers of prostate cancer aggressiveness.1Translational and Molecular Imaging Institute, Icahn School of Medicine at Mount Sinai, New York, NY, United States, 2Department of Radiology, Icahn School of Medicine at Mount Sinai, New York, NY, United States, 3Department of Urology, Icahn School of Medicine at Mount Sinai, New York, NY, United States
Synopsis
The goal of this study was to assess the association of multiparametric MRI (mpMRI) radiomic features with histopathological and genomic markers of prostate cancer (PCa) aggressiveness. mpMRI histogram and texture features showed multiple significant correlations with Gleason score, modified Gleason score Grade Group and genomics Decipher risk score. General linear models showed high accuracy for prediction of the histopathological and genomics features (accuracy range 0.77-0.94). The results indicate that MRI radiomics analysis is promising for noninvasive assessment of PCa aggressiveness on the histopathological and genomics levels.
Purpose
There is a need for accurate noninvasive techniques for the determination of prostate cancer (PCa) aggressiveness. MRI techniques such as diffusion kurtosis imaging (DKI) and MRI texture analysis have shown great promise for the differentiation between aggressive and nonaggressive PCa cancers 1,2. In addition to the commonly used Gleason score, there is considerable interest in more objective measurements of PCa aggressiveness from biopsy and/or prostatectomy specimens. PCa genomics classifier Decipher has shown to be predictive of adverse outcome after prostatectomy 3. The goal of our study was to assess the correlation between mpMRI features and histopathological and genomics markers of PCa aggressiveness.Methods
48 PCa men with PCa (mean age 63y, range 41-76y) were included in this retrospective study. All patients underwent mpMRI, including T2WI and high b-value DWI (b-values 50, 1000, 1600, 2000 s/mm2) at 3.0T, before undergoing prostatectomy. Clinical MRI assessment of the index lesions was done using PI-RADSv2 scoring system 4. Modeling of the DWI/DKI data was performed to measure monoexponential ADCME (using b-values up to 1000 s/mm2), ADCDKI (using all b values) and kurtosis parameter K. Radiomics features, including histogram [mean, SD, kurtosis, skewness] and Haralick texture features 5 were extracted from ROIs in the index lesions on the DKI parameter maps and T2WI. Histopathological aggressiveness was measured by Gleason score and modified Gleason score (Grade Group). Decipher genomics testing of index PCa lesions was performed in 44 patients on prostatectomy specimens. Correlation analysis was performed between each of PI-RADS and mpMRI metrics with Decipher risk scores, Gleason score and Grade Group. General linear models with step-wise feature selection were built to assess the accuracy of the radiomics features for prediction of Gleason score ≥7, Grade Group ≥3 and Decipher ≥0.45, the latter reflective of intermediate-to-high risk of metastases development after prostatectomy 6.Results
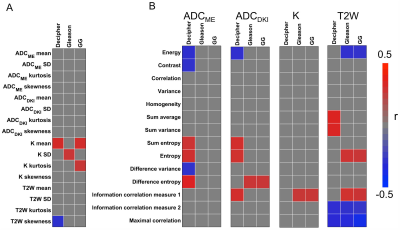
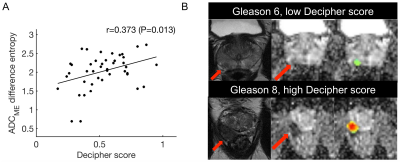
Mean tumor size was 1.5±0.7 cm (range 0.5-3.7 cm). Distribution of Gleason scores and Grade Groups was: Gleason 6 (n=6), Gleason 7 (n=31), Gleason 8 (n=3), Gleason 9 (n=8); Grade Group (1=6); Grade Group 2 (n=23); Grade Group 3 (n=8); Grade Group 4 (n=3); Grade Group 5 (n=8). Average Decipher score was 0.53±0.19 (range 0.17-0.95). Significant correlations between mpMRI features and histopathological and genomics PCa features are shown in Figure 1. mpMRI histogram features, particularly from K maps showed multiple significant correlations, including significant positive correlations of mean K with Decipher score (r=0.318, P=0.035) and Grade Group (r=0.336, P=0.018). Texture features also exhibited significant associations with histopathological and genomics features, including a significant positive correlation between Decipher and ADCME difference entropy (r=0.373, P=0.013; Figure 2) and significant negative correlation between Grade Group and T2W maximal correlation (r=-0.413, P=0.003). PI-RADS showed a significant positive correlation with Gleason score (r=0.391, P=0.027) but not with Grade Group (P=0.09) and Decipher (P=0.320). The general linear models showed an accuracy of 0.94, 0.84 and 0.77 for prediction of Gleason score ≥7 (model parameters ADCME SD, ADCDKI sum entropy, T2W variance), Grade Group ≥3 (model parameters ADCME maximal correlation, T2W kurtosis and T2W maximal correlation) and Decipher≥0.45 (model parameters ADCME difference entropy, T2W variance, T2W sum average), respectively.Discussion and Conclusion
Our results show that mpMRI radiomics analysis is promising for noninvasive prediction of PCa aggressiveness on the histopathological and genomics levels. The radiomics features showed significant correlations with Grade Group and Decipher score, which were not observed with standard PI-RADS assessment. Significant correlations between mpMRI texture features and PCa Gleason scores have been observed in earlier studies 7,8, while the association between mpMRI radiomic features and Decipher (among other gene risk scores) has previously been assessed in only a small cohort of 6 patients 9. Our study thus describes the first results on the correlation between mpMRI and Decipher risk score in a larger cohort of PCa patients. The model parameters from the general linear models included a combination of T2WI and advanced DWI radiomics features, suggesting that the combination of these techniques improves the diagnostic performance of MRI radiomics for assessment of PCa aggressiveness. The accuracy values from the general linear models may be slightly overestimated, because no separate validation set was used in this preliminary study. In the future we will validate our findings in a separate validation cohort and we will explore the use of advanced machine learning algorithms to potentially further improve the accuracy of mpMRI radiomics features for PCa aggressiveness.Acknowledgements
This research is supported by the 2017 Judy and Ronald Baron Prostate Cancer Foundation Young Investigator Award.References
1. Fehr D, Veeraraghavan H, Wibmer A, et al. Automatic classification of prostate cancer Gleason scores from multiparametric magnetic resonance images. Proceedings of the National Academy of Sciences of the United States of America 2015;112(46):E6265-6273.
2. Rosenkrantz AB, Prabhu V, Sigmund EE, Babb JS, Deng FM, Taneja SS. Utility of diffusional kurtosis imaging as a marker of adverse pathologic outcomes among prostate cancer active surveillance candidates undergoing radical prostatectomy. AJR Am J Roentgenol 2013;201(4):840-846.
3. Den RB, Yousefi K, Trabulsi EJ, et al. Genomic classifier identifies men with adverse pathology after radical prostatectomy who benefit from adjuvant radiation therapy. Journal of clinical oncology : official journal of the American Society of Clinical Oncology 2015;33(8):944-951.
4. Weinreb JC, Barentsz JO, Choyke PL, et al. PI-RADS Prostate Imaging - Reporting and Data System: 2015, Version 2. European urology 2016;69(1):16-40.
5. Haralick RM, Shanmuga K, Dinstein I. Textural Features for Image Classification. IEEE Trans SystMan Cybern SMC 1973;3:610-621.
6. Den RB, Santiago-Jimenez M, Alter J, et al. Decipher correlation patterns post prostatectomy: initial experience from 2 342 prospective patients. Prostate cancer and prostatic diseases 2016;19(4):374-379.
7. Nketiah G, Elschot M, Kim E, et al. T2-weighted MRI-derived textural features reflect prostate cancer aggressiveness: preliminary results. European radiology 2017;27(7):3050-3059.
8. Wibmer A, Hricak H, Gondo T, et al. Haralick texture analysis of prostate MRI: utility for differentiating non-cancerous prostate from prostate cancer and differentiating prostate cancers with different Gleason scores. European radiology 2015;25(10):2840-2850.
9. Stoyanova R, Pollack A, Takhar M, et al. Association of multiparametric MRI quantitative imaging features with prostate cancer gene expression in MRI-targeted prostate biopsies. Oncotarget 2016;7(33):53362-53376.
Figures

