0342
T2-weighted MRI-derived textural features can help the assessment of peripheral zone prostate cancer aggressiveness: results from multi-center data.1Department of Circulation and Medical Imaging, NTNU, Norwegian University of Science and Technology, Trondheim, Norway, 2Department of Radiology and Nuclear Medicine, Radboud University Medical Center, Nijmegen, Netherlands, 3St. Olavs Hospital, Trondheim University Hospital, Trondheim, Norway
Synopsis
The assessment of prostate cancer aggressiveness is currently based on Gleason grading of histological samples obtained by TRUS-guided biopsies, which can lead to substantial underestimations due to sampling errors. We previously showed that textural features derived from T2-weighted MRI could potentially serve as a non-invasive biomarker for prostate cancer aggressiveness. The aim of this work was to validate these preliminary results in a multi-center study. We found that the combination of intensity and textural features could distinguish between low/intermediate and high-grade with an accuracy of 71%, which was significantly higher than intensity (60%) or textural features (68%) alone.
Purpose
The treatment strategy for patients diagnosed with prostate cancer depends on accurate assessment of the aggressiveness of the disease. In the latest prostate cancer grading system [1], patients are stratified in 5 grade groups based on the Gleason patterns observed in histological samples obtained by TRUS-guided biopsies. However, TRUS-guided biopsies are prone to sampling errors, which can lead to a substantial underestimation of prostate cancer aggressiveness due to the heterogeneous and multi-focal nature of the disease [2]. We previously showed that textural features derived from T2-weighted MRI are associated with post-surgical Gleason grade and could potentially serve as a non-invasive biomarker for aggressiveness [3]. The aim of this work was to validate these preliminary results in a multi-center study.Methods
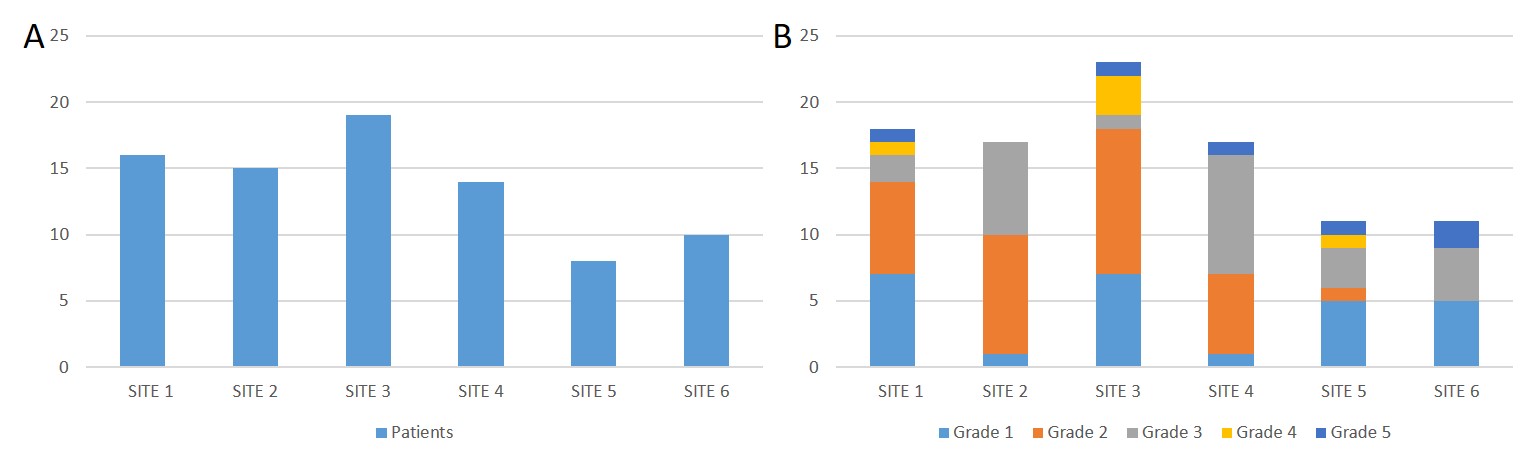
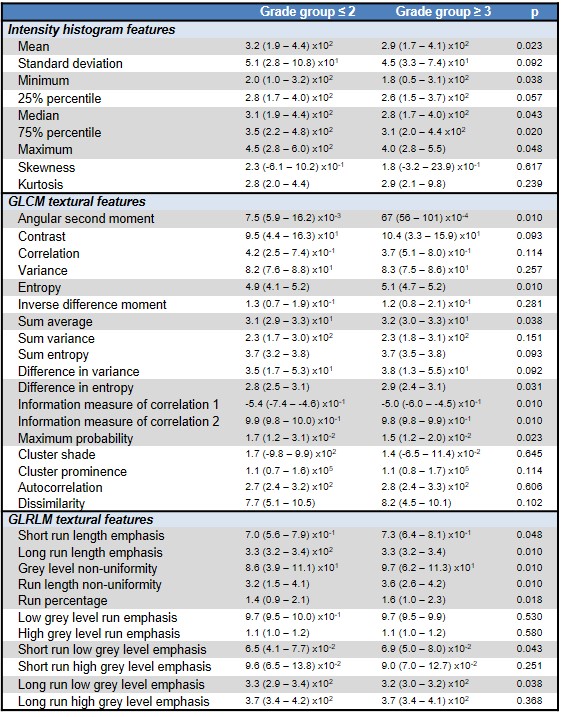
T2-weighted images of 82 patients from 6 different centers were collected as part of a multicenter study (Figure 1A). All patients underwent multi-parametric MRI with the same scan protocol before radical prostatectomy, which included transverse T2-weighted imaging with a turbo spin-echo sequence (TR/TE 4000/101 ms; flip angle 150°; FOV 200×200 mm2; matrix 320×320; slice thickness 3 mm; interslice gap 0.6 mm). Whole-mount histology slides marked by expert uro-pathologists were used as a reference to delineate the peripheral zone tumors on the T2-weighted images. A region-of-interest (ROI) was then obtained for each tumor by automatically placing a grid of 11x11 voxels (6.9x6.9 mm2) on the center of mass of the middle slice of the tumor, but not extending its boundaries. The T2-weighted images were N4 bias field corrected [4] and normalized to the mean prostate intensity of the cohort. For each ROI we extracted 9 intensity features from the intensity histogram, 18 textural features from the grey level co-occurrence matrix (GLCM) [5], and 11 textural features from the gray level run-length matrix (GLRLM) [6] (Table 1). Tumor aggressiveness was dichotomized to distinguish between low/intermediate (grade group ≤ 2, i.e. Gleason scores ≤ 3+4) and high (grade group ≥ 3, i.e. Gleason scores ≥ 4+3) aggressiveness, which are associated with significantly different prognoses [1]. Differences in median feature value between aggressiveness levels and centers were tested with Mann-Whitney U-tests and Kruskal-Wallis Tests, respectively. One hundred (100) random runs of 5-fold double cross validation were performed to train and test a linear support vector machines (SVM) classifier based on the intensity, textural, and combination of intensity and textural features. Here, the SVM hyper-parameters were optimized in the inner cross validation loop, whereas the performance was assessed in the outer loop. Differences in mean area under the receiver-operating curve (AUC) and mean accuracy between the feature sets were tested with paired-sample t-tests. Differences in mean accuracy between centers was tested with a one-way anova. P-values < 0.05 after correction for multiple testing [7] were considered significant.Results
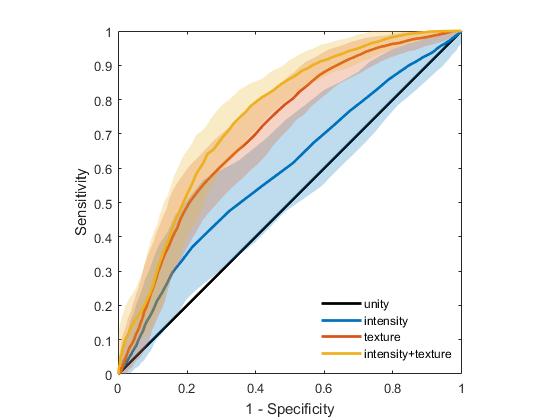
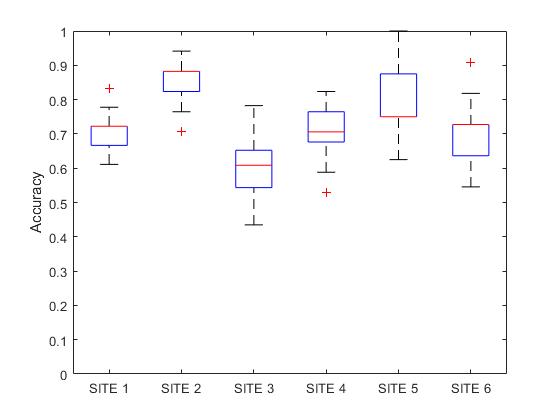
Ninety-four (94) tumor ROIs were analysed (Figure 1B). Significant differences in median feature value were found for 5/9 intensity features, 7/18 GLCM texture features, and 7/11 GLRLM texture features (Table 1), which generally reflected a lower intensity, higher randomness and lower homogeneity in more aggressive tumors. No significant differences in median feature values were observed between centers. The combination of intensity and textural features (AUC 0.75±0.02; accuracy 0.71±0.03) performed significantly better than intensity features (AUC 0.59±0.05, p<0.001; accuracy 0.60±0.06, p<0.001) and textural features (AUC 0.71±0.03, p<0.001; accuracy 0.68±0.03, p<0.001) alone for distinguishing between low/intermediate and high-grade cancers (Figure 2). However, the classification accuracy differed significantly between centers (p<0.001) (Figure 3).Discussion
Preliminary results from a single center study indicated that entropy and angular second momentum (homogeneity) are associated with prostate cancer aggressiveness [3]. This work confirms and extends these findings in a multi-center setting. Moreover, we show that textural features can significantly improve the classification between low/intermediate and highly aggressive tumors. We found that the classification accuracy significantly depended on the center, even though no differences in median feature values were found between them. One possible explanation for this observation could be that the distribution of cancer aggressiveness was not balanced between centers (Figure 1B), but this is subject of further study. Although an overall accuracy of 0.71 is probably not sufficient to use T2-weighted MRI as a stand-alone modality to assess prostate cancer aggressiveness, it could be helpful as a planning tool for better targeting of image-guided biopsies [8]. In future research, we will also investigate if the accuracy can be improved when T2-weighted MRI-derived textural features are combined with features from diffusion-weighted and dynamic contrast-enhanced MRI.Conclusion
Adding textural features to intensity-based features from T2-weighted MRI significantly improves the assessment of peripheral zone prostate cancer aggressiveness.Acknowledgements
No acknowledgement found.References
[1] Epstein JI, Zelefsky MJ, Sjoberg DD, et al. A Contemporary Prostate Cancer Grading System: A Validated Alternative to the Gleason Score. Eur Urol. 2016 Mar;69(3):428-35. doi: 10.1016/j.eururo.2015.06.046.
[2] Hambrock T, Hoeks C, Hulsbergen-van de Kaa C, et al. Prospective assessment of prostate cancer aggressiveness using 3-T diffusion-weighted magnetic resonance imaging-guided biopsies versus a systematic 10-core transrectal ultrasound prostate biopsy cohort. Eur Urol. 2012 Jan;61(1):177-84. doi: 10.1016/j.eururo.2011.08.042.
[3] Nketiah G, Elschot M, Kim E, Teruel JR, Scheenen TW, Bathen TF, Selnæs KM. T2-weighted MRI-derived textural features reflect prostate cancer aggressiveness: preliminary results. Eur Radiol. 2017 Jul;27(7):3050-3059. doi: 10.1007/s00330-016-4663-1.
[4] Tustison NJ, Avants BB, Cook PA, Zheng Y, Egan A, Yushkevich PA, Gee JC. N4ITK: improved N3 bias correction. IEEE Trans Med Imaging. 2010 Jun;29(6):1310-20. doi: 10.1109/TMI.2010.2046908.
[5] Haralick RM, Shanmugam K, Dinsetein I. Textural Features for Image Classification. IEEE Trans Syst Man Cybern. 1973 Nov;3(6):610-21. doi: 10.1109/TSMC.1973.4309314
[6] Galloway M. Texture analysis using gray level run lengths. Comput Graph Image Process. 1975 Jun;4(2):172-9.
[7] Benjamini Y, Hochberg Y. On the Adaptive Control of the False Discovery Rate in Multiple Testing With Independent Statistics. J Educ Behav Stat. 2000 Mar;25(1):60–83
[8] Vos EK, Kobus T, Litjens GJ, et al. Multiparametric Magnetic Resonance Imaging for Discriminating Low-Grade From High-Grade Prostate Cancer. Invest Radiol. 2015 Aug;50(8):490-7. doi: 10.1097/RLI.0000000000000157
Figures