0340
Assessment of early treatment response by multiparametric whole-body MRI as a 1-step approach to prediction of overall response rate in patients with multiple myeloma1Department of Diagnostic Radiology, Hiroshima University Hospital, Hiroshima, Japan
Synopsis
We compared remission status at completion of chemotherapy with changes in MRI biomarkers obtained by advanced MRI techniques, including total tumor volume calculated from whole-body diffusion-weighted imaging and fat fraction by mDIXON soon after induction of chemotherapy for patients with multiple myeloma. The early change in fat fraction of lumbar bone marrow and serum monoclonal protein after 2 cycles of chemotherapy contributed significantly to the prediction of CR/VGPR status. Results of this study may indicate that prediction of remission status can be achieved by assessing bone marrow on lumbar spinal MRI with mDIXON.
INTRODUCTION
In multiple myeloma, changes in the signal pattern on MRI have been known to correlate with response to chemotherapy1, but these findings have not been included in response criteria because of the lack of objectivity. The aim of this study was to compare remission status at completion of chemotherapy with changes in MRI biomarkers obtained by advanced MRI techniques, including total tumor volume (tTV) calculated from whole-body diffusion-weighted imaging (wb-DWI) and fat fraction (FF) by modified DIXON (mDIXON) soon after induction of chemotherapy, and to assess the predictive value of MRI.METHODS
Thirty-eight patients with newly diagnosed symptomatic myeloma (mean age, 68.3 ± 9.2 years) were examined using a 3-T system (Ingenia; Philips Healthcare) equipped with head, anterior torso array, and integrated posterior coils. For wb-DWI, coronal images were acquired by free-breathing single-shot echo-planar DWI with b-values of 0 and 1000 from head to midthigh, sequentially across three imaging stations, with each station consisting of 50 sections. With semi-automatic segmentation of wb-DWI using a discriminant analysis method2, tTV was obtained. The threshold for positive bone marrow (BM) involvement was apparent diffusion coefficient (ADC) >0.55 ×10⁻³ mm2/s according to a previous report3. Mean ADC, kurtosis, and skewness from all voxels in the tTV were calculated. Second, single-shot spinal DWI with 9 b-values (0 to 2000) was performed with TR/TE =8000/84 ms. The three parameters of perfusion fraction (f), pseudo-ADC (ADCfast), and true ADC (ADCslow) were calculated using a biexponential model from mean signal intensity of ROIs within the BM of L1-L3 without a focal lesion. Third, on whole-body coronal 3D 2-point mDIXON sequence (TR, 3.9ms; TE1, 1.4ms; TE2, 2.7ms), IP/OP/F/W images were obtained and mean fat fraction (FF) was calculated from the same vertebrae used for a biexponential model. Serological data, including serum monoclonal protein (M protein), albumin, lactate dehydrogenase, β2-microglobulin, κ/λ ratio and hemoglobin were obtained. Patients were categorized into the following two groups: patients who achieved CR or very good PR (n=14, CR/VGPR group) and patients who showed PR, SD or PD (n=24, PR/SD/PD group) at the completion of chemotherapy. Within-group changes of indices from baseline to second examination after 2 cycles of chemotherapy were compared using the Wilcoxon signed-rank test and expressed as percentage changes. Next, between-group differences in percentage changes were assessed with the Kruskal-Wallis test. Receiver operating characteristic (ROC) curves were performed to assess performance for predicting achievement of CR/VGPR.RESULTS
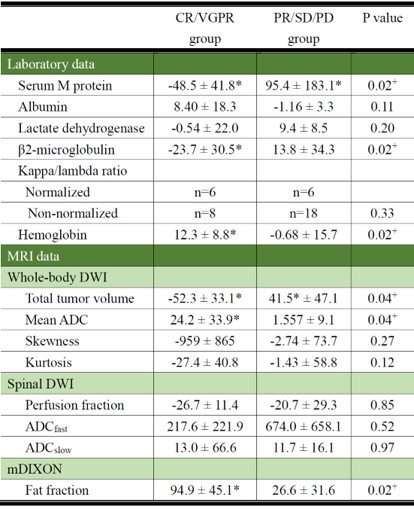
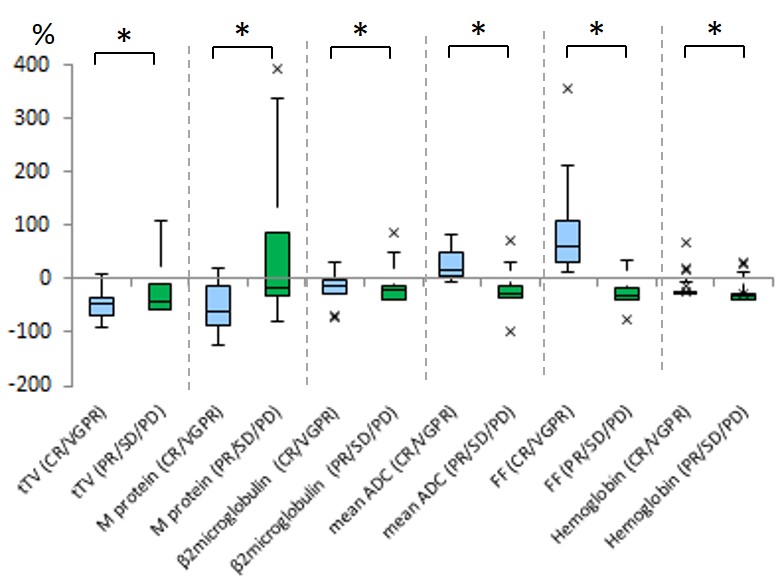
No significant differences in serological- and MRI-derived indices at baseline examinations were evident between groups. At the second examination, tTV, M protein and β2-microglobulin were significantly decreased and mean ADC, FF, and hemoglobin were significantly increased in the CR/VGPR group (Table 1, Figure 1). The general linear model demonstrated that percentage changes in FF and M protein contributed significantly to the CR/VGPR achievement (P=0.02, P=0.03, respectively). AUCs of ROC curves were 0.936 for FF and 0.902 for M protein (Figure 2).DISCUSSION
In this study, tTV obtained by wb-DWI did not prove to be significant predictors of CR/VGPR. We measured tTV with the reported mean ADC of the area corresponding to the area showing diffuse signal hypointensity on T1-weighted images based on visual inspection as the ADC threshold3, values over which were assumed to correspond to more advanced myeloma. Voxels in the BM with mild to moderate infiltration of myeloma cells therefore might not have been extracted using this method. On the other hand, changes in FF of lumbar BM was significantly greater in patients achieving CR/VGPR compared with those whose response was PR or less. We believe that FF calculated from mDIXON, which utilizes signal cancellation of water- and fat protons within a voxel, might be more sensitive to even small amounts of tumor mass than tTV, which was estimated based on the certain threshold. In this study, sensitivity of FF in the lumbar spine for identification of CR/VGPR was higher than serum M protein measured at 2 cycles after induction of chemotherapy. This result may indicate that prediction of remission status can be achieved by assessment of FF of the lumbar spinal BM without a focal lesion. In addition, this method may also be very useful for patients with Bence-Jones myeloma and non-secretory myeloma, in which M protein are not secreted in the blood.CONCLUSION
The early change in FF of lumbar BM and serum M protein soon after induction of chemotherapy contributed significantly to the prediction of CR/VGPR status. Results of this study may indicate that prediction of remission status can be achieved by assessing BM on lumbar spinal MRI with mDIXON.Acknowledgements
No acknowledgement found.References
1. Moulopoulos LA, Gika D, Anagnostopoulos A, et al. Prognostic significance of magnetic resonance imaging of bone marrow in previously untreated patients with multiple myeloma. Ann Oncol. 2005:16:1824-1828.
2. Otsu N. A threshold selection method from gray-level histograms. IEEE transactions on systems, man, and cybernetics 1979:9.1: 62-66.
3. Koutoulidis V, Fontara S, Terpos E, et al. Quantitative Diffusion-weighted Imaging of the Bone Marrow: An Adjunct Tool for the Diagnosis of a Diffuse MR Imaging Pattern in Patients with Multiple Myeloma. Radiology 2017:282:484-493.
Figures