0339
Voxel-wise ratios of amide proton transfer (APT) signals and standardized uptake values (SUVs) of fluorodeoxyglucose (FDG) in the differentiation of myxoid-rich soft-tissue tumors with FDG-PET/MR imaging1Department of Clinical Radiology, Graduate School of Medical Sciences, Kyushu University, Fukuoka, Japan, 2Department of Molecular Imaging and Diagnosis, Graduate School of Medical Sciences, Kyushu University, Fukuoka, Japan, 3Healthcare, Philips Electronics Japan, Tokyo, Japan, 4Philips Research, Hamburg, Germany, 5Department of Orthopaedic Surgery, Graduate School of Medical Sciences, Kyushu University, Fukuoka, Japan
Synopsis
It is often difficult to differentiate myxoid-rich soft-tissue tumors on conventional imaging. In this study, we performed a direct voxel-wise comparison of amide proton transfer (APT) signals and standardized uptake values (SUVs) obtained on FDG-PET/MR imaging. Among myxoid-rich tumors including myxoid liposarcomas, myxofibrosarcomas, myxoid chondrosarcomas, and schwannomas, the mean APT/SUV was significantly higher in liposarcomas than in the other myxoid-rich tumors while a single parameter such as APT, SUV or apparent diffusion coefficient (ADC) did not show any significant differences between the two groups. The APT/SUV could be a reliable bio-imaging marker for differentiating soft-tissue tumors.
Purpose
Soft-tissue tumors consist of a variety of interstitial tissues in addition to tumor cells1,2. The myxoid tissue is one of the most common interstitium observed on soft-tissue tumors, including a wide range of tumors such as myxoid liposarcomas, myxofibrosarcomas, myxoid chondrosarcomas, and schwannomas. It is usually difficult to differentiate these tumors with conventional imaging techniques when the interstitial tissue is predominant. The PET/MR system can simultaneously acquire functional MR and fluorodeoxyglucose (FDG)-PET images with precise image co-registration. Further, this system enables direct voxel-by-voxel comparison of standardized uptake values (SUV) from PET and other functional MR parameters such as the apparent diffusion coefficient (ADC)3 and amide proton transfer (APT) signal. APT imaging involves the visualization of the exchange of protons between free tissue water and the amide groups (-NH) of endogenous mobile proteins and peptides.4 Although APT imaging is useful for evaluating the degree of tumor malignancy such as gliomas or other cancers5-7, the usefulness has remained to be explored for differentiating soft-tissue tumors. The purpose of the present study was to investigate whether the direct voxel-wise combination of SUVs of FDG-uptake and APT signals on a PET/MR system was useful for differentiating myxoid-rich soft-tissue tumors.Methods
<Image Acquisition> Fifteen patients with known soft-tissue tumors with high signals on T2WI (six liposarcomas, three myxofibrosarcomas, three chondrosarcomas and three schwannomas) were included in this study and scanned using an Ingenuity TF PET/MR scanner (Philips Healthcare, Cleveland, OH). After the scout image and a 3D-T1WI for attenuation correction were acquired, the participants underwent FDG-PET imaging with 3D-ordered subset expectation maximization and time of flight. The sampling time was 5 minutes per bed, and the images were reconstructed with 23 mm voxels. After PET imaging, transverse 2D-T2WI and T1WI were obtained to cover the entire tumor volume. A DWI with a spatially selective RF pulse8 (zoomed DWI, b = 0 and 800) was obtained, and an ADC map was generated. Finally, APT imaging with the 3D fast spin-echo Dixon method9 was performed. Briefly, a saturation pulse (duration: 2.0s, power: 2.0μT) was applied to obtain Z-spectra at seven different frequency offsets: ±2.7 ppm, ± 3.5 ppm, ± 4.3 ppm, and -1560 ppm. The scan was repeated three times at +3.5 ppm with echo shifts (ΔTE = 0.4 ms) for Dixon B0 mapping. The APT image corrected by a three-point Dixon-type B0 map was generated. Other parameters were: TR/TE = 3500/5.7 ms, voxel size = 1.8 × 1.8 mm, slice thickness = 4.4 mm, slices = 9, and scan duration = 3 m 52 s – 5 m 12 s. <Image Processing> Image registration with rigid transformation was performed between the T2WI, ADC map, APT, and PET image on an IntelliSpace Portal workstation (version 6.0, Philips Healthcare). The T2WI, ADC map, and FDG-PET image were then resliced in accordance with the APT image (4.4 mm). The APT image was divided by PET image, and APT/SUV maps were generated. On T2WI, regions of interest (ROIs) were manually drawn along the border of the tumor in all slices. The ROIs were then copied onto the other images. After extracting the tumor area, in-plane image resolution was interpolated to 22 mm. The APT signals, SUVs, ADCs, APT/SUVs were recorded on a voxel-by-voxel basis for all slices. The voxels with ADC < 0.5 ×10⁻³ mm2/s were excluded from analysis. The mean of APT, ADC and APT/SUV and the maximum of SUV were compared between liposarcomas and other tumors by Mann-Whitney U test.Results and Discussion
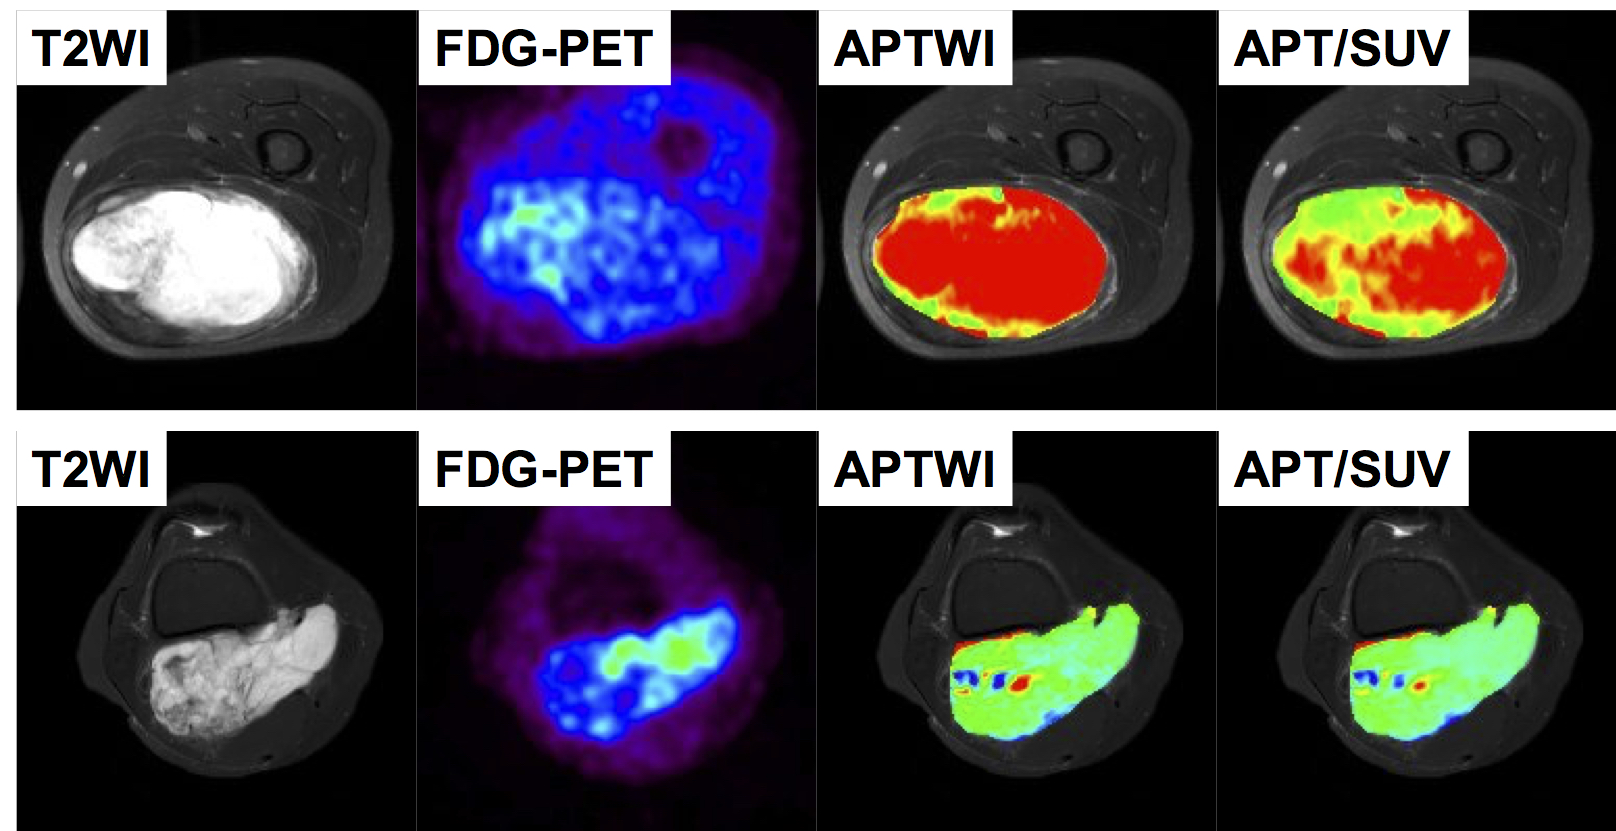
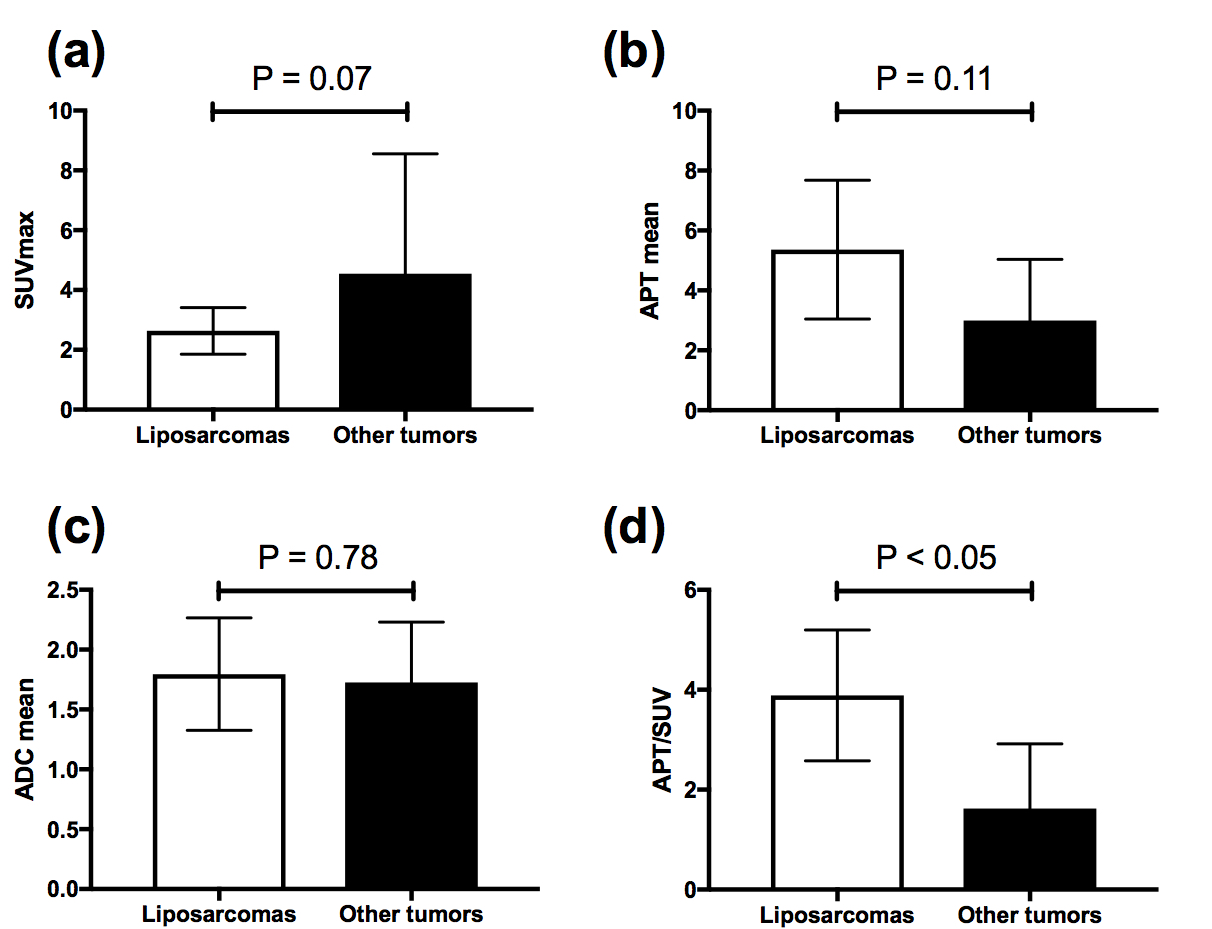
Two representative cases of liposarcoma (top) and chondrosarcoma (bottom) are shown in Figure 1. Both tumors showed bright signals on T2WI and low uptake on FDG-PET. The liposarcoma showed higher APT signals and APT/SUV than chondrosarcoma. Only APT/SUV showed a significant difference between liposarcomas and other tumors (3.89 ± 1.31 vs. 1.62 ± 1.29, P < 0.05, Fig. 2). SUVmax (2.63 ± 0.78 vs. 4.55 ± 4.01, P = 0.07), APTmean (5.36 ± 2.32 vs. 3.00 ± 2.04, P = 0.11), and ADCmean (1.80 ± 0.47 vs. 1.73 ± 0.50, P = 0.78) did not show significant differences between liposarcomas and other tumors. APT signals indicate the concentration of mobile protein/peptide in the tissue, while SUVs of FDG-PET reflect glucose uptake of tumor cells. Therefore, the APT/SUV means the ratio of the accumulated protein/peptide to the glucose metabolism in tumors. The liposarcomas might produce and store protein/peptide more efficiently per glucose assumption than other tumors.Conclusion
Voxel-wise ratios of APTWI and FDG-PET in soft-tissue tumors could differentiate liposarcomas and other myxoid-rich tumors while single parameters could not distinguish the two groups.Acknowledgements
No acknowledgement found.References
1. Clark MA, Fisher C, Judson I, Thomas JM. Soft-Tissue Sarcomas in Adults. N Engl J Med 2005;353(7):701-711.
2. Fletcher CDM. WHO Classification of Tumours of Soft Tissue and Bone: IARC Press: 2013.
3. Sagiyama K, Watanabe Y, Kamei R, et al. Multiparametric voxel-based analyses of standardized uptake values and apparent diffusion coefficients of soft-tissue tumours with a positron emission tomography/magnetic resonance system: Preliminary results. Eur Radiol 2017.
4. Vinogradov E, Sherry AD, Lenkinski RE. CEST: from basic principles to applications, challenges and opportunities. J Magn Reson 2013;229:155-172.
5. Togao O, Yoshiura T, Keupp J, et al. Amide proton transfer imaging of adult diffuse gliomas: correlation with histopathological grades. Neuro Oncol 2014;16(3):441-448.
6. Takayama Y, Nishie A, Sugimoto M, et al. Amide proton transfer (APT) magnetic resonance imaging of prostate cancer: comparison with Gleason scores. MAGMA 2016;29(4):671-679.
7. Takayama Y, Nishie A, Togao O, et al. Amide Proton Transfer MR Imaging of Endometrioid Endometrial Adenocarcinoma: Association with Histologic Grade. Radiology 2017:170349.
8. Sagiyama K, Watanabe Y, Kamei R, Baba S, Honda H. Comparison of positron emission tomography diffusion-weighted imaging (PET/DWI) registration quality in a PET/MR scanner: Zoomed DWI vs. Conventional DWI. J Magn Reson Imaging 2016;43(4):853-858.
9. Togao O, Keupp J, Hiwatashi A, et al. Amide proton transfer imaging of brain tumors using a self-corrected 3D fast spin-echo dixon method: Comparison With separate B0 correction. Magn Reson Med 2016.
Figures