0338
Assessment of the clinical feasibility of routine T2 mapping of the intervertebral disc using highly undersampled k-space data1High Field MR Centre, Department of Biomedical Imaging and Image-guided Therapy, Medical University of Vienna, Vienna, Austria, 2Department of Orthopaedics, Medical University of Vienna, Vienna, Austria, 3Advanced Clinical Imaging Technology, Siemens Healthcare AG, Lausanne, Switzerland, 4Department of Radiology, University Hospital (CHUV), Lausanne, Switzerland, 5LTS5, Ecole Polytechnique Fédérale de Lausanne, Lausanne, Switzerland, 6High Field MR Centre of Excellence, Department of Biomedical Imaging and Image-guided Therapy, Medical University of Vienna, Vienna, Austria
Synopsis
Even though the measurement of T2 relaxation time is one of the most widespread available assets of quantitative MRI in clinical routine, it is left with untapped potential as the required scan time is too long. GRAPPATINI is a model-based iterative algorithm reconstructing T2 maps and T2-weighted images from highly-undersampled k-space data. The aim of this study was to compare the quantitative results of an established standard method with this novel technique in the intervertebral disc with the additional benefit of GRAPPATINI to simulate T2w contrasts at arbitrarily chosen echo times.
Introduction
The quantification of T2 relaxation offers useful insight in many imaging applications. In the intervertebral discs, T2 relaxation times reflect water content and ultrastructure. Studies have already suggested, that T2 mapping might qualify as a good biomarker in the assessment of intervertebral disc disease.1,2 However, the long acquisition time of a conventional Carr-Purcell-Meiboom-Gill (CPMG) sequence typically used to acquire these maps prohibits a broad clinical application. This study investigates whether GRAPPATINI3, a model-based iterative algorithm to reconstruct highly-undersampled k-space data, enables T2 mapping in clinically feasible scan times while maintaining identical resolution and accuracy.Methods
Five volunteers and five patients (mean age 27.0 and 29.6 years respectively) were scanned at 3T (MAGNETOM Prisma, Siemens Healthcare, Erlangen, Germany) after written informed consent was obtained. Sagittal and axial T2 maps from the CPMG sequence were estimated on-site using MapIt (Siemens Healthcare, Erlangen, Germany) discarding the first echo and using only even echoes. These were compared to T2 maps estimated with the GRAPPATINI prototype sequence using a tenfold undersampling. The acceleration in measurement time was a factor of 5.7 (13:11 vs. 2:20) in sagittal and 5.8 (9:27 vs. 1:38) in axial plane view using the same time to repetition (TR), time to echo (TE), echo train length (ETL) and resolution. Since GRAPPATINI was set to use GRAPPA, the CPMG sequence was also configured with GRAPPA on. TR was set to 3500 ms, corresponding to three times the expected T1 relaxation for a more accurate T2 relaxation time measurement.4 TE was set as low as possible with 8.9 ms and an ETL of 16. The matrix size of the sagittal acquisition was 384 x 230 with a FoV of 260 x 260 mm and a slice thickness of 4.0 mm (inter-slice gap of 0.4 mm). The matrix size of the axial plane was 256 x 190 with a FoV of 180 x 180 mm and a slice thickness of 4.0 mm. T2 values were evaluated using a region-of-interest (ROI) assessment onsite with proprietary syngo.via workstation software (Siemens Healthcare, Erlangen, Germany). The two most central slices were evaluated for the sagittal assessment and then aggregated. Axial analysis was done on one single slice per intervertebral disc. The central 60 % of the discs’ diameter was assessed as nucleus pulposus. The posterior 20 % was analyzed as dorsal annulus fibrosus. The ROIs were copied between CPMG and GRAPPATINI T2 maps. A paired t-test and the calculation of Pearson correlation coefficients were performed for the acquired values in the respective area of examination.Results
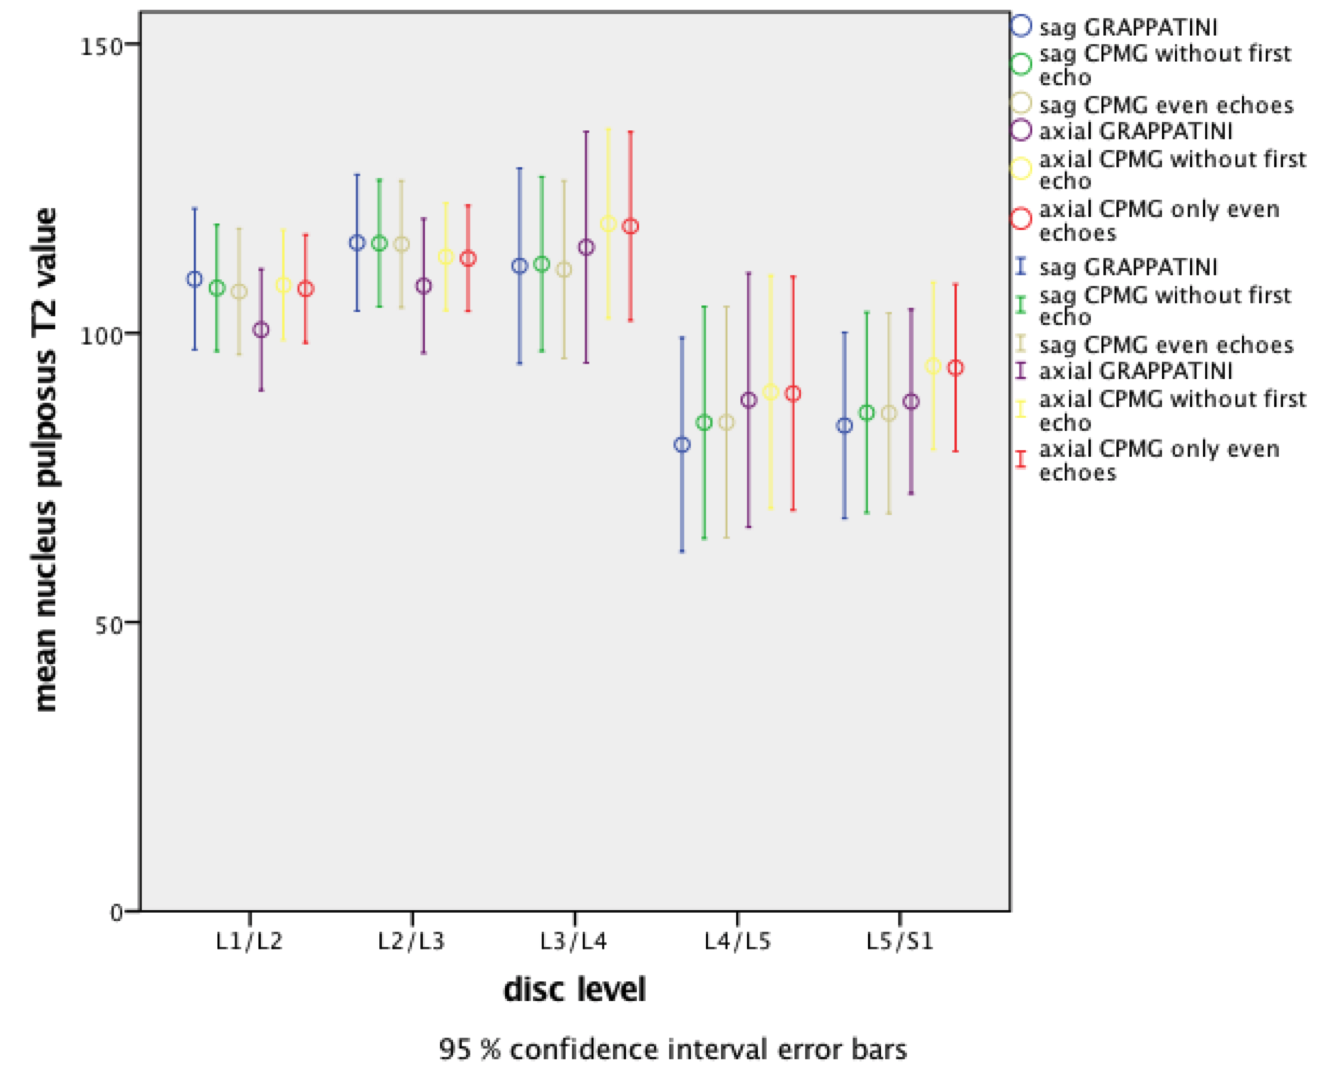
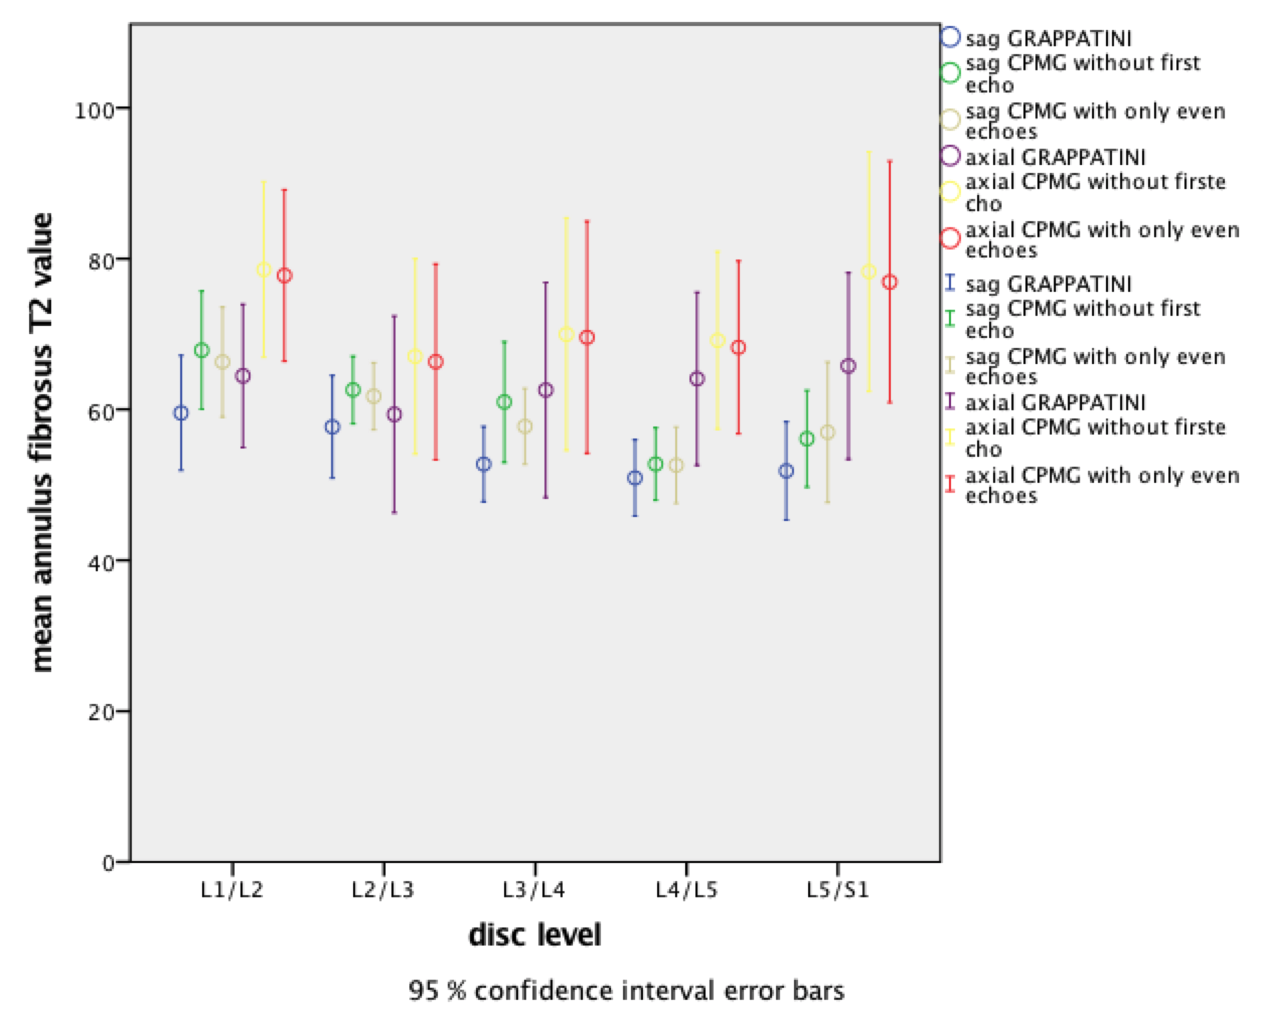
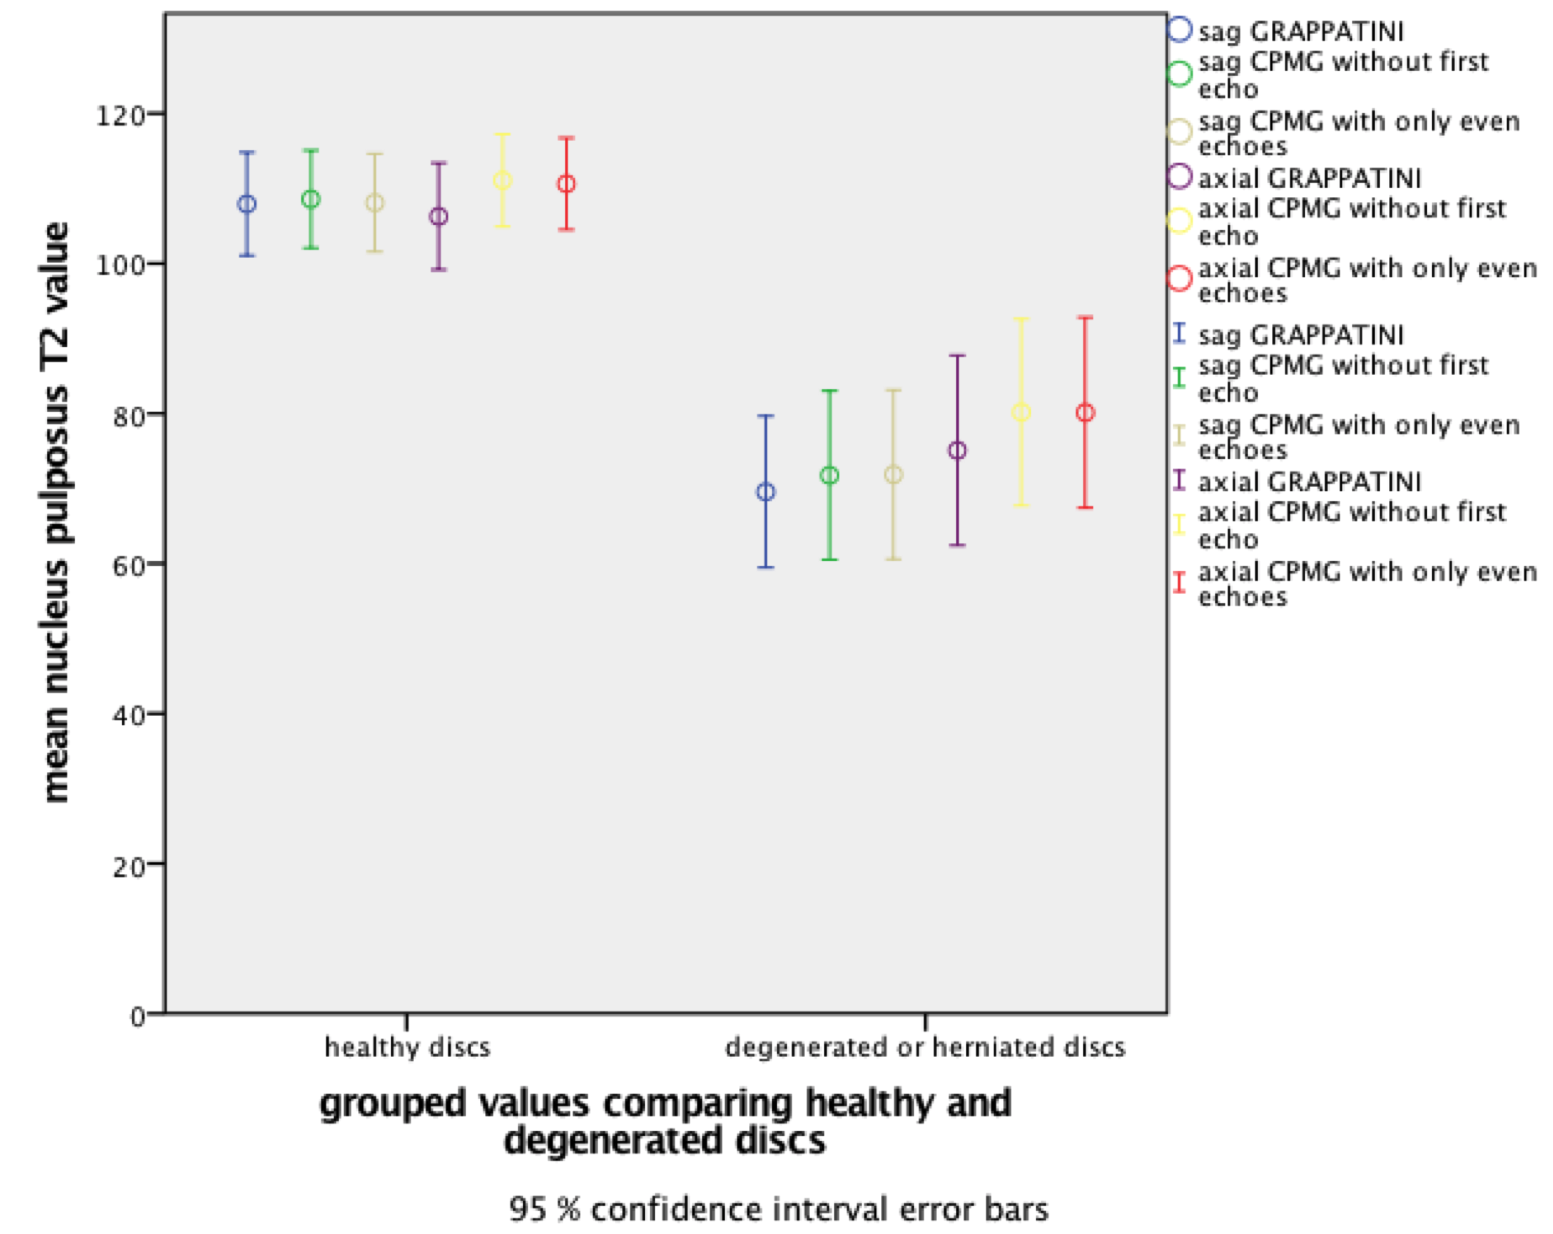
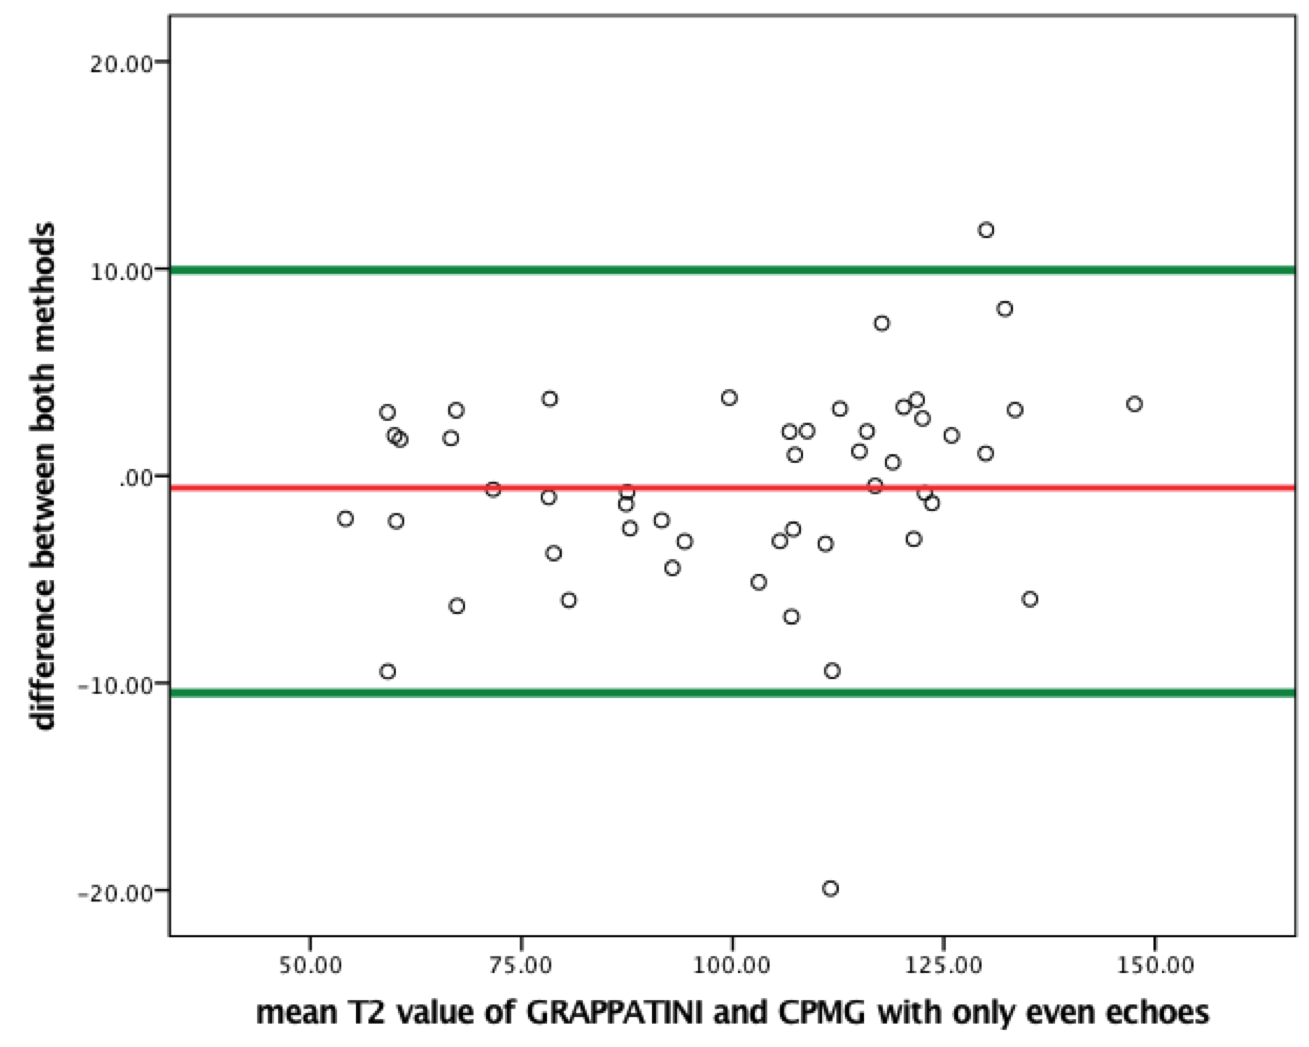
Mean T2 values of the nucleus for GRAPPATINI vs. CPMG without first vs. CPMG using only even echoes were 100.3 ± 27.2 ms vs. 101.2 ± 24.4 ms vs. 100.8 ± 24.3 ms with a significant (p < .001) correlation of r=.980 (GRAPPATINI vs. CPMG without first echo) and r=.981 (GRAPPATINI vs. CPMG with only even echoes) for sagittal maps and 97.9 ± 24.8 ms vs. 102.6 ± 22.9 ms vs. 102.2 ± 22.8 ms with a significant (p<.001) correlation of r=.963 (both) for axial T2 maps. For a graphical illustration and overview see Figure 1 and Figure 2. For the dorsal annular region in the same order, the sagittal T2 values were 54.6 ± 9.1 ms vs. 60.1 ± 10.2 ms vs. 59.1 ± 9.1 ms with a significant (p < .001) correlation of r = .618 and r = .696. The axial values were 64.7 ± 16.8 ms vs. 74.2 ± 19.5 vs. 73.4 ± 19.4 ms with a significant (p < .001) correlation of r=.887 and r=.890. For an overview of annular region T2 values see Figure 3. To outline clinical benefit, Figure 4 compares healthy and degenerated discs.Discussion
This preliminary data from an ongoing study suggests that a quantitative disc assessment using GRAPPATINI is accurate, feasible and coherent when directly compared with established CPMG methods. GRAPPATINI enables T2 relaxation time measurement in less than a fifth of the scan time compared to a conventional CPMG sequence with twofold GRAPPA acceleration.
A direct comparison with the standard method showed good coherence as seen in Figure 5.
Conclusion
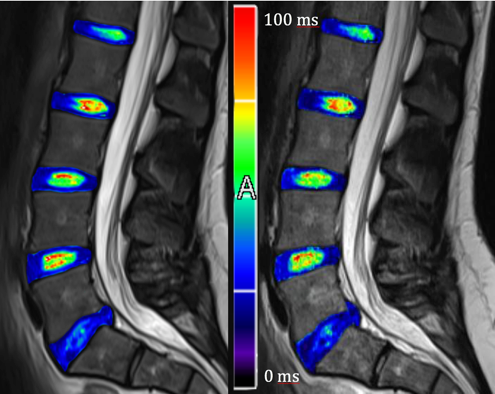
GRAPPATINI enables accurate T2 relaxation time measurements at good spatial resolution (0.7x0.9x4mm3) in clinically feasible measurement times (TA = 1:38min). Additionally, synthetic T2w images can be rendered at arbitrary echo times as previously demonstrated5 and as shown in Figure 2. The here presented work demonstrates that a clinical application in the early assessment of disease in cartilaginous or other tissues based on quantitative T2 relaxation time analysis with GRAPPATINI might be possible.Acknowledgements
No acknowledgement found.References
- Blumenkrantz, G. et al. In vivo 3.0-tesla magnetic resonance T1rho and T2 relaxation mapping in subjects with intervertebral disc degeneration and clinical symptoms. Magn Reson Med 63, 1193–1200 (2010).
- Marinelli, N. L., Haughton, V. M., Munoz, A. & Anderson, P. A. T2 relaxation times of intervertebral disc tissue correlated with water content and proteoglycan content. Spine (Phila Pa 1976) 34, 520–524 (2009).
- Sumpf, T. J., Uecker, M., Boretius, S. & Frahm, J. Model-based nonlinear inverse reconstruction for T2 mapping using highly undersampled spin-echo MRI. J. Magn. Reson. Imaging 34, 420–428 (2011).
- Galley, J., Maestretti, G., Koch, G. & Hoogewoud, H. M. Real T1 relaxation time measurement and diurnal variation analysis of intervertebral discs in a healthy population of 50 volunteers. Eur. J. Radiol. 87, 13–19 (2017).
- Marcus Raudner, Tom Hilbert, Tobias Kober, Vladimir Juras, Ewald Moser, Claudia Kronnerwetter, David Stelzeneder, S. T. GRAPPATINI put to use: How MSK applications benefit from highly undersampled T2 mapping and synthetic contrasts. Proc. Intl. Soc. Mag. Reson. Med. 25 25, 5090 (2017).
Figures