0337
Automatic Segmentation of Hip Cartilage with Deep Convolutional Neural Nets for the evaluation of Acetabulum and Femoral T1ρ and T2 relaxation times.Michael Girard1, Valentina Pedoia2, Berk Norman2, Jasmine Rossi-Devries2, and Sharmila Majumdar2
1Center for Digital Health Innovation, University of California, San Francisco, San Francisco, CA, United States, 2Department of Radiology and Biomedical Imaging, University of California, San Francisco, San Francisco, CA, United States
Synopsis
In this study we utilize a deep learning approach to automatically segment the femoral and acetabular cartilages in the hip. From these segmentations we also calculate T1ρ and T2 relaxation times then compare to manual segmentations and their T1ρ and T2 values. We show the T1ρ and T2 relaxation times, calculated using manual and automatic segmentations, are very correlated, R values above .94, and comparable.
Introduction
Anatomical segmentation of cartilage compartments plays an important part in the study of morphological cartilage features as well as the utilization of segmentations in Quantitative compositional MRI, as in T1ρ and T2 relaxation times1. Currently manual segmentation of cartilage compartments is the primary source of segmentation. Compared with the knee joint, hip cartilage is much thinner, with an average thickness of 1.4 mm and 1.2 mm for the femoral and acetabular plates, respectively. Moreover, due to the high curvature of the cartilage, the large majority of the voxels that compose the cartilage are severely affected by partial volume effect. The distinction between the individual cartilage plates (femoral and acetabular) is also particularly challenging in weight-bearing areas without the use of leg traction devices or contrast agents. In this work we present a deep learning approach to automatic segmentation of the cartilage compartments in the hip and compare T1ρ and T2 relaxation times calculated with automatic and manually segmented cartilage compartments.Method
Subjects: The subjects included in the analysis are part of a case-control study aimed to study the longitudinal changes in cartilage, biochemical composition, using magnetic resonance imaging (MRI), in subjects with and without radiographic hip OA. Unilateral hip MR images were obtained on a 3T scanner (GE Healthcare, Waukesha, WI) using an 8-channel receive-only cardiac coil (GE Healthcare, Waukesha, WI), see Table 1. Imaging Protocol: See Table 2. Image processing: Before processing the volumes were cropped to a width x height of 256×256. The cropping was done by using a Hough circle transform to find the Femoral head and taking a 256×256 pixel box centered on the largest circle found in the volume. The data was also augmented by randomly translating the center of the Hough circle by a small fraction of the circle radius. Deep Learning: A U-Net was used for the architecture2. The network was trained for approximately 12 hours on a Nvidia Titan X GPU. Analysis: 4530 total slices were used in training. A train/test split of 80/20 was used and unless specifically stated all following results describe the test data set. Dice coefficients of the automatic segmentation were calculated in Python. Manual and automatic segmentations were used to compute T1ρ and T2 times in acetabulum and femoral cartilage compartments as described in 3. The relaxation times for each cartilage and total cartilage volume were then compared for correlation and paired Student t-test, done in the Python package Scipy.Results
The training data set Dice coefficients was higher that the validation data set, with a training dice of 0.94 and 0.93 for the Femoral and Acetabular cartilage, respectively. The validation Dice coefficients were 0.74 and 0.73 for Femoral and Acetabular cartilages. The discrepancy is most likely caused by the smaller data set and the class imbalance caused by the cartilage size and the low number of slices per volume containing cartilage. When both segmentations were used to calculate T1ρ and T2 relaxation times the results were highly correlated, R=.9439 and R=.9667, for T1ρ relaxation times of the Femoral and Acetabular cartilage and R=.9697 and R=.9706 when comparing the T2 relaxation times. The mean absolute difference of the T1ρ and T2 relaxation times was 1.04 and 0.81 (msec) for the Femoral cartilage and 1.25 and 1.13 (msec) for the Acetabular cartilage. The Femoral T1ρ and T2 relaxation times, as well as the T1ρ of the Acetabular cartilage showed no statistically significant difference in the sample means with p values of 0.7522, 0.4203 and 0.1180, respectively. The T2 relaxation time of the Acetabular cartilage did show a statically significant difference in sample means with a p value of 0.0001. The volumes of the Femoral cartilages had an average difference of 14.4% when compared to the manual segmentation. The Acetabular volumes had an average difference 15% when compared to s manual segmentations. The total cartilage compartment volume had a correlation coefficient of R= .7605.Discussion and Conclusion
Despite slight overfitting it is reassuring that the automatic segmentations can still accurately calculate the T1ρ and T2 relaxation times. The slight vertical offset in the T2 relaxation of the Acetabular cartilage, seen in Figure 3., is the most probable cause of the paired Student t-test p value for that measurement. In this study we’ve shown that deep neural nets can segment hip cartilage, despite their relatively thin volumes and that these segmentations preserve valuable information, T1ρ and T2 relaxation times.Acknowledgements
Funding from NIH ARP50AR060752, NIH AR R01046905, NIH K99AR070902.References
1. Li X, Majumdar S. “Quantitative MRI of articular cartilage and its clinical applications.”, Journal of magnetic resonance imaging 2013;38:991-1008. 2. Ronneberger O, Fischer P, Brox T. “U-Net: Convolutional Networks for Biomedical Image Segmentation.”, CoRR 2015; 1505.04597 3. Gallo MC, Wyatt C, Pedoia V, Kumar D, Lee S, Nardo L, Link TM, Souza RB, Majumdar S. “T1ρ and T2 relaxation times are associated with progression of hip osteoarthritis.” Osteoarthritis Cartilage (2016), 10.1016/j.joca.2016.03.005:S1063-4584(16)01062-1Figures
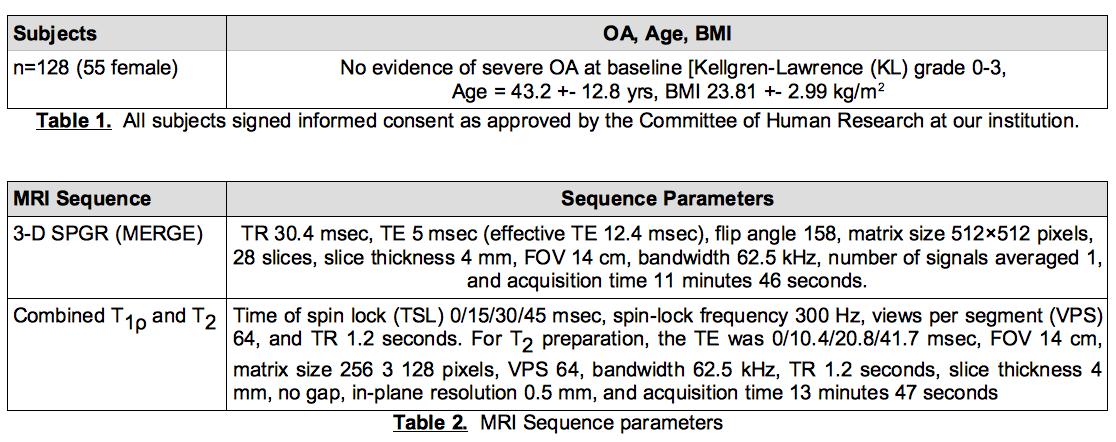
Table 1. All subjects signed informed consent as approved by the Committee of Human Research at our institution.
Table 2. MRI Sequence parameters
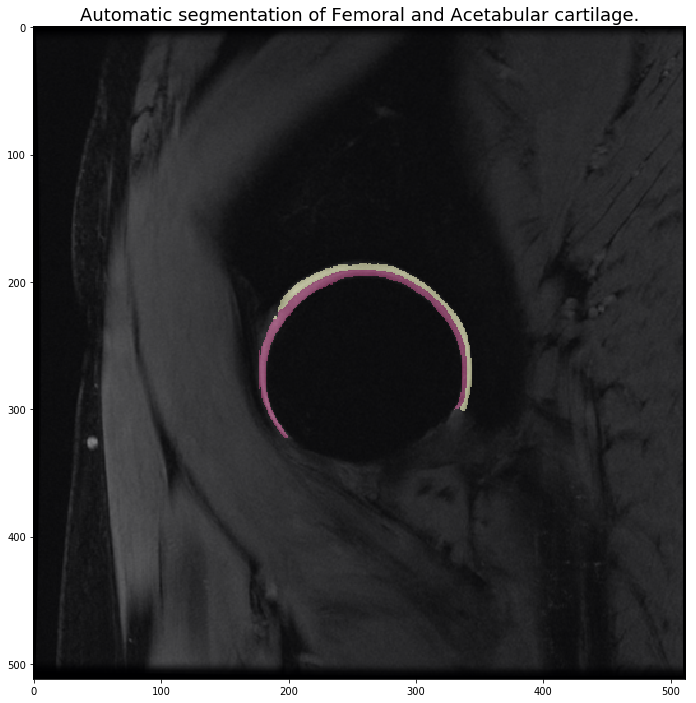
Example
of automatic segmentation of the Femoral and Acetabular cartilage.
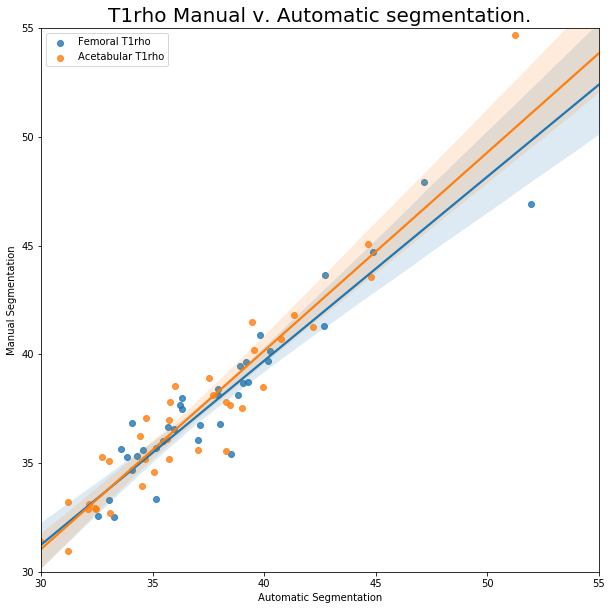
T1ρ
relaxation
time calculated using automatic and manual segmentations.
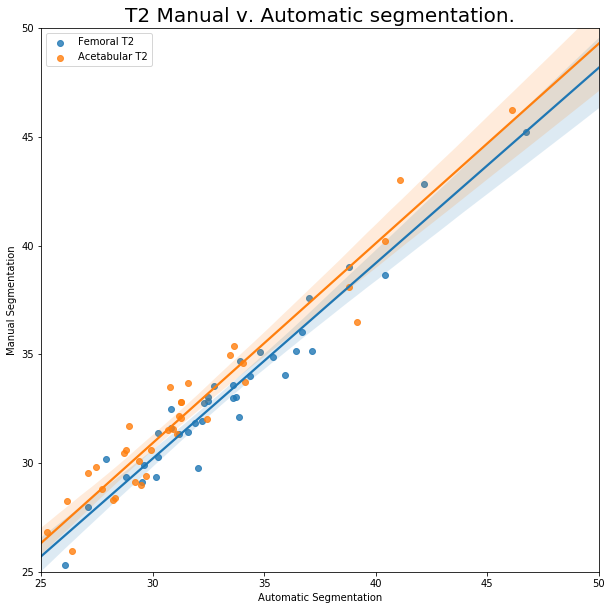
T2
relaxation time calculated using automatic and manual segmentation.