0335
Knee Cartilage UTE T2* Quantification with Water-Fat Decomposition1Radiology and Biomedical Imaging, University of California, San Francisco, San Francisco, CA, United States, 2Global MR Applications and Workflow, General Electric, San Diego, CA, United States, 3Joint Graduate Program in Bioengineering, University of California, San Francisco/Berkeley, San Francsico, CA, United States
Synopsis
Recently, there has been a growing interest in assessing lesions in the deep layers of knee cartilage as a pathogenesis of osteoarthritis. Ultrashort echo-time (UTE) T2* mapping in the deep layers has demonstrated great potential to detect early degenerative changes. Fat suppression is normally accompanied to reduce off-resonance artifacts from adjacent fatty tissues; however, it can also suppress significant amount of short T2 tissues and affect quantification. In this work, we quantified cartilage T2* by decomposing fat and water components using no fat-suppressed 3D multi-echo UTE images and demonstrated shorter T2* compared to that from fat-suppressed 3D UTE images.
Introduction
Knee MR imaging techniques have focused on evaluating degeneration of cartilage in superficial layers because conventional MRI cannot capture the signal of the deep layers (calcified and radial layers) due to short T2 relaxation times. However, there has been a growing interest in assessing lesions in the deep layers as a pathogenesis of osteoarthritis.1-2 Recently, it has been shown that T2* mapping in the deepest layers using ultrashort echo-time (UTE) imaging has a potential to detect early cartilage degenerative change.3-4 Fat suppression is normally accompanied with knee cartilage T2 quantification to reduce off-resonance artifacts from adjacent fatty tissues. However, it can also suppress a significant amount of short T2 components and thus affect quantification.5 In this work, we demonstrated a feasibility of quantifying cartilage T2* by simultaneously fitting water and fat components to the acquired signals6 from a 3D UTE multi-echo sequence.Methods
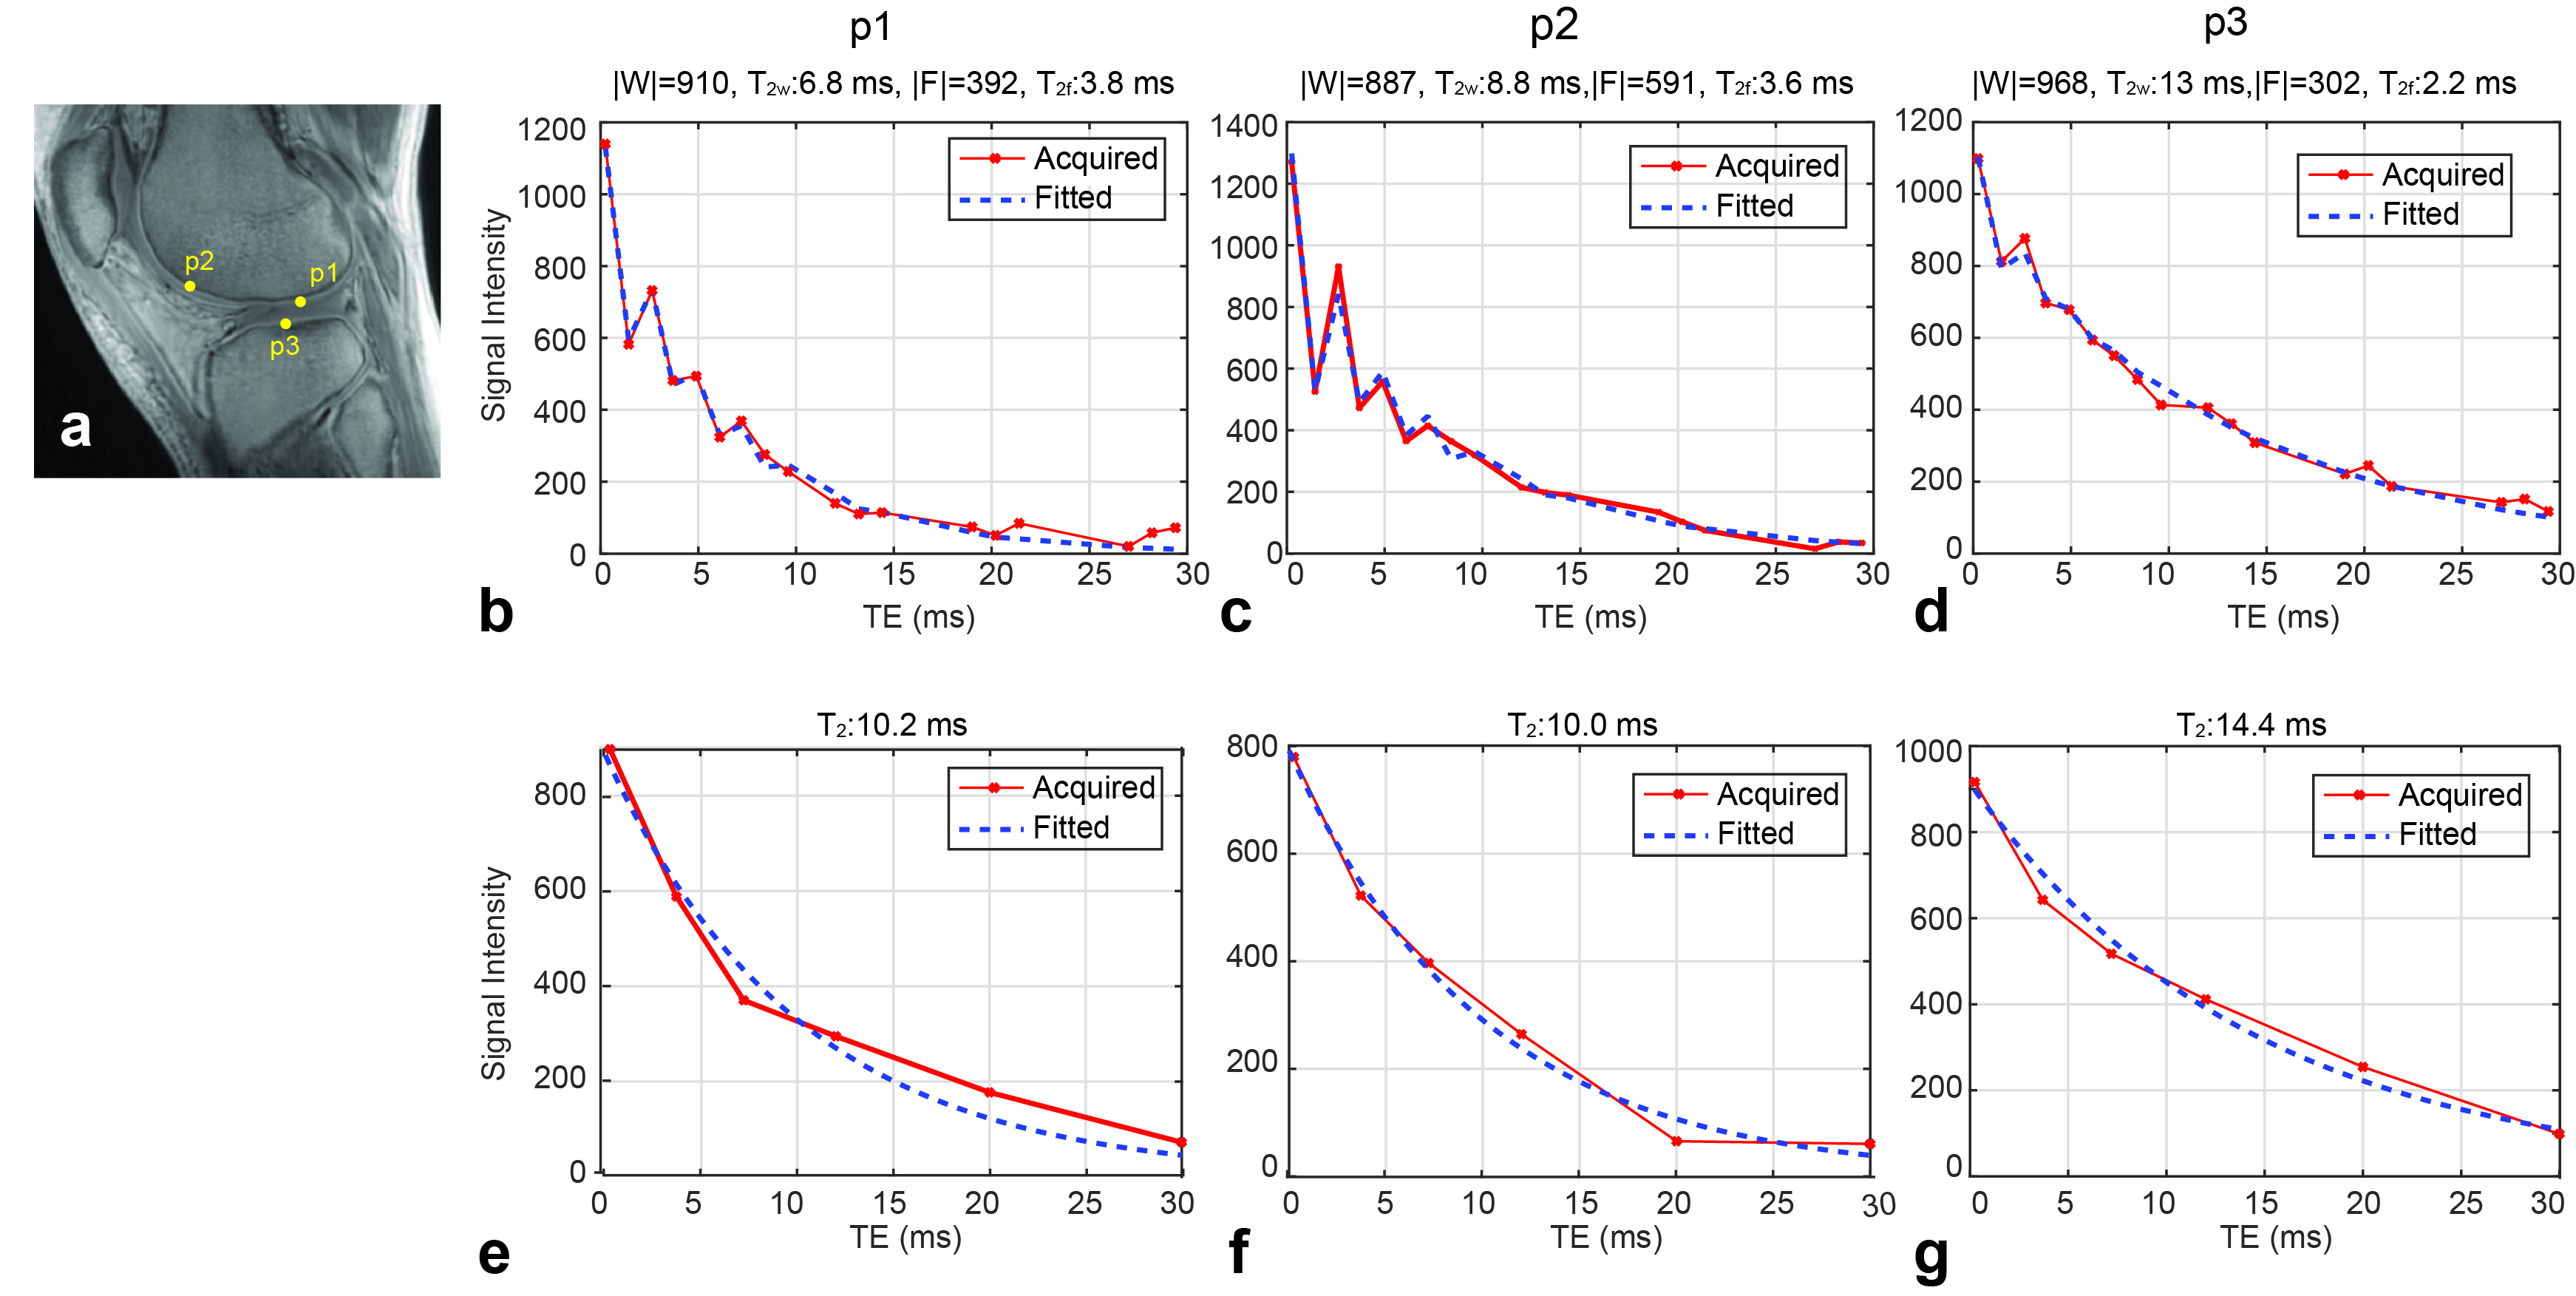
Two in vivo knee experiments were conducted on a Discovery MR 750w 3T scanner (GE Healthcare, Waukesha, WI) using an eight-channel transmit/receive knee coil (In Vivo Corp, Cainesville, FL). A 3D interleaved multi-echo UTE cones sequence7 was used to acquire signals over 18 TEs. A minimum-phase RF pulse was used for slab-selection, and 14 x 14 x 7.2 cm3 FOV (sagittal plane), 0.55x0.55x2 mm3 resolution, 20° flip angle, and 37 ms TR were prescribed. For one TR, six echoes with TEs of 0.24, 3.7, 7.2, 12, 19 and 27 ms were acquired, and for the other two TRs, delays of 1.2 ms and 2.4 ms were added between the end of RF and the first echo (25 min scan time). For comparison, a 3D multi-echo UTE Cones imaging with the same TR and flip angle was performed with fat suppression applied every four spoke acquisitions and TEs of 0.24, 3.7, 7.2, 12, 20 and 30 ms (9 min scan time). Fat suppression was conducted by a frequency-selective pulse with 8 ms duration. From acquired k-space data, 3D gridding was performed by using nonuniform fast fourier transform from Berkeley Advanced Reconstruction Toolbox,8 and ESPIRiT sensitivity maps9 were used to combine coil images to maintain image phase. Interleaved UTE cones images over 18 echoes were used to quantify water and fat T2* with incorporating a multi-frequency fat spectrum model.10 For each voxel, the complex signal at echo time TE was modeled as
$$S(TE)=(We^{-TE/T_{2w}}+F(\sum_1^P\alpha_p\cdot e^{j2\pi f_pTE}) e^{-TE/T_{2f}} ) \cdot e^{j2\pi \psi TE}$$
where W and F are complex water and fat components, T2W* and T2F* are relaxation times for water (cartilage) and fat respectively, and $$$\psi$$$ is the local frequency offset (in Hz) due to B0 field inhomogeneity. The frequencies for the multiple spectral peaks of fat relative to the water peak (fp) and the relative amplitudes (αp) were predetermined here, using values measured by Hamilton G, et al.12 W, F, T2W*, T2F*, and $$$\psi$$$ were fit using a non-linear least squares solver in Matlab (Mathworks) with constrained parameter values. From fat-suppressed UTE cones images, mono-exponential T2* fitting was performed from the magnitudes.
Results
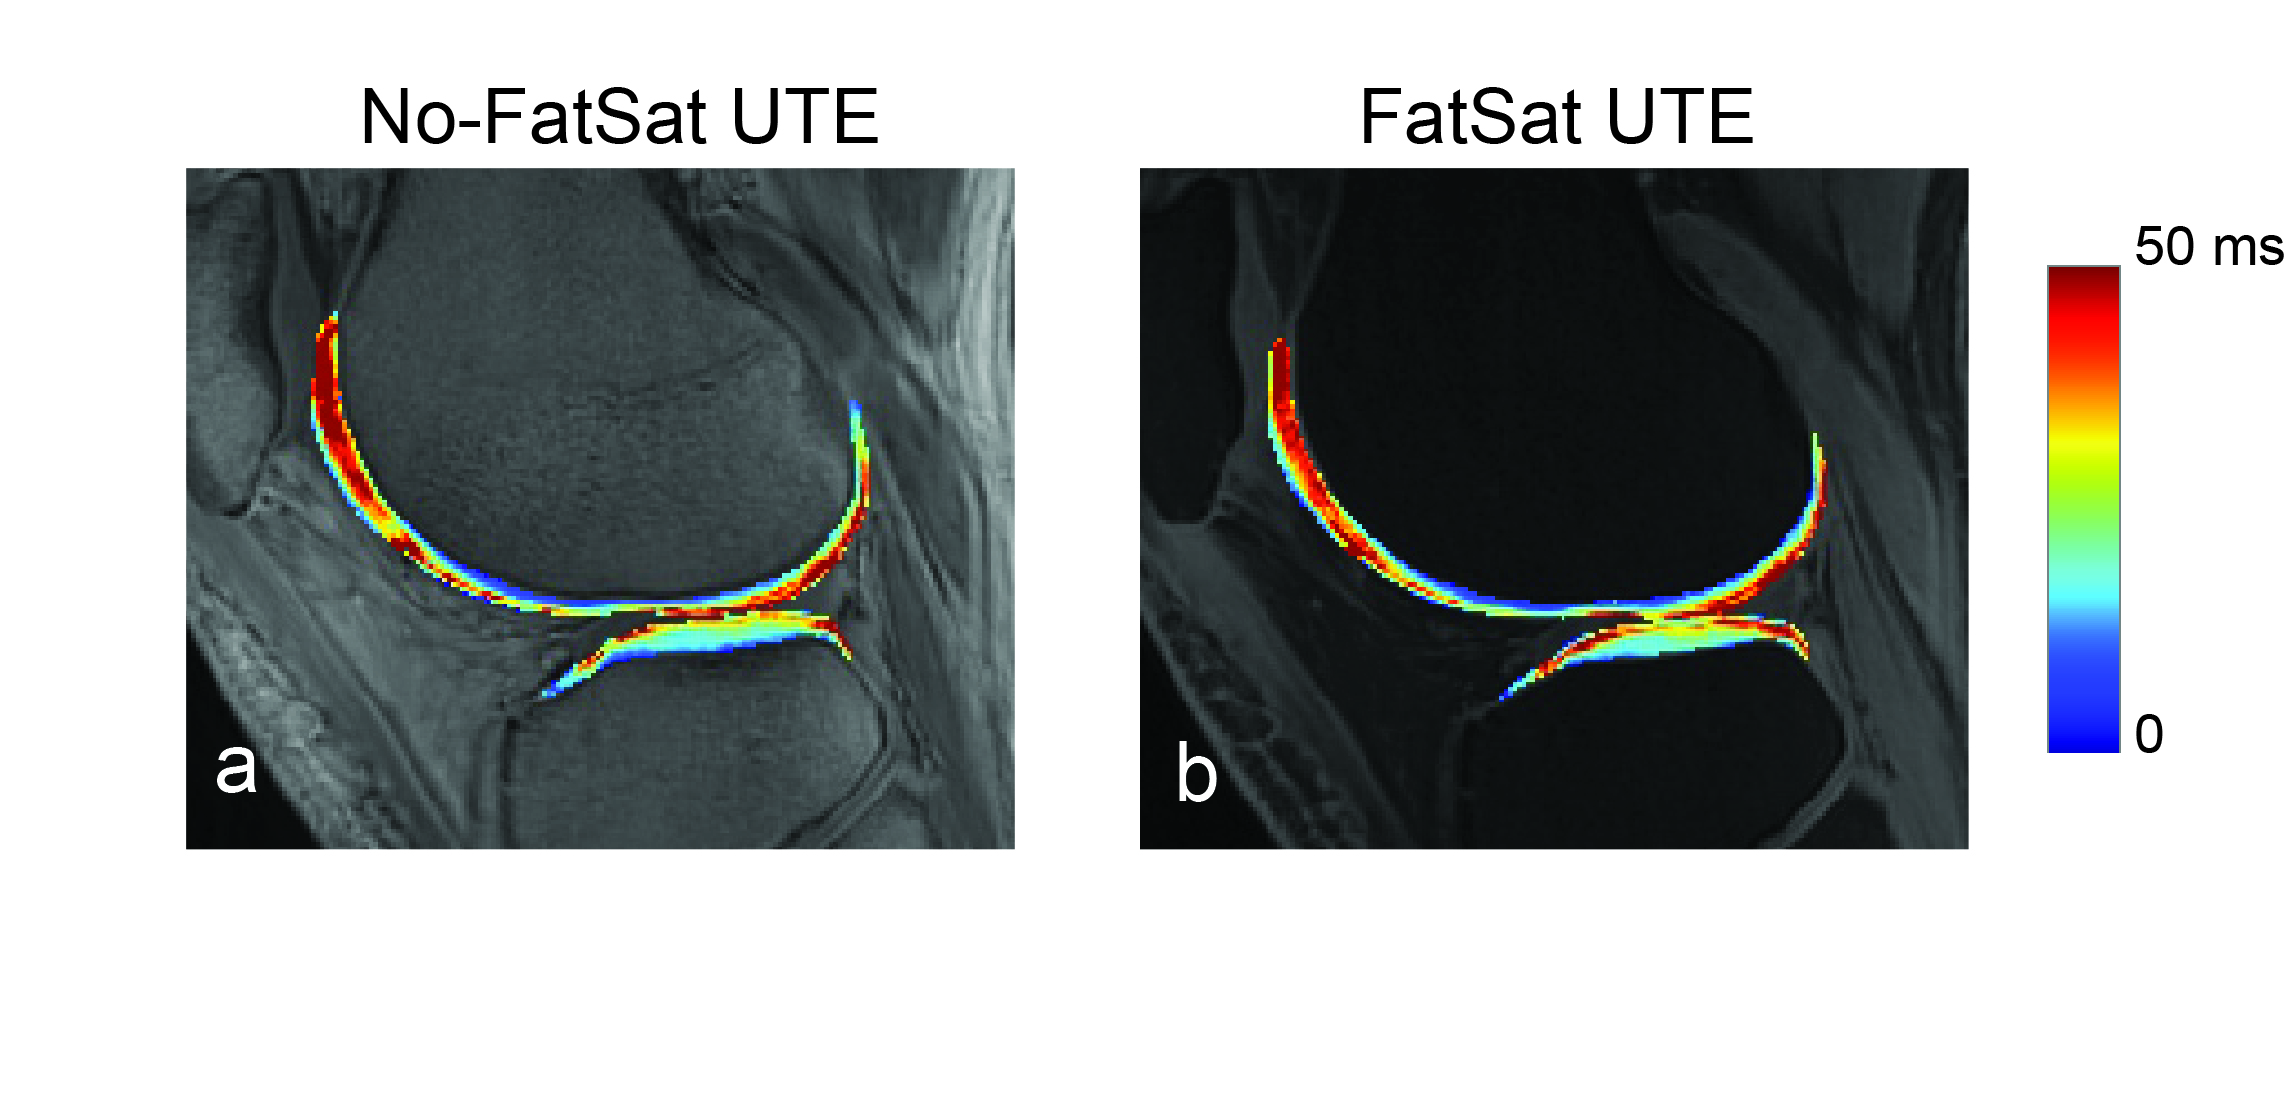
Figure 1 shows UTE images (TE=0.24 ms) without and with fat suppression from one representative subject compared to a standard fat-saturated 2D fast-spin echo image. Bright signal from cartilage deep layers can be seen on UTE images. Figure 2 shows acquired signal variations from both sets of UTE images, from voxels located on the deep layers denoted in (a). The fitted signal variations from the least-squares estimation and estimated values are also denoted. Figure 3 shows a quantified cartilage T2* map from UTE images without and with fat suppression. Based on ROI analysis from 11 ROIs located on the deep layers over the whole knee, the mean T2* from no fat-suppressed UTE images was 12.85$$$\pm$$$1.68 ms while that from fat-suppressed UTE images was 14.84$$$\pm$$$3.7 ms.Discussion
UTE T2* mapping allows for quantifying T2* over both superficial and deep layers of cartilage. When fat suppression is not applied, off-resonance artifacts from adjacent fatty tissues can make it difficult to measure accurate cartilage T2* relaxation curves for quantification. By adding the fat component to a signal model, water and fat T2* can be simultaneously fitted using a nonlinear least-squares method. The quantified water T2* values were in overall smaller than those from fat-suppressed UTE images from our experiment. The TE values or number of TEs can be further optimized to enable more robust fitting or improve efficiency. UTE cones T2* mapping can also be easily accelerated by combining with parallel imaging and compressed sensing techniques.Conclusion
By using complex images from 3D UTE multi-echo cones sequence, it is possible to fit water and fat components separately using a nonlinear least squares method and quantify cartilage T2* without affected by fat suppression.Acknowledgements
This work was supported by NIH R01 125080 and GE Healthcare.References
1. Burr DB. Anatomy and physiology of the mineralized tissues: role in the pathogenesis of osteoarthrosis. Osteoarthritis Cartilage 2004;12(Suppl A):S20-30.
2. Muir P, McCarthy J, Radtke CL, et al. Role of endochondral ossification of articular cartilage and functional adaptation of the subchondral plate in the development of fatigue microcracking of joints. Bone 2006;38:342-349.
3. Williams A, Qian Y, Bear D, Chu CR. Assessing degeneration of human articular cartilage with ultra-short echo time (UTE) T2* mapping. Osteoarthritis Cartilage. 2010;18(4):539-546.
4. Chu CR, Williams AA, West RV, et al. Quantitative Magnetic Resonance Imaging UTE-T2* Mapping of Cartilage and Meniscus Healing After Anatomic Anterior Cruciate Ligament Reconstruction. Am J Sports Med 2014;42(8):1847-1856.
5. Carl M, Nazaran A, Bydder GM, Du J. Effects of fat saturation on short T2 quantification. Magn Reson Imaging. 2017;43:6-9.
6. Bydder M, Shiehorteza M, Yokoo T, et al. Assessment of liver fat quantification in the presence of iron. Magn Reson imaging. 2010;28(6):767-776.
7. Gurney PT, Hargreaves BA, Nishimura DG. Design and analysis of a practical 3D cones trajectory. Magn Reson Med 2006;55(3):575-582.
8. BART 10:5281/zenodo.44511
9. Uecker M, Lai P, Murphy, et al. ESPIRiT—an eigenvalue approach to autocalibrating parallel MRI: Where SENSE meets GRAPPA. Magn Reson Med 2014;71: 990–1001.
10. Yu H, Shimakawa A, McKenzie CA, et al. Multiecho water‐fat separation and simultaneous R2* estimation with multifrequency fat spectrum modeling. Magn Reson Med 2008;60(5):1122-1134.
11. Hamilton G, Yokoo T, Bydder M, Cruite I, Schroeder ME, Sirlin CB, Middleton MS. In vivo characterization of the liver fat (1)H MR spectrum. NMR Biomed 2011;24:784–790.
Figures