0334
Temporal Changes of a Canine Model of Patellar Tendinopathy Using UTE MRI T2* Assessment: A Pilot StudySarah G. Pownder1, Kei Hayashi2, Brian G. Caserto3, Bin Lin1, Hollis G. Potter1, and Matthew F. Koff1
1Department of Radiology and Imaging - MRI, Hospital for Special Surgery, New York, NY, United States, 2Cornell University, Ithaca, NY, United States, 3VetPath Services, Stone Ridge, NY, United States
Synopsis
Tendon damage has been traditionally evaluated invasively with biopsy. This pilot study evaluated the effects of an induced mechanical strain of the patellar tendon on UTE-MRI metrics and corresponding histology. The induced strain had a greater effect on the quantitative MRI metrics over time, by percentage change, than by the level of induced strain. A corresponding histologic analysis had similar findings. The results indicate the capability of utilizing MRI to evaluate differences in the quantitative T2* metrics of the patellar tendon. Time dependent changes in quantitative UTE-MRI metrics may be detected using a model of induced subclinical tendon damage.
Introduction
Patellar tendinosis (PT) presents clinically as swelling, pain, and reduced functional performance [1], and exhibits collagen disorganization [2]. Magnetic Resonance Imaging (MRI) is optimal for visualizing tendons in vivo [3] ; however, tendons typically exhibit little signal on traditional fast-spin echo (FSE) sequences due to their highly ordered collagen composition and short T2 values. Damaged tendons will exhibit signal on FSE images but subtle injuries or early degeneration may escape detection [4]. While conventional MRI sequences may display tendon rupture, image interpretation relies on subjective assessment of signal intensity, which does not correlate to any specific histologic characteristic and varies with pulse sequence acquisition. New MRI techniques, such as ultrashort echo time (UTE) imaging, can visualize tissue species with very short T2 values (T2<5ms) [5], and permit calculation of T2*, a reproducible decay constant [6]. T2* prolongation may be used as a biomarker of disruption of highly ordered tissues such as tendons, ligaments, menisci and periosteum [4], detecting early changes of structural damage, as our lab and others have shown [7].The purpose of this pilot study was to evaluate a canine model of strain-induced patellar tendinosis, correlating tendon damage with UTE and histology.Methods
IACUC approval was obtained for this project. Sixteen intact male intact beagles (28 stifles) were used. Surgical placement of one of two metal rods of known diameter (Æ=4.76mm [Low Strain, n=15] or 6.35mm [High Strain, n=13]) positioned against the deep margin of the patellar tendon (Fig. 1). Animals were divided into 4 week and 8 week groups to evaluate patellar tendons on MRI. In vivo scanning was performed on a 3.0T clinical imaging system (DVMR 750, GE Healthcare), using an 8 channel transmit/receive (T/R) knee coil (Invivo). Multi-planar morphologic FSE images were acquired for 14 tested stifles: TE/TR: 25 ms/4500 ms, ETL: 12, RBW: ±83.3 kHz, voxel size (VS): 0.26 x 0.26 x 1.5 mm3, NEX: 3. A sagittal 3D CONES UTE series was acquired: TEs=0.03 to 9.0 ms, with ΔTE=0.5 ms, flip angle: 15°, TR:25ms, VS: 0.38 x 0.38 x 3 mm3, RBW: ±125 kHz, NEX: 1. The MRI metrics of short T2* value (T2*S) and long T2* value (T2*L) and the percentage contribution of T2*S and T2*L species, PS and PL respectively, were calculated from the signal intensity and corresponding TEs on a voxel-by-voxel basis (MATLAB, Natick, MA) [8]. The extracted patellar tendon was fixed in formalin, paraffin embedded, cut to 6μm, and stained using H&E. Longitudinal sections of the tendon were scored for collagen fiber disruption, tenocytes, ground substance, vascularity, and cellularity ranging from 0 to 4 [9], with a larger score for each category indicative of greater damage present. Polarized light microscopy was performed and percent and mean birefringence was calculated. Data was summarized with medians and first (Q1) and third quartiles (Q3). Median differences between low and high strain and between 4 and 8 weeks were calculated.Results
Minimal differences of MRI metrics were detected between low and high strain groups. The high strain group had a 12.5% increase of T2*S, a 11.4% reduction of T2*L and 9.4% reduction of PS (Table 1). Larger differences of MRI metrics were detected between the 4 and 8 week time points. The 8 week PTs had a 20.0% reduction of T2*S, a 26.6% reduction of T2*L, and a 14.8% increase of PS as compared to the 4 week time point. (Table 1). Histology of the high strain group displayed greater collagen fibril disruption but better cellularity. Histology at 8 weeks displayed reduced cellularity, granulation, and tenocyte morphology than at 4 weeks. The strained tendons demonstrated variable regions of T2* prolongation, which was seen histologically as disruption (Fig. 2).Discussion
This pilot study evaluated the effects of an induced mechanical strain of the patellar tendon on UTE-MRI metrics and corresponding histology. The induced strain had a greater effect on the quantitative MRI metrics over time, by percentage change, than by the level of induced strain. A corresponding histologic analysis had similar findings. The results indicate the capability of utilizing quantitative T2* MRI to evaluate differences in tissue response to load, correlating imaging parameters to mechanical damage. Future evaluation will compare these results to the intact, unaffected patellar tendon.Conclusion
Time dependent changes in quantitative UTE-MRI metrics may be detected using a model of load-induced subclinical tendon damage.Acknowledgements
HSS has an institutional research agreement in place with GE Healthcare.References
1. Khan KM et al. 1998, Br J Sports Med; 2. Karlsson J et al, 1992, Am J Sports Med; 3. Beltran J et al, 1987, Radiology; 4. Gold GE et al, 1995, Magn Reson Med; 5. Du J et al, 2009, Magn Reson Imaging 6. Qian Y et al, 2013, Magn Reson Med; 7. Koff MF et al 2013, Osteoarthritis Cartilage; 8: Chang EY et al, 2014 J Magn Reson Imaging; 9. Cook JL, et al 2004, J Orthop Res.Figures
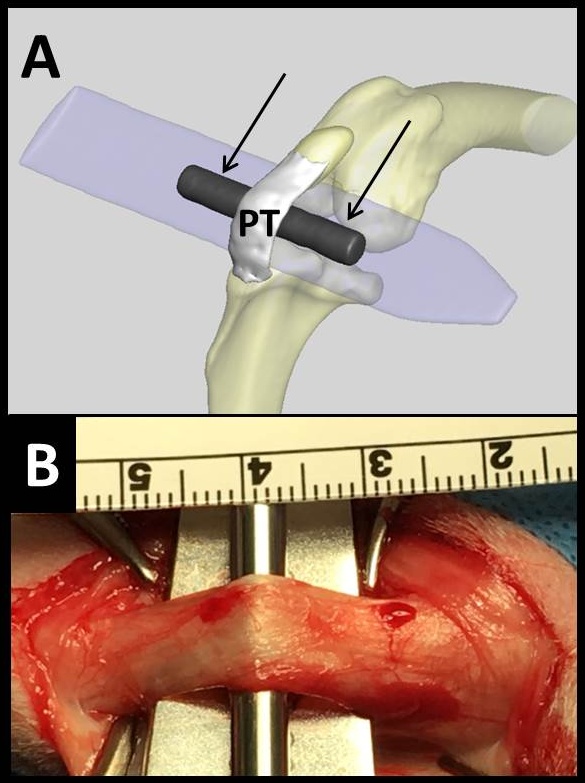
Figure 1. (A) Schematic of application of strain via
cylindrical metal rod to the patellar tendon (PT). (B) Intra-operative photo of
the tendon straining procedure.
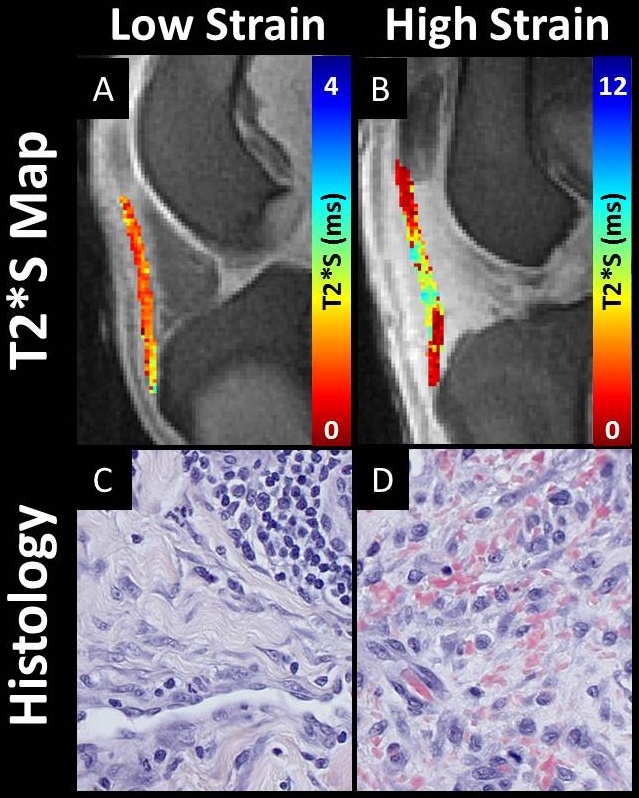
Figure 2. Representative T2*S maps and histology for the high
strain (A,C) and low strain (B,D) groups. The T2*S maps display prolongation
and variability, with histologic confirmation of disruption and lack of visible
collagen bundles following application of a high strain.
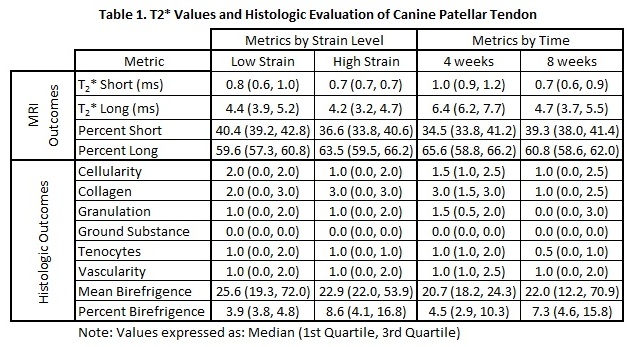
Table 1. T2* Values and Histologic Evaluation of Canine Patellar Tendon