0333
Subregional bone marrow adipose tissue composition in the proximal femur: Comparison of 3T Chemical Shift Encoded-MRI and Magnetic Resonance Spectroscopy1Radiology, NYU Langone Health, New York, NY, United States, 2Université de Lyon; CREATIS CNRS UMR 5220, Inserm U1206, INSA-Lyon, UCBL Lyon 1, Villeurbanne, France, 3Osteoporosis Center, Hospital for Joint Diseases, NYU Langone Health, New York, NY, United States, 4Department of Rheumatology, NYU Langone Health, New York, NY, United States
Synopsis
Studies of bone marrow adipose tissue (bMAT) composition in osteoporosis has revealed increased [a1] in fat content and decreased unsaturated fatty acid in the proximal femur in osteoporosis (OP) patients compared to controls. Advancements in MR image-based methods for fat assessment have allowed quantification of fat content though chemical-shift encoded MRI (CSE-MRI). CSE-MRI methods have not been compared to MRS for bMAT composition assessment. The aim of this study was to quantify, within subregions of the proximal femur, bone marrow PDFF as well as saturated and unsaturated fat using both CSE-MRI and MRS.
Introduction
Studies of bone marrow adipose tissue (bMAT) composition in osteoporosis has revealed increased in fat content and decreased unsaturated fatty acid in the proximal femur in osteoporosis (OP) patients compared to controls1, and increased total bMAT adiposity in the vertebrae of subjects with OP2. Therefore, the composition of fatty acids in bone marrow may serve as a biomarker for OP. Previously, such biomarker assessment has been made mainly using Magnetic Resonance Spectroscopy (MRS), which is difficult to implement on a clinical basis mainly due to the long acquisition times needed to sample multiple voxel-limited areas of the bone. Advancements in MR image-based methods for fat assessment have allowed quantification of fat content though chemical-shift encoded MRI (CSE-MRI). The obtained proton density fat fraction (PDFF) images have been applied predominantly in the liver, but have also already been used in bone marrow investigations 3,4 . Recently, CSE-MRI based reconstruction methods have been further developed to simultaneously quantify PDFF and fatty acid composition in vitro and in vivo in the fatty liver5,6 and adipose tissue7. However, these CSE-MRI methods have not been compared to MRS for bMAT composition assessment. Therefore, the aim of this study was to quantify, within subregions of the proximal femur, bone marrow PDFF as well as saturated and unsaturated fat using both CSE-MRI and MRS.Material & Method
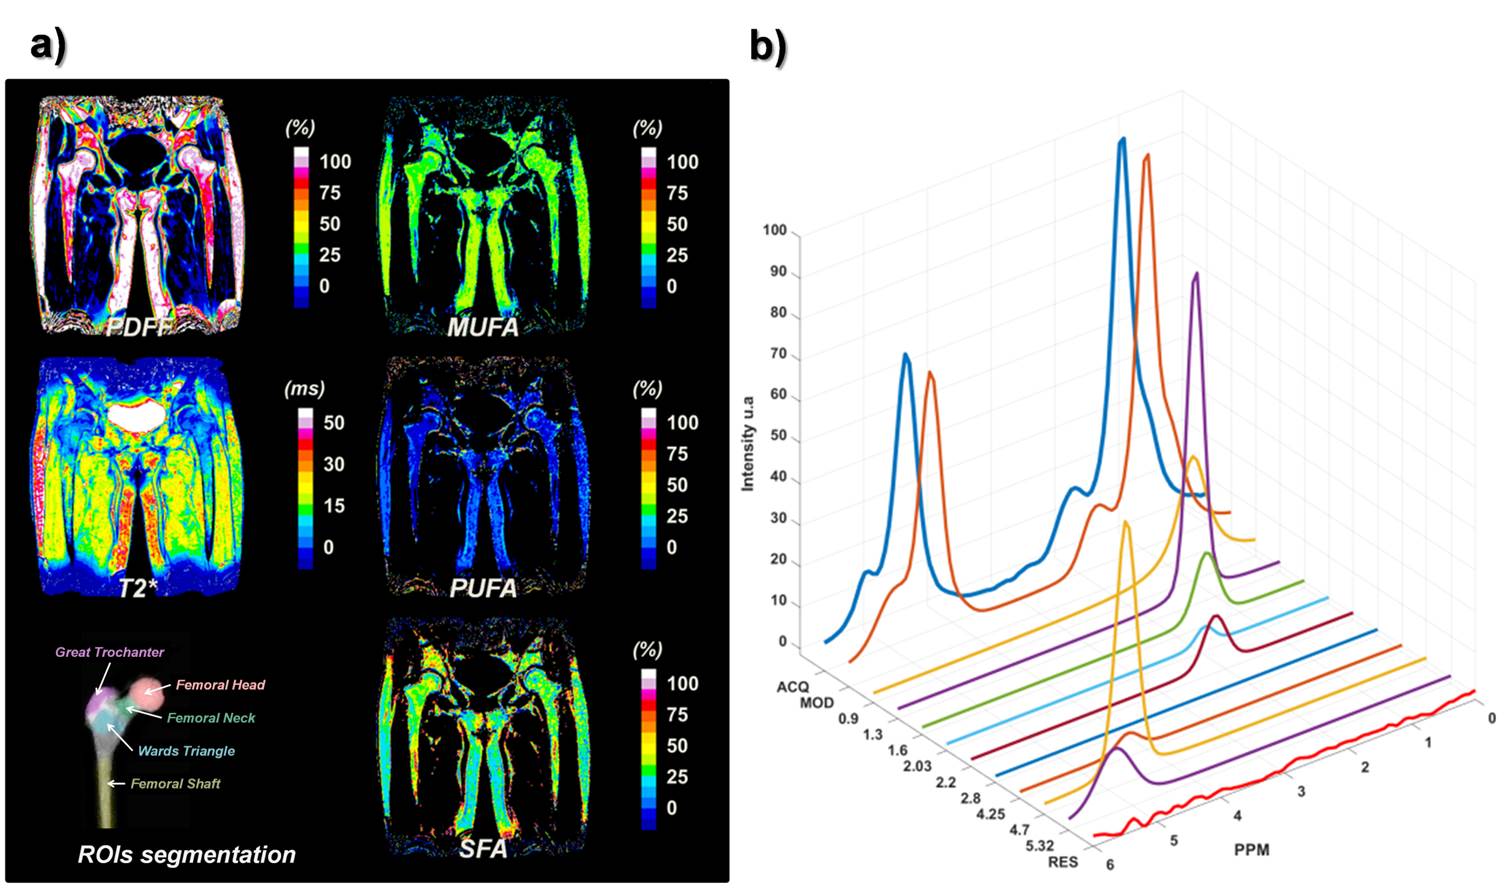
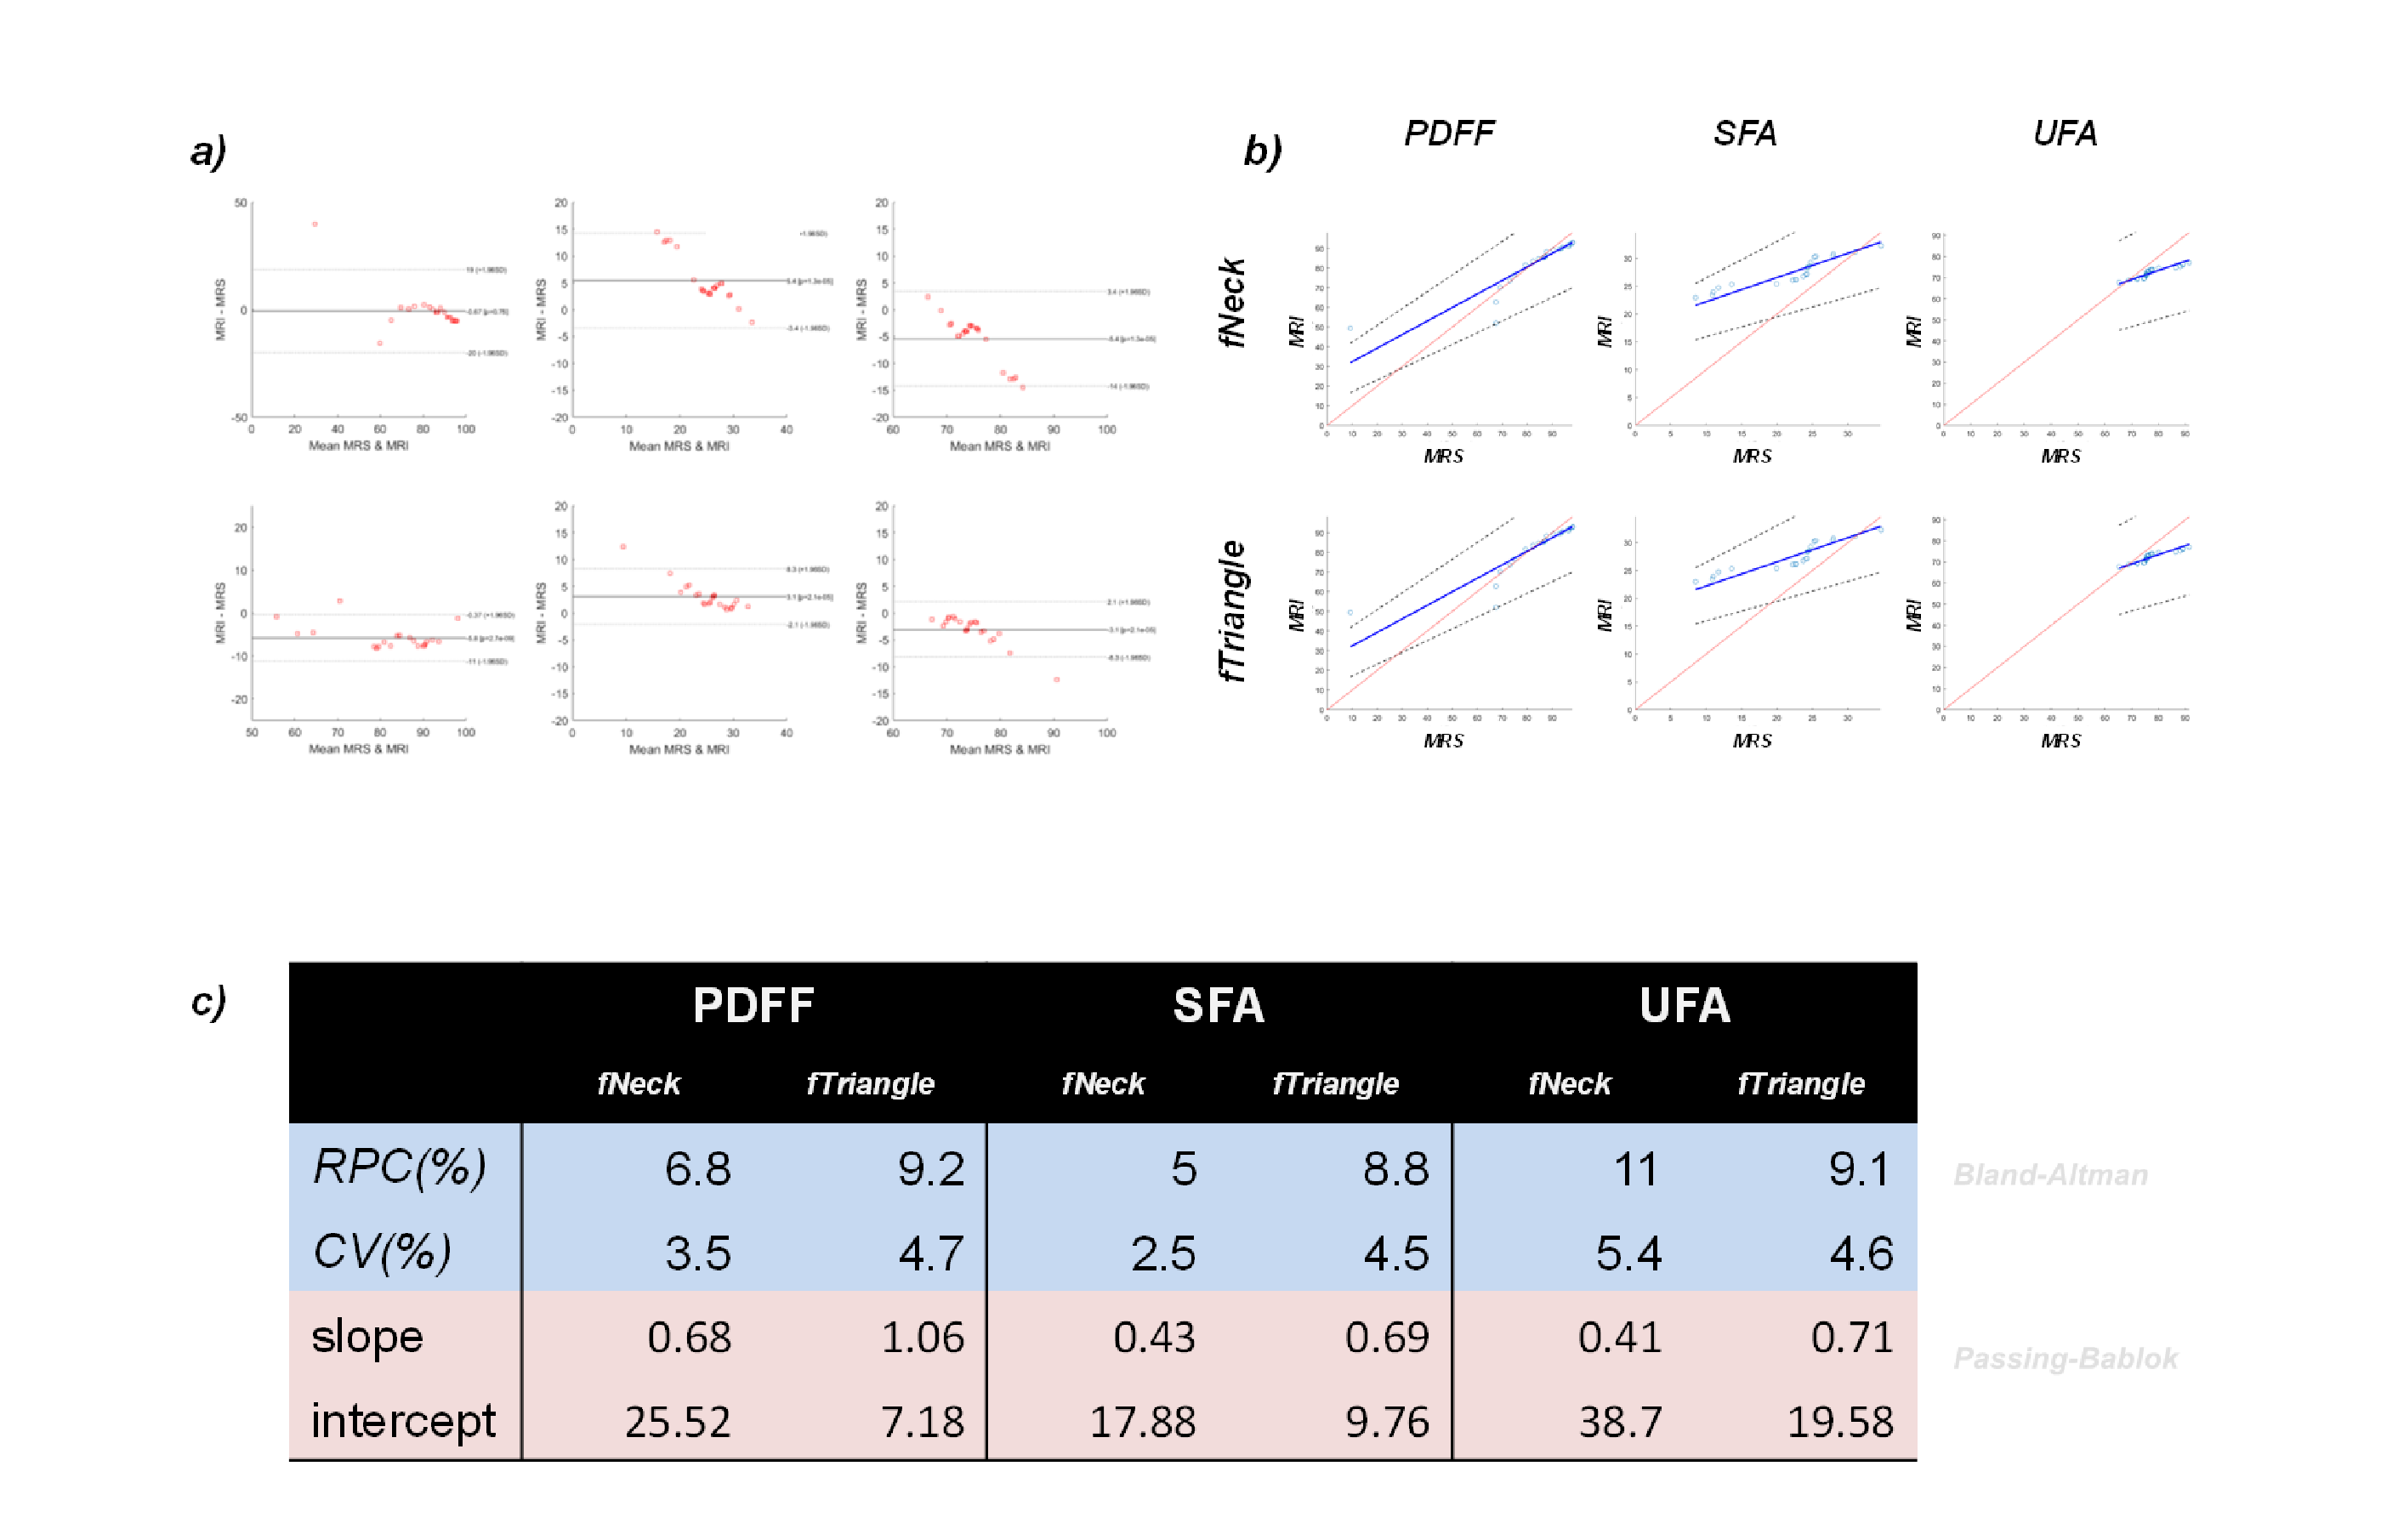
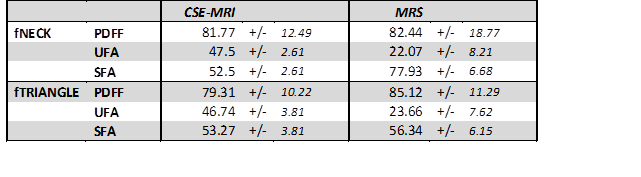
This study had institutional review board approval and written informed consent was obtained. MRI acquisitions were performed on n=22 subjects with osteoporosis (age: 51.94+/-12.68years, BMI: 23.02+/-4.43kg/m^2) using a 3T system (Siemens healthcare, Erlangen, Germany). We used a 3D spoiled gradient echo sequence with a n=12 echoes train length (n ×1.2ms) with flyblack readout gradient with following parameters: TR/FA/NA = 16ms/5°/4 and BW= 2000 Hz/px, 32 coronal slices were acquired. Native time-series magnitude and phase images were saved from the scanner and processed using homemade MATLAB script. We use method previously described6,7 to compute Proton Density Fat Fraction (PDFF) and fatty acid composition (i.e. saturated (SFA), monounsaturated (MUFA) and polyunsaturated (PUFA)) parametric maps. Briefly, reconstruction workflow is based on the B0-demodulation of magnitude time-series image using unwrapped phase image. Then a pixel-wise fitting procedure is performed using a parametric model with a multi-peak fat spectra as prior-knowledge. ROIs were drawn in the femoral neck (fNECK) and in Ward’s triangle (fTRIANGLE) and corresponding pixel were integrated. MRS acquisitions were performed using a non-water suppressed STEAM sequence with following parameters: TE/TR = 20/2000ms, NA = 24, BW=2000Hz in a 10x10x10mm^3 voxel. We used two voxels in this study positioned in the fNeck and in fTRIANGLE. Each average were saved separately and processed through homemade MATLAB routines for phase and frequency correction and quantification was performed using a QUEST-like method with prior-knowledge generated using FID-A8. PDFF, SFA and UFA were estimated using previously method described9. Comparison between MRI&MRS was performed using Bland-Altman10 and Passing-Bablok11 methodologies.Results
Typical reconstructed fat fraction maps and quantified spectra are shown respectively in Figure 1a and Figure 1b. Figure 2a shows Bland-Altman plots and reproducibility coefficients. Figure 2b shows Passing-Bablok regression plot. Average measurements in fNECK and fTRIANGLE are shown in Table 1. Reconstructed image are sufficient for co-localization of MRS voxels in fNECK and fTRIANGLE and acquired spectra are enough resolved to discriminate main fat resonances (Fig1b). For MRS-quantification, Cramer Rao lower bounds were computed and highest on amplitude were 23% for 2.8ppm resonance. From the average measurement, values found in term of PDFF, SFA and UFA were very similar between methods. MRS showed higher standard deviations compared to CSE-MRI (Tab1). Bland-Altman comparisons showed low variation and good agreement between CSE-MRI and MRS measurements (Fig2 c). Passing-Bablok comparisons showed a linear trend between measurements with acceptable confidence intervals for fat composition assessment.Conclusion
This study shows that there is good agreement and low variation between CSE-MRI and MRS measurements of bMAT quantity and composition (PDFF, SFA, and UFA) in subregions of the proximal femur. Some of the variation in measurements made between CSE-MRI and MRS may be attributed to voxel placement, co-localization error, or partial volume effect.Acknowledgements
No acknowledgement found.References
1. Yeung DK, Griffith JF, Antonio GE, Lee FK, Woo J, Leung PC. Osteoporosis is associated with increased marrow fat content and decreased marrow fat unsaturation: a proton MR spectroscopy study. J Magn Reson Imaging. 2005;22(2):279-285.
2. Griffith JF, Yeung DK, Antonio GE, et al. Vertebral bone mineral density, marrow perfusion, and fat content in healthy men and men with osteoporosis: dynamic contrast-enhanced MR imaging and MR spectroscopy. Radiology. 2005;236(3):945-951.
3. Gee CS, Nguyen JT, Marquez CJ, et al. Validation of bone marrow fat quantification in the presence of trabecular bone using MRI. J Magn Reson Imaging. 2015;42(2):539-544.
4. Bray TJP, Bainbridge A, Punwani S, Ioannou Y, Hall-Craggs MA. Simultaneous Quantification of Bone Edema/Adiposity and Structure in Inflamed Bone Using Chemical Shift-Encoded MRI in Spondyloarthritis. Magn Reson Med. 2017.
5. Peterson P, Mansson S. Simultaneous quantification of fat content and fatty acid composition using MR imaging. Magn Reson Med. 2013;69(3):688-697.
6. Leporq B, Lambert SA, Ronot M, Vilgrain V, Van Beers BE. Quantification of the triglyceride fatty acid composition with 3.0 T MRI. NMR Biomed. 2014;27(10):1211-1221.
7. Leporq B, Lambert SA, Ronot M, et al. Hepatic fat fraction and visceral adipose tissue fatty acid composition in mice: Quantification with 7.0T MRI. Magn Reson Med. 2016;76(2):510-518.
8. Simpson R, Devenyi GA, Jezzard P, Hennessy TJ, Near J. Advanced processing and simulation of MRS data using the FID appliance (FID-A)-An open source, MATLAB-based toolkit. Magn Reson Med. 2017;77(1):23-33.
9. Bydder M, Girard O, Hamilton G. Mapping the double bonds in triglycerides. Magn Reson Imaging. 2011;29(8):1041-1046.
10. Martin Bland J, Altman D. Statistical Methods For Assessing Agreement Between Two Methods Of Clinical Measurement. The Lancet. 1986;327(8476):307-310.
11.Passing H, Bablok. A new biometrical procedure for testing the equality of measurements from two different analytical methods. Application of linear regression procedures for method comparison studies in clinical chemistry, Part I. J Clin Chem Clin Biochem. 1983;21(11):709-720.
Figures