0331
Clinical Feasibility of Isotropic MAVRIC SL Imaging of Total Joint Arthroplasties1Hospital for Special Surgery, New York, NY, United States, 2General Electric Healthcare, Waukesha, WI, United States
Synopsis
Multi-spectral MRI reduces susceptibility when imaging near total joint arthroplasty (TJA). MAVRIC SL acquires 24 bins of off-resonance data to generate images, but most implants require fewer bins. This study uses a calibration scan, to determine an adequate number of bins, coupled with long echo trains and variable flip angles to permit an isotropic MAVRIC SL acquisition in clinically feasible scan times. The isotropic MAVRIC SL acquisition showed an improved detection of the implant-bone interface surrounding TJA, while retaining image contrast and overall SNR. An isotropic acquisition may improve the diagnostic capability of MAVRIC SL images.
Introduction
The inadequacy of conventional MR pulse sequences near total joint arthroplasty (TJA) has been overcome using 3D Multi Spectral Imaging (3D-MSI) sequences such as MAVRIC SL [1] and SEMAC [2]. MAVRIC SL samples the broadened frequency distribution by acquiring multiple spectral-bins at frequency offset from the Larmor frequency. These bins are then combined to yield an artifact minimized image. Currently, MAVRIC SL acquires 24 spectral bins (±12 kHz) to overcome the most severe susceptibility of stainless steel (~3000 ppm [1]). However, for implants that are smaller or have a weaker susceptibility, an acquisition of 24 bins is excessive and can also lead to visible ghosting. The number of bins needed for adequate spectral coverage of an implant may be achieved by using a short spectral calibration scan [3]. A reduced bin acquisition and the associated savings of scan time affords the ability to acquire an isotropic acquisition of similar coverage. In this study, we tested the feasibility of acquiring isotropic MAVRIC SL images in a clinically viable scan time and further studied the clinical value added by the acquisition.Methods
This study was IRB approved with informed written consent. 6 TJA patients were enrolled: 4M/2F, 69 ± 12y.o., 4 total hip arthroplasties (THA)/2 total knee arthroplasties (TKA). Imaging was performed using a clinical 1.5T MR450W scanner (GE Healthcare, Waukesha, WI) with an 8 channel receive only cardiac coil or an 8 channel T/R phased array knee coil (Invivo, Gainesville, FL). A spectral calibration scan was initially run to determine the number of spectral bins needed [3] (Matrix: 128x32x24, TE/TR: 7.2ms/1.4s, slice thickness: 6mm, FOV: 36-40 cm, ETL: 16, scan time: ~35s). A coronal 3D MAVRIC SL (MVSL) (1) series was acquired for each THA (TE/TR: 7.2ms/4s, BW:±125kHz, FOV: 36-40cm, Matrix:512x256, Slice Thickness: 3.5mm, ETL:24) and TKA (TE: 9ms, TR: 5s, BW: ±125kHz, FOV: 22-26cm, Matrix:512x256, Slice Thickness: 3mm3, ETL:24), in addition to an isotropic MAVRIC (MVISO) series (THA: TE: 6.3, TR:2-4s, Matrix:288x288, voxel size: 1.3mm3, ETL:48, TKA: TE: 6.3, TR:3.5-4s, Matrix:192x192, voxel size: 1.3mm3, ETL:48).
MVSL and MVISO images were compared side-by-side and evaluated qualitatively for lesion conspicuity, tissue contrast, signal-to-noise ratio, blurring, and artifact pile-up, using the ordinal scale of: 0 – MVSL much better than MVISO, 1– MVSL better than MVISO, 2– MVSL similar to MVISO, 3– MVISO better than MVSL, 4– MVISO much better than MVSL. In addition, the maximal fibrous membrane thickness at the bone-implant interface and/or volume of osteolysis was measured when present. Image evaluation was performed by a board certified radiologist. Frequency tables were created to assess distribution of ordinal variables, and a Sign test was performed to assess display preference of either the MVSL or MVISO series (SAS V9.3, Cary, NC). Differences of fibrous membrane thickness and osteolysis were evaluated between MVSL and MVISO, when present. Significance was set at p<0.05.
Results
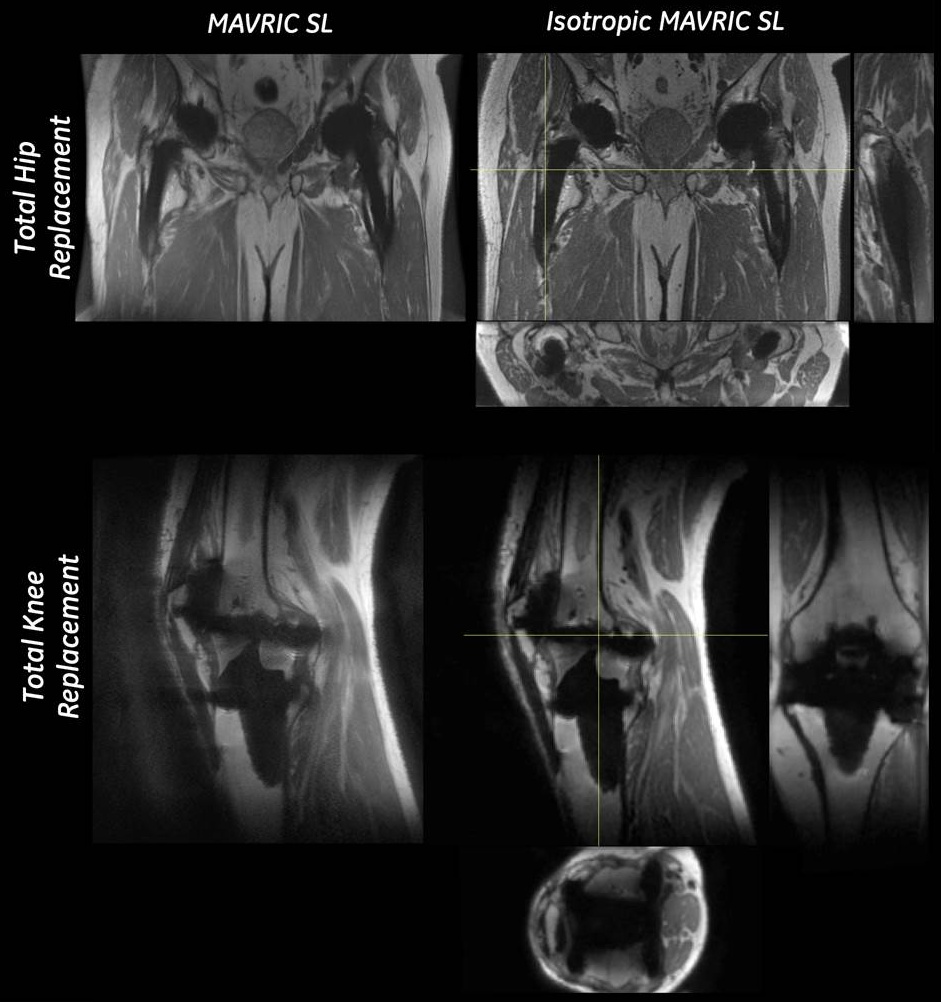
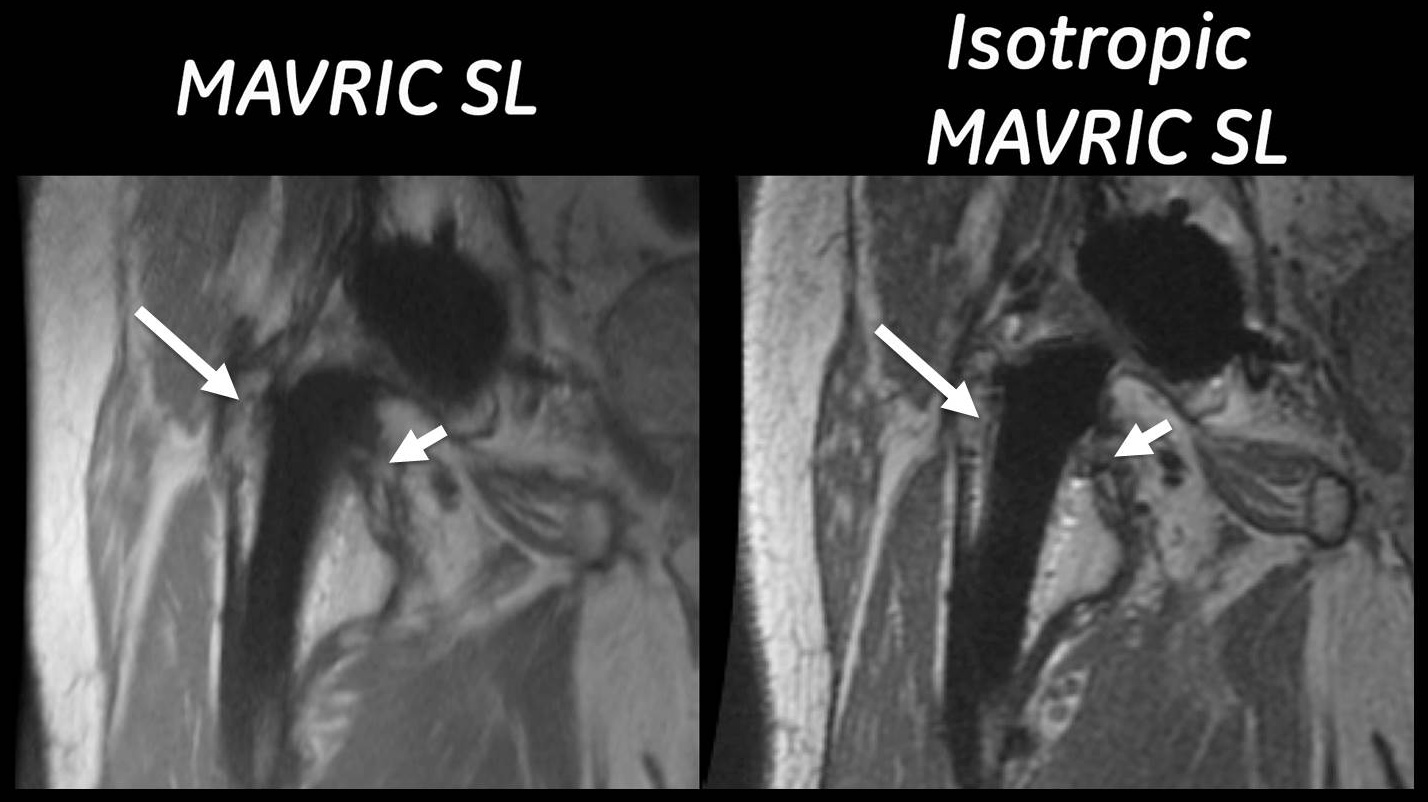
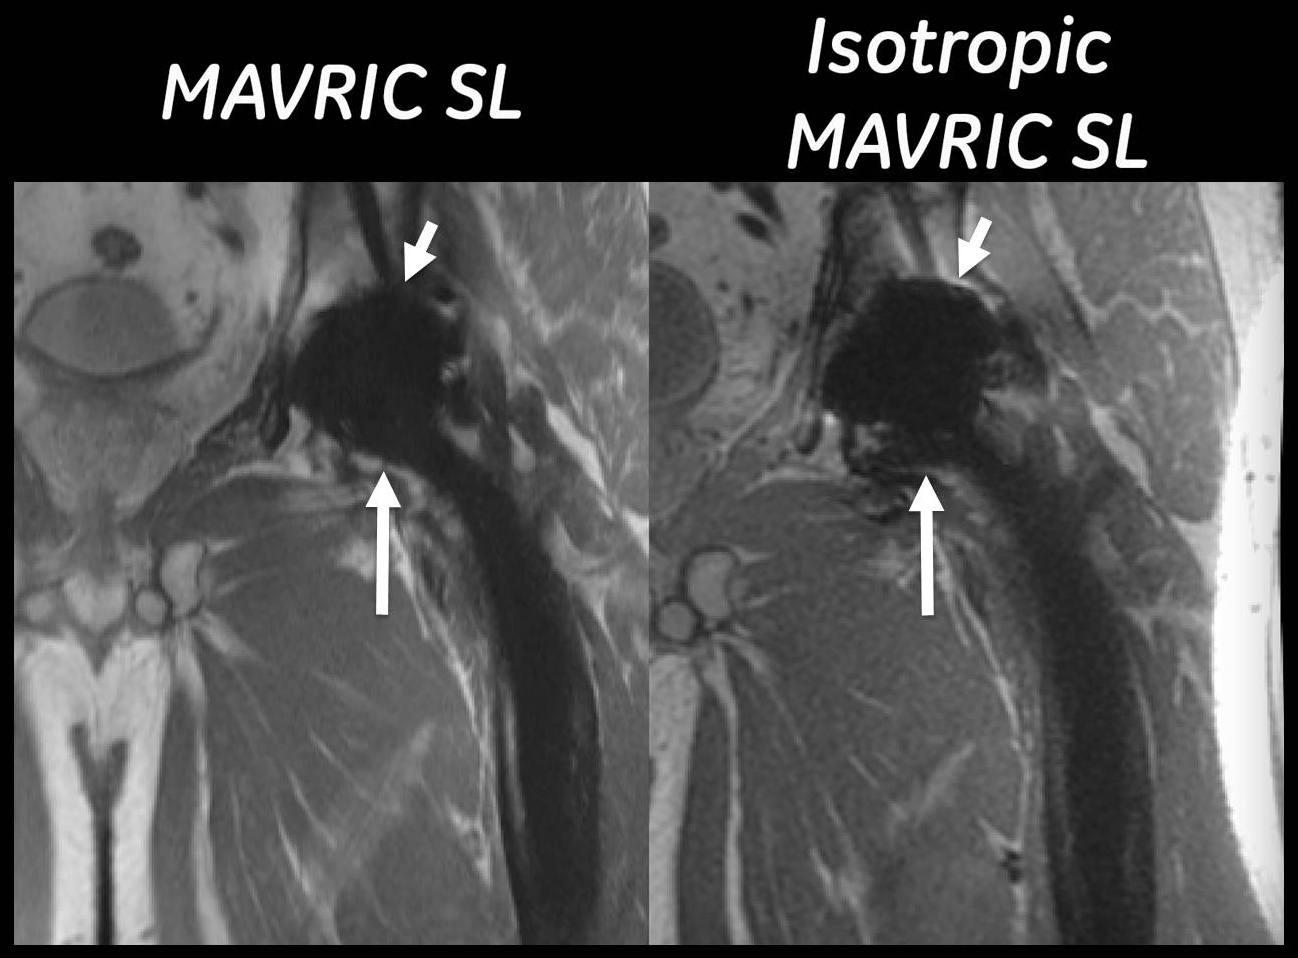
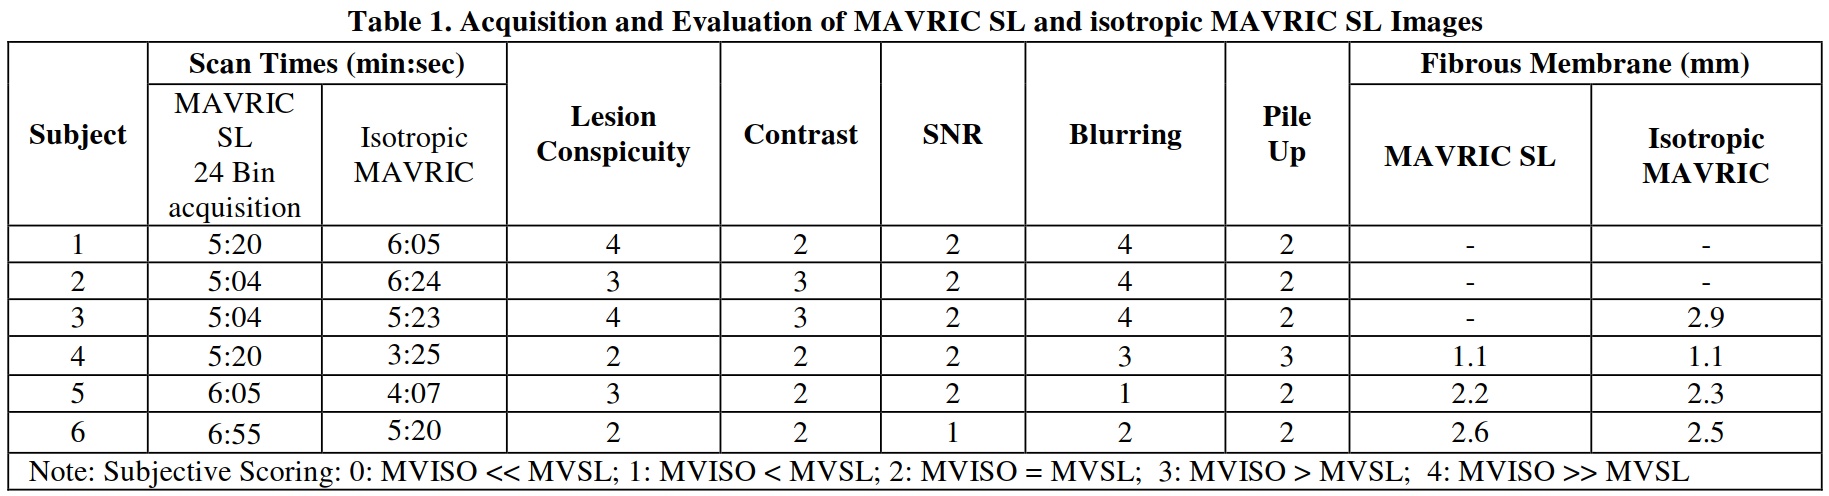
The use of a spectral calibration scan enabled MVISO imaging with scan times similar to the product sequence (Table 1). Representative MVSL and MVISO images of a THA and TKA shown in Figure 1, with the region of fibrous membrane formation visible only in the MVISO dataset indicated (Fig. 2). An example of metallic debris in the soft tissue near a THA is shown clearly in a MVISO image as compared to MVSL (Fig. 3). MVISO images tended to have less blurring than MVSL (Score>2 for 4/6 exams, Table 1) and also tended to have similar or better tissue contrast than MVSL images (All exams had Score ≥ 2). The pile-up artifacts present were similar for both scans (Score=2 for 5/6 scans), as was the overall image SNR (Score=2 for 5/6 exams). These trends were not significant. A fibrous membrane was found in 4 subjects in MVISO images but only in 3 subjects in the corresponding MVSL images. The thickness differences between MVSL and MVISO images were ~0.1mm. Osteolysis was detected in 1 subject, with the MVISO images showing a 0.69 cm3 larger volume than the MVSL images.Discussion and Conclusions
This pilot cohort study found that isotropic MAVRIC SL images displayed clinically relevant features that were obscured in product MAVRIC SL images. The detection and extent of osteolysis or fibrous membrane formation can be improved with thinner slices. Future studies will utilize a MVSIO acquisition in conjunction a calibration scan to benefit visualization of soft tissues near orthopaedic hardware, including spinal instrumentation.Acknowledgements
HSS has an institutional research agreement in place with GE Healthcare.References
1. Koch KM, et al. Magn Reson Med. 2011 Jan;65(1):71-82. 2. Lu W, et al. Magn Reson Med. 2009 Jul;62(1):66-76. 3. Kaushik SS, et al. Magn Reson Med. 2016 Nov;76(5):1494-1503Figures