0329
Relationship of paraspinal muscle DTI metrics to isometric strength measurements1Department of Diagnostic and Interventional Neuroradiology, Klinikum rechts der Isar, Technische Universität München, München, Germany, 2Department of Diagnostic and Interventional Radiology, Klinikum rechts der Isar, Technische Universität München, München, Germany, 3Department of Sport and Health Sciences, Technische Universität München, München, Germany
Synopsis
Diffusion Tensor Imaging (DTI) enables the microstructural examination of muscle tissue as well as its pathological and stress-dependent changes. Little is known about the associations between muscular DTI parameters and corresponding muscle strength measurements. The present study investigated the correlations of DTI parameters of paraspinal muscles with isometric strength measurements in healthy subjects. The results indicate that DTI may potentially track slight changes of back muscle tissue microstructure that relate to muscle strength and may be useful in the early diagnosis of back muscle diseases and back pain.
Purpose
Diffusion Tensor Imaging (DTI) is an MRI method enabling the microstructural examination of biological tissues by quantifying diffusion of water molecules and its directional anisotropy 1-3. The DTI-derived parameters (eigenvalues (λ1, λ2, λ3), mean diffusivity (MD), radial diffusivity (RD) and fractional anisotropy (FA)) are sensitive to changes in microstructures, so pathological and stress-dependent changes in tissue composition can be identified. In recent years, the muscular tissue architecture has been started to be characterized by DTI 4-7. Very little is known about the associations between muscular DTI parameters and muscle strength 8-12; in particular there are no studies that have examined such relations in paraspinal muscles. Purpose of this work is to investigate the associations of DTI parameters of the paraspinal muscles with isometric strength measurements in healthy volunteers.Methods
Subjects: 21 healthy subjects (12 male, 9 female; age = 30.1±5.6 years; BMI = 27.5±2.6 kg/m2) were recruited for this study.
MR Imaging: Lumbar musculature was scanned on a 3T Philips scanner using the built-in 12-channel posterior coil. DTI in 24 directions was performed using a reduced-FOV single-shot echo planar imaging (ss-EPI) sequence employing a combination of non-coplanar excitation and refocusing pulses combined with outer volume suppression13 to minimize motion and susceptibility effects from the abdominal organs. To reduce chemical-shift artifacts and minimize the effect of fat in the muscle-DTI metrics, the following fat suppression techniques were combined: Suppression of the main aliphatic fat peak was performed using spectrally adiabatic inversion recovery (SPAIR) with inversion time=220ms and frequency offset=150Hz in conjunction with slice-selection gradient reversal (SSGR). Suppression of the olefinic fat peak was performed using a 18ms spectrally selective Gaussian-windowed sinc pulse14 with frequency offset=200Hz. Other sequence parameters: FOV=220×147×80mm3; acquisition voxel=3×3mm2; slice thickness=8mm; TR/TE=2457/65 ms; partial-Fourier reduction factor=0.75; b-values=0,400 with 2 and 3 averages, respectively; scan duration=6m8s. A small FOV in the feet-head direction was selected to minimize B0 inhomogeneity effects on the performance of the olefinic fat peak suppression pulse.
Manual Segmentation: Manual segmentation of the paraspinal muscles was performed on the iso-DW images with the open-source software MITK. Psoas and erector spinae muscle (right and left) were segmented separately. ROIs were drawn manually in the interior of these muscles avoiding vessels and surrounding fat tissue. First and last slice were excluded from analyses due to increased B0 inhomogeneity effects resulting in eight analyzable slices. Eigenvalues, FA, MD and RD were calculated from DTI15 in each muscle separately. Mean values of left and right side were averaged.
Isometric strength measurement: Muscle flexion and extension maximum isometric torque [Nm] at the back was measured with a rotational dynamometer (Isomed 2000). Measurements of absolute flexion and extension muscle strength were adjusted for BMI to obtain relative values. Furthermore, the ratio between relative extension and flexion muscle strength (extension / flexion) was assessed. Correlations between DTI values and strength measurements were calculated.
Results
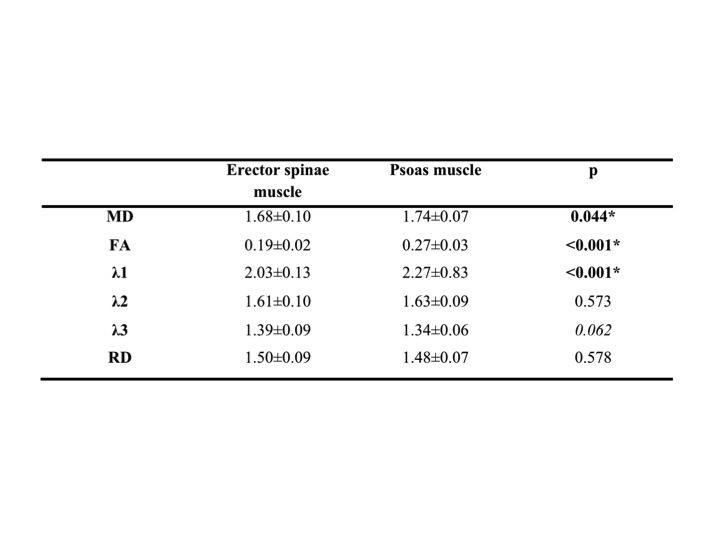
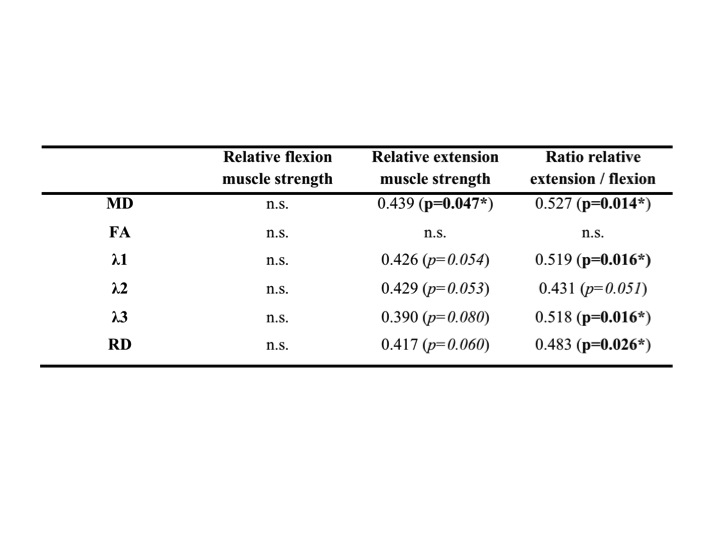
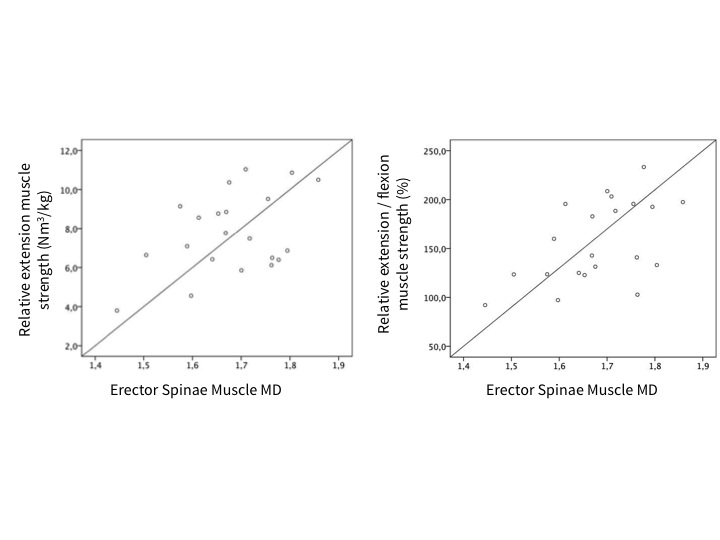
Males had higher relative muscle strength than females for flexion (6.10±1.24 Nm³/kg versus 3.92±0.74 Nm³/kg; p<0.001) and a tendency for higher relative muscle strength for extension (8.45±2.09 Nm³/kg versus 6.85±1.64 Nm³/kg; p=0.065). The DTI values of the paraspinal and psoas muscle are shown in Figure 1. Significantly higher values for MD, FA and λ1 were found in the psoas muscle. No significant sex differences were found for DTI values; furthermore no significant correlations with BMI. Pearson correlation coefficients r for DTI values of the erector spinae muscle versus strength measurements are shown in Figure 2. MD correlated significantly with relative extension muscle strength (r = 0.439) and the ratio of extension to flexion strength (r = 0.527; Fig.3); λ1, λ3 and RD showed significant correlations with the ratio of extension to flexion strength and statistical trends (p<0.1) when correlated with relative extension muscle strength. No significant correlations were found for the psoas muscle. See Fig.4 for representative MD- and RD-maps.Discussion and Conclusion
Relationships between muscle DTI metrics and strength measurements has been previously reported only in the lower extremities 10. The present work shows, to the best of our knowledge, for the first time associations between DTI diffusivity parameters and eigenvalues of the erector spinae muscle and isometric strength measurements in healthy subjects. Therefore, DTI enables not only the characterization of back muscle fiber architecture but also the probing of muscle microstructure differences, which are related to back muscle function. DTI may thus potentially track slight changes of back muscle tissue composition that relate to muscle strength and may be useful in the early diagnosis of back muscle diseases and back pain.Acknowledgements
The present work was supported by the European Research Council (grant agreement No 637164 – iBack), TUM Faculty of Medicine (KKF grant H01) and Philips Healthcare.References
1. Le Bihan D, Breton E, Lallemand D, Grenier P, Cabanis E, Laval-Jeantet M. MR imaging of intravoxel incoherent motions: application to diffusion and perfusion in neurologic disorders. Radiology. 1986;161:401-407.
2. Pierpaoli C, Basser PJ. Toward a quantitative assessment of diffusion anisotropy. Magnetic resonance in medicine. 1996;36:893-906.
3. Van Donkelaar CC, Kretzers LJ, Bovendeerd PH, et al. Diffusion tensor imaging in biomechanical studies of skeletal muscle function. Journal of anatomy. 1999;194 ( Pt 1):79-88.
4. Zaraiskaya T, Kumbhare D, Noseworthy MD. Diffusion tensor imaging in evaluation of human skeletal muscle injury. Journal of magnetic resonance imaging : JMRI. 2006;24:402-408.
5. Heemskerk AM, Strijkers GJ, Vilanova A, Drost MR, Nicolay K. Determination of mouse skeletal muscle architecture using three-dimensional diffusion tensor imaging. Magnetic resonance in medicine. 2005;53:1333-1340.
6. Oudeman J, Nederveen AJ, Strijkers GJ, Maas M, Luijten PR, Froeling M. Techniques and applications of skeletal muscle diffusion tensor imaging: A review. Journal of magnetic resonance imaging : JMRI. 2016;43:773-788.
7. Damon BM, Froeling M, Buck AK, et al. Skeletal muscle diffusion tensor-MRI fiber tracking: rationale, data acquisition and analysis methods, applications and future directions. NMR in biomedicine. 2017;30.
8. Okamoto Y, Mori S, Kujiraoka Y, Nasu K, Hirano Y, Minami M. Diffusion property differences of the lower leg musculature between athletes and non-athletes using 1.5T MRI. Magma. 2012;25:277-284.
9. Deux JF, Malzy P, Paragios N, et al. Assessment of calf muscle contraction by diffusion tensor imaging. European radiology. 2008;18:2303-2310.
10. Scheel M, Prokscha T, von Roth P, et al. Diffusion tensor imaging of skeletal muscle--correlation of fractional anisotropy to muscle power. Rofo. 2013;185:857-861.
11. Froeling M, Oudeman J, Strijkers GJ, et al. Muscle changes detected with diffusion-tensor imaging after long-distance running. Radiology. 2015;274:548-562.
12. Schwenzer NF, Steidle G, Martirosian P, et al. Diffusion tensor imaging of the human calf muscle: distinct changes in fractional anisotropy and mean diffusion due to passive muscle shortening and stretching. NMR in biomedicine. 2009;22:1047-1053.
13. Wilm BJ, Gamper U, Henning A, Pruessmann KP, Kollias SS, Boesiger P. Diffusion-weighted imaging of the entire spinal cord. NMR Biomed. 2009;22:174-181.
14. Williams SE, Heemskerk AM, Welch EB, Li K, Damon BM, Park JH. Quantitative effects of inclusion of fat on muscle diffusion tensor MRI measurements. Journal of magnetic resonance imaging : JMRI. 2013;38:1292-1297.
15. Le Bihan D, Mangin JF, Poupon C, et al. Diffusion tensor imaging: concepts and applications. Journal of magnetic resonance imaging : JMRI. 2001;13:534-546.
Figures