0328
Time-dependent diffusion and the random permeable barrier model predict muscles fiber dimensions in Duchenne muscular dystrophy mice1Radiology, Leiden University Medical Center, Leiden, Netherlands, 2Human Genetics, Leiden University Medical Center, Leiden, Netherlands, 3Radiology, New York University School of Medicine, New York, NY, United States
Synopsis
We used time-dependent diffusion, with diffusion times up to 500ms to assess the muscle tissue microstructure in two different mouse models of Duchenne muscular dystrophy (DMD). We found significant differences in diffusivities between DMD models and the genetic background matched wild types in diffusion times up to 100ms. We modeled diffusion time-dependence with the random permeable barrier model (RPBM), which yielded surface-to-volume ratios indicative of fiber size and compared these values to gold-standard histology of the same muscles. The RPBM predicted relative differences in fiber dimensions between mdx and wild type within each genetic background.
Introduction
Duchenne muscular dystrophy (DMD) is a severe muscle wasting disease resulting in death between the 2nd and 3rd decade of life and is characterized by de- and regeneration of muscle fibers. One of the main features of this muscle remodeling is a shift to smaller muscle fibers(1), which in theory could be probed by diffusion MRI. In DMD mouse models, interestingly, some studies were able to find differences in diffusivities (2), while others were not(3–5). The random permeable barrier model (RPBM) introduces a novel tissue microstructure disorder class consisting of randomly placed and oriented extended permeable membranes, mimicking tightly-packed myofibers in the cross-section, shown in figure 1. It is characterized by three parameters: free diffusion coefficient D0, membrane permeability κ and membrane surface-to-volume ratio S/V (6,7). The aim of this study was to assess the RPBM using stimulated echo diffusion tensor imaging in DMD mouse models.Method
Sixteen-week-old male DMD mice with two different genetic backgrounds (C57BL/10ScSnJ and DBA2/J) and corresponding wild-types (WT), consisting of n=18 mdx-BL10, n=22 WT-BL10, n=20 mdx-DBA and n=18 WT-DBA mice, were studied using a Bruker 7T PharmaScan and a 23mm resonator. The DBA2/J background resulted in smaller muscle fibers and increased muscle fibrosis in mdx-DBA mice compared to both the genetically-matched wild-type (WT-DBA) and mdx-BL10 mice, due to Anxa6 and Ltbp4 gene variants involved in regeneration and fibrosis.
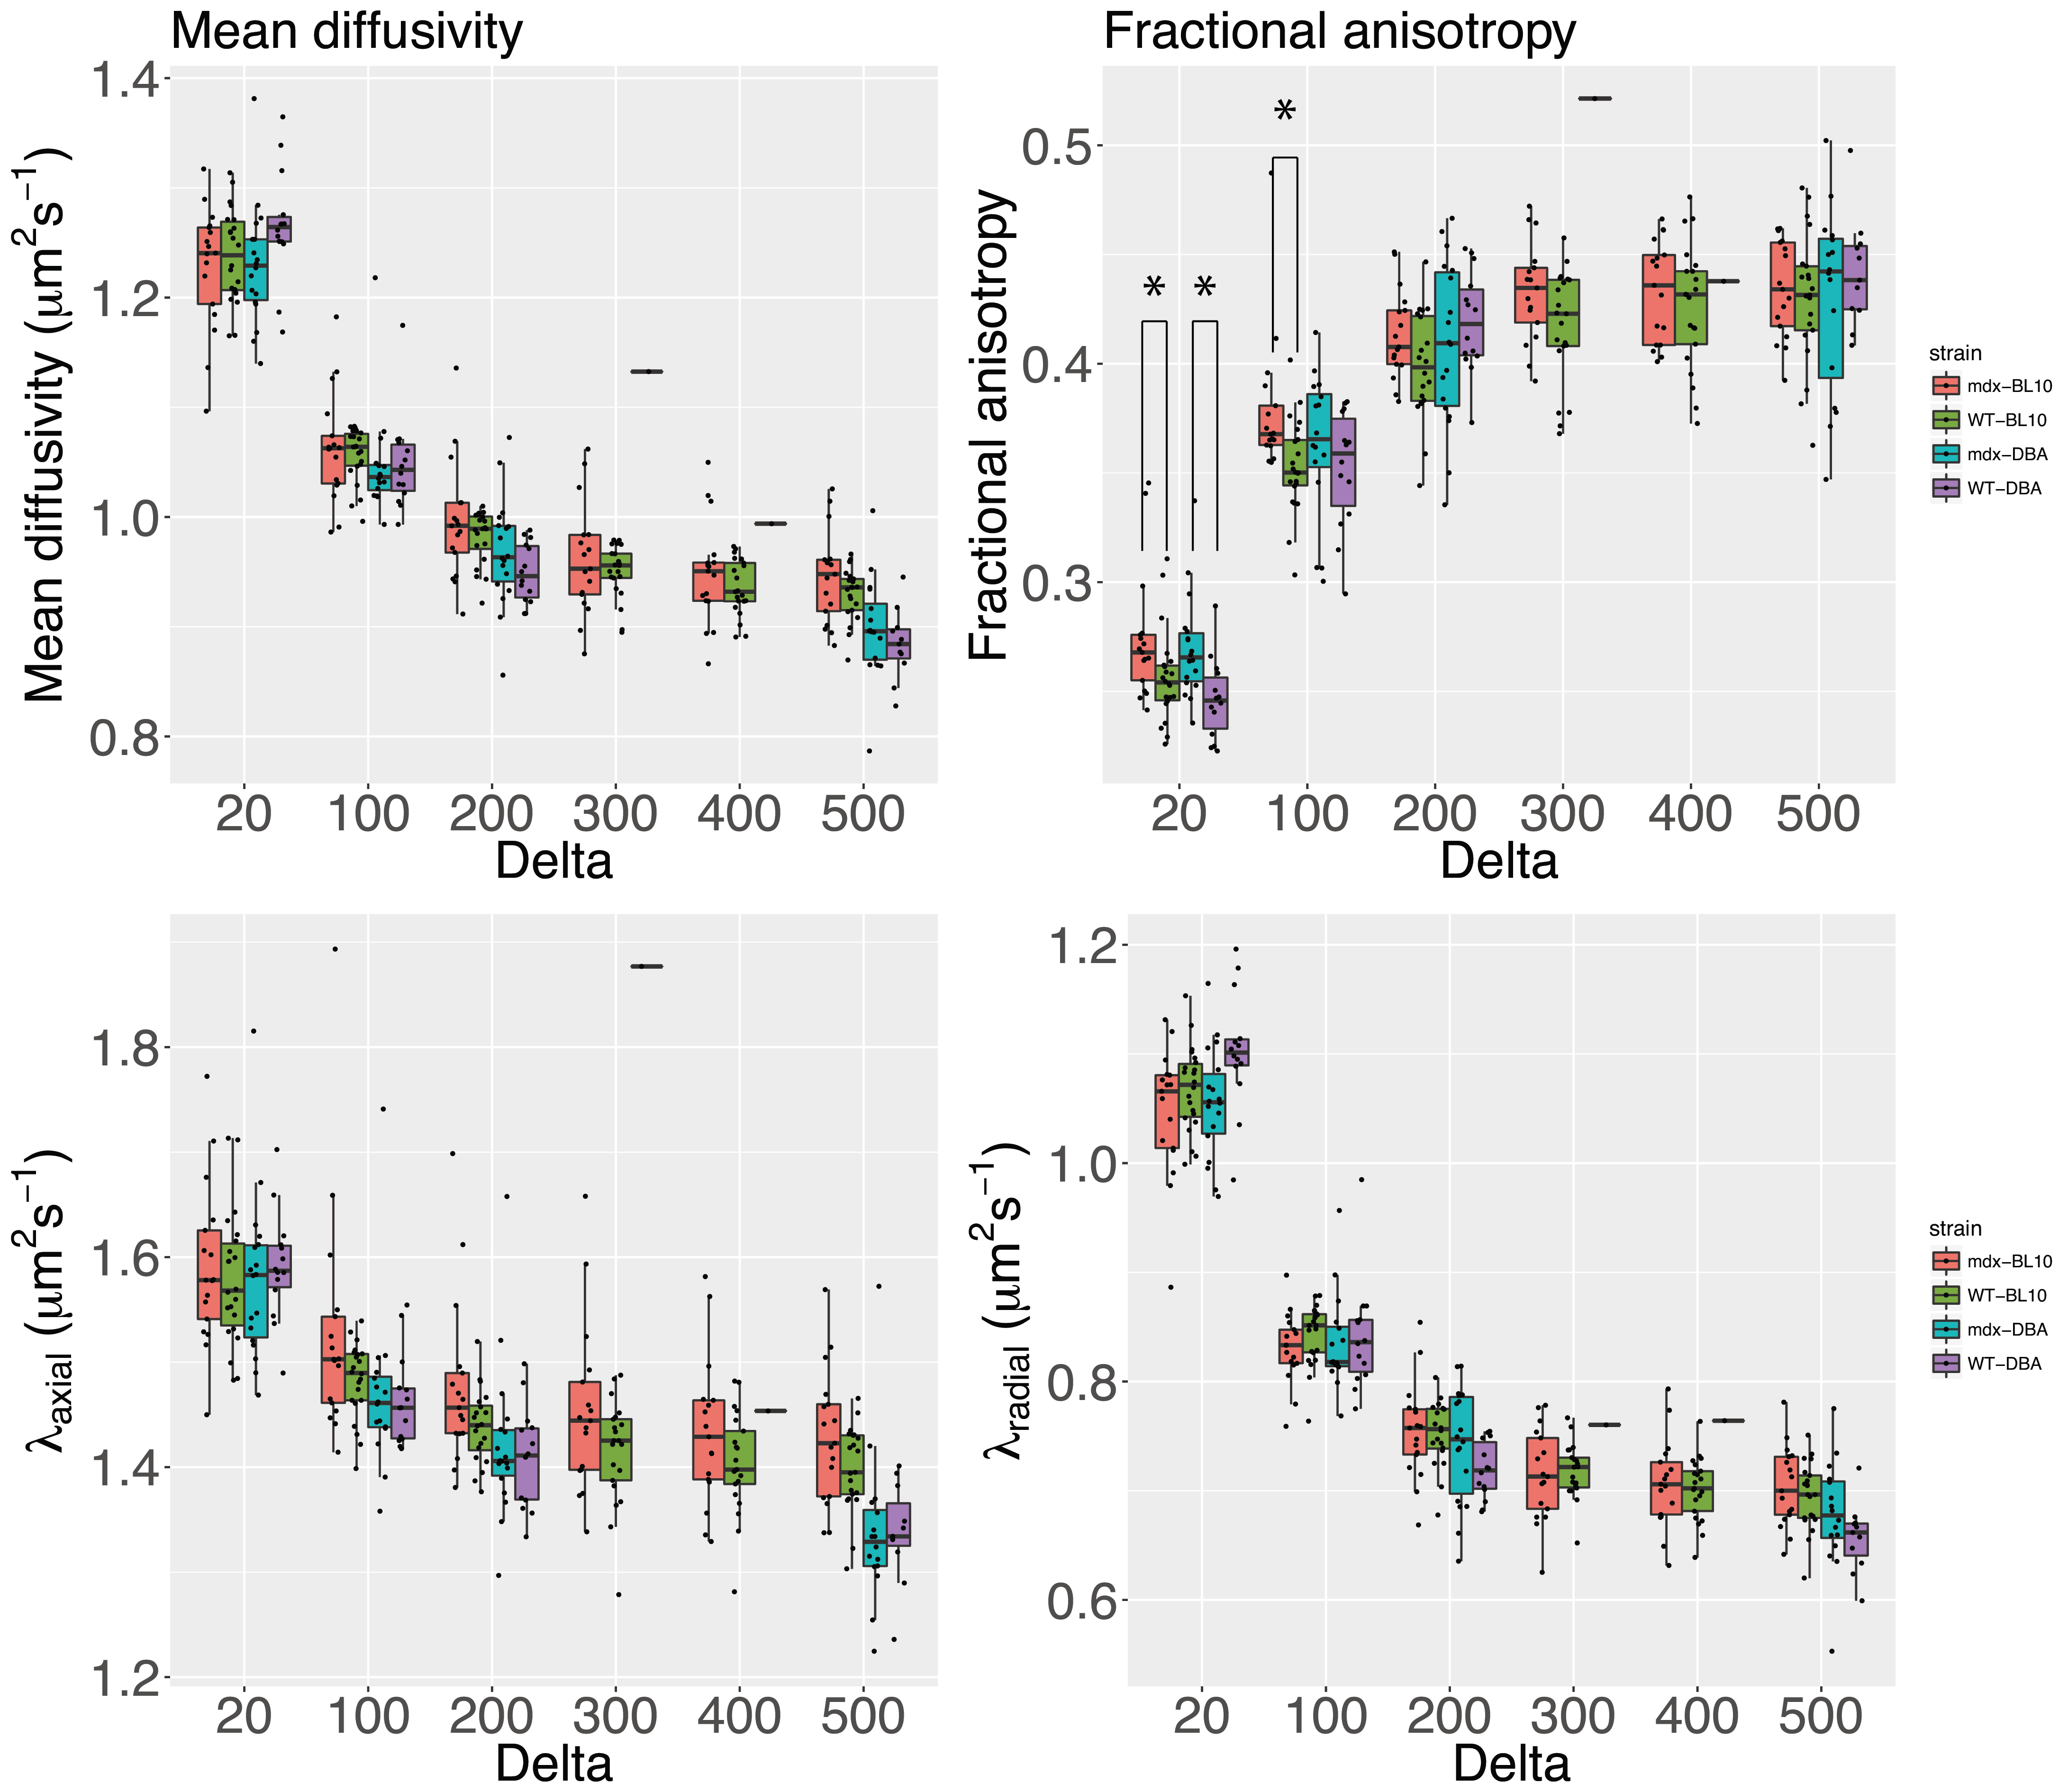
A stimulated echo diffusion sequence with EPI readout was used. For all mdx-BL10 and WT-BL10 mice and two mdx-DBA mice, diffusion times were Δ=[20 100 200 300 400 500]ms and for all other mdx-DBA and WT-DBA mice, diffusion times were Δ=[20 100 200 500]ms. FOV was 20x10x1mm; NA=8; matrix=128x64; 2-segmented EPI; Partial Fourier=1.5. Diffusion tensors were calculated from two unweighted and b=300s/mm2 weighted images in 8 directions (effective b-values ranged from 321 to 573 s/mm2). The axial and radial (λ⊥=(λ2+λ3)/2) diffusivities were averaged across the gastrocnemius muscle (figure 2) and modeled with the RPBM.
Mice were sacrificed the day after MRI and the gastrocnemius muscle was snap-frozen using cooled 2-methylbutane. Sections (8 µm) were stained for laminin and myofibers were segmented into individual objects with the BZ-X Analyzer (Keyence) and their perimeter-to-area ratio was calculated and averaged per mouse. 17 mdx-BL10, 21 WT-BL10, 10 mdx-DBA and 1 WT-DBA mice have been histologically processed so far.
Results
Diffusivity [MD,λ1-3] decreased, while fractional anisotropy (FA) increased, with increasing Δ for all mouse strains. At Δ=20ms FA was different between mdx mice and their genetic matched wild type controls, at Δ=20 λ3 was different in mdx-DBA mice and at Δ=100 FA was different in mdx-BL10 mice compared to their controls (Figure 3).
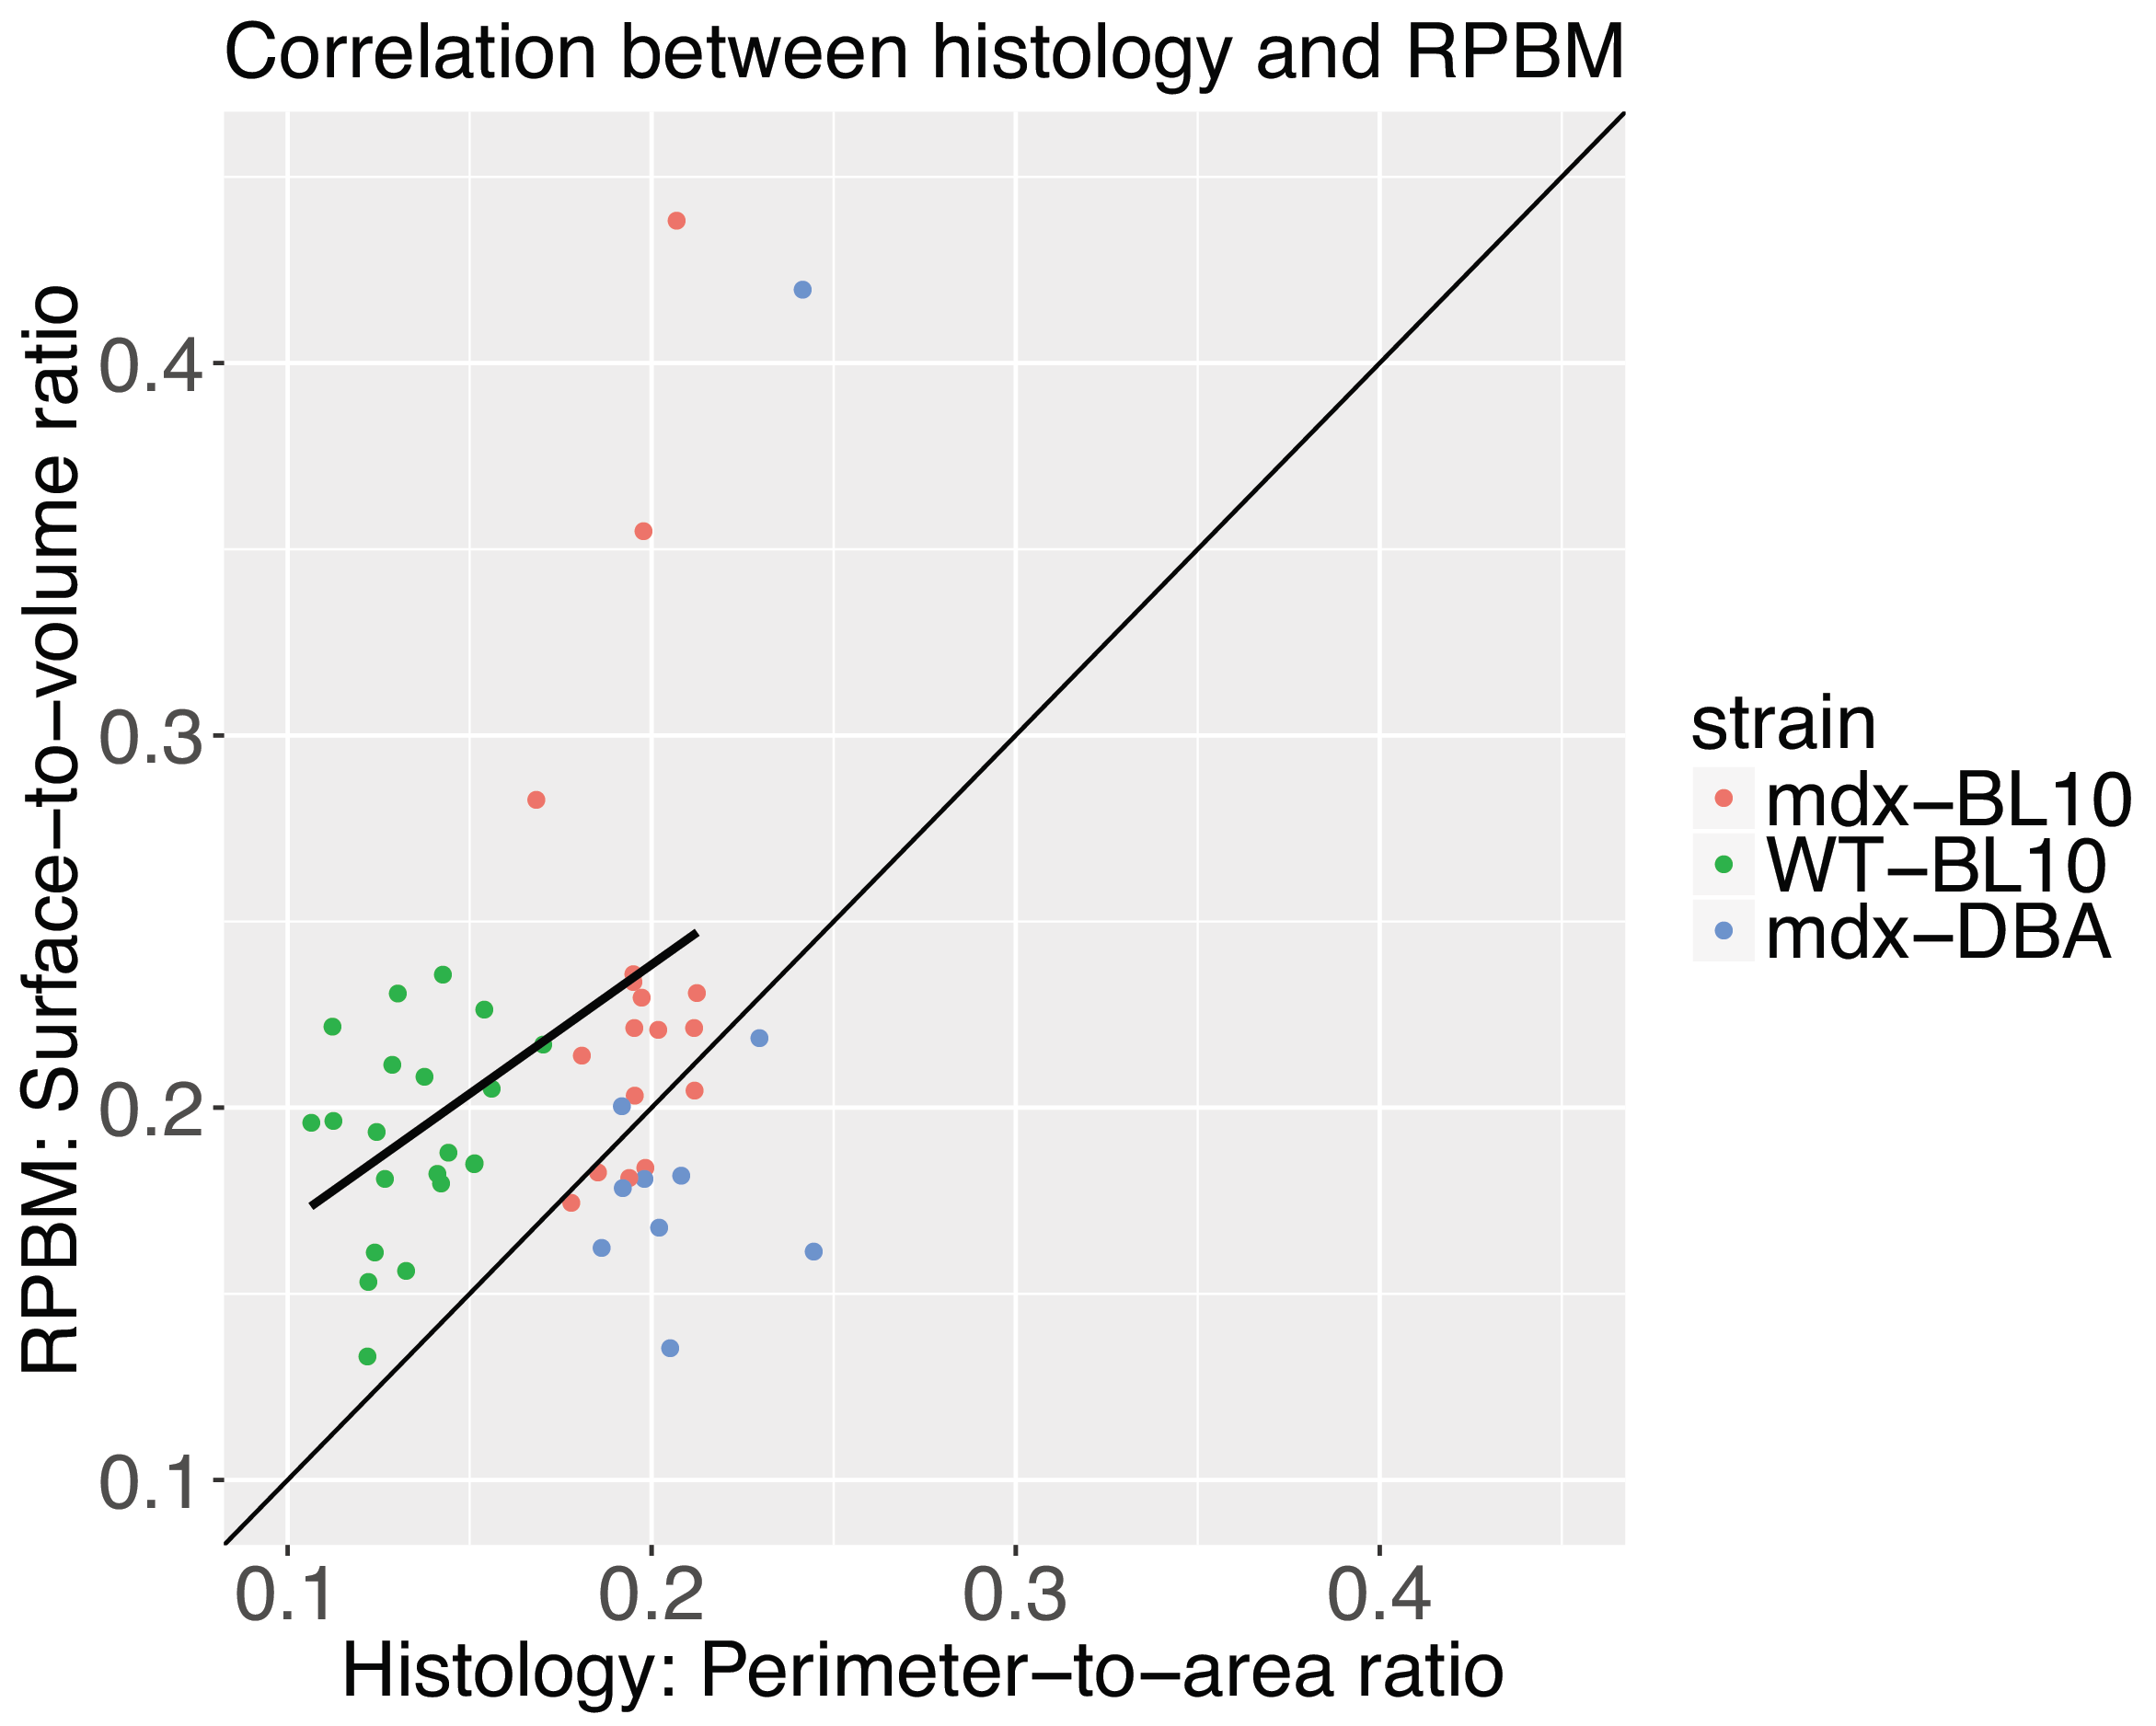
The histologically assessed perimeter-to-area ratio was significantly increased in mdx-BL10 compared to WT-BL10 mice (19.49+1.21% vs 13.51+1.60%; P<0.001), as was the corresponding RPBM surface-to-volume ratio (23.61+6.75% vs 19.27+2.71%; P=0.02), see figure 4. Also in mdx-DBA mice, the surface-to-volume ratio was significantly increased compared to WT-DBA mice (20.50+6.64% vs 16.13+2.60%, P=0.03). Correlation plots (figure 5) show a high correspondence between histology and the RPBM model for the BL10 background (r=0.44, P<0.01). For DBA mice, the correlation is less, due to the fact that wild-type histology still needs to be added; therefore the dynamic range of fiber sizes in the DBA data is at the moment too small.
Discussion
The most different DTI measure was FA, able at short diffusion times to differentiate between mdx and wild type mice. By increasing diffusion time, the ability to measure restriction increases; it is likely that in mdx mice the restricted effects of smaller muscle fibers on diffusivities is counteracted by the increased permeability of the muscle cells.
The RPBM surface-to-volume ratio differentiated between mdx and wild type mice in each genetic background. From the data, it is clear that strain-dependent effects are present beyond differences in fiber size. The mdx-DBA model is characterized by increased muscle fibrosis(8) and the RPBM reflects both the intracellular and extracellular space as single unit and this oversimplification might have biased the surface-to-volume ratio in this mouse model. Secondly, the membrane permeability may be different for each genetic background. We are currently performing histology for membrane leakage in these models (Evans Blue infiltration), after which we can also evaluate the RPBM model for permeability.
Conclusion
Diffusion tensor imaging was used in DMD mouse models with diffusion times up to Δ=500ms. The RPBM within the BL10 strain showed a good correlation with histologically determined fiber size and was able to predict relative differences in fiber dimensions between mdx and wild type mice within each genetic background.Acknowledgements
This work was supported by the European Union NMD-Bioimage project. Seventh Framework Programme (FP7/2007-2013) under grant agreement 602485 Bioimage-NMD project.References
1. Briguet A, Courdier-Fruh I, Foster M, Meier T, Magyar JP. Histological parameters for the quantitative assessment of muscular dystrophy in the mdx-mouse. Neuromuscul Disord. 2004;14:675–82. 2. Vohra R, Batra A, Forbes SC, Vandenborne K, Walter GA. Magnetic Resonance Monitoring of Disease Progression in mdx Mice on Different Genetic Backgrounds. Am J Pathol. Elsevier; 2017 Sep;187(9):2060–70.
3. Wu JS, Li J, Greenman RL, Bennett D, Geisbush T, Rutkove SB. Assessment OF aged mdx mice by electrical impedance myography and magnetic resonance imaging. Muscle and Nerve. 2015;52(4):598–604. 4. Park J, Wicki J, Knoblaugh SE, Chamberlain JS, Lee D. Multi-Parametric MRI at 14T for Muscular Dystrophy Mice Treated with AAV Vector-Mediated Gene Therapy. PLoS One. 2015;10(4):e0124914.
5. McMillan AB, Shi D, Pratt SJP, Lovering RM. Diffusion tensor MRI to assess damage in healthy and dystrophic skeletal muscle after lengthening contractions. J Biomed Biotechnol. 2011 Jan;2011:970726.
6. Fieremans E, Lemberskiy G, Veraart J, Sigmund EE, Gyftopoulos S, Novikov DS. In vivo measurement of membrane permeability and myofiber size in human muscle using time-dependent diffusion tensor imaging and the random permeable barrier model. NMR Biomed. 2017 Mar;30(3).
7. Novikov DS, Fieremans E, Jensen JH, Helpern JA. Random walks with barriers. Nat Phys. 2011 Jun;7(6):508–14.
8. Fukada S, Morikawa D, Yamamoto Y, Yoshida T, Sumie N, Yamaguchi M, et al. Genetic background affects properties of satellite cells and mdx phenotypes. Am J Pathol. 2010;176(5):2414–24.
Figures
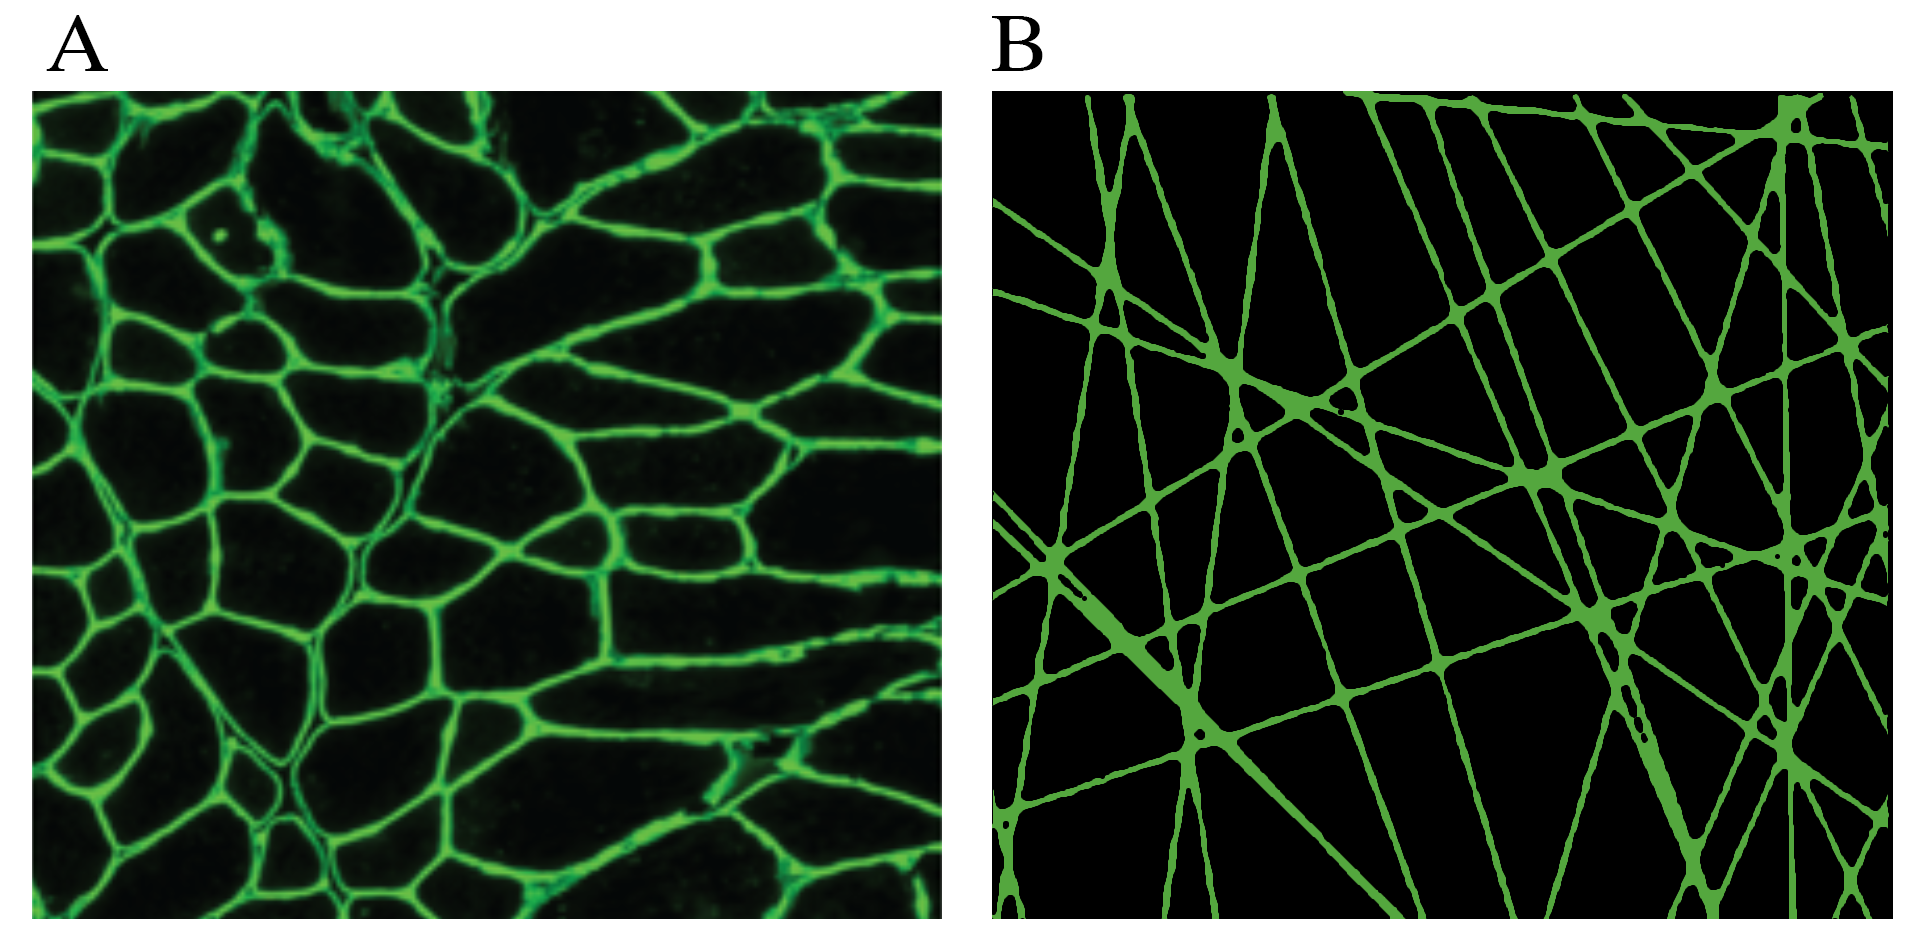
The random permeable barrier model (RPBM) introduces a novel tissue microstructure disorder class consisting of randomly placed and oriented extended permeable membranes, mimicking tightly-packed myofibers in the cross-section.
A) Histological cross section of the gastrocnemius muscle in which the muscle wall is stained with laminin.
B) RPBM in two dimensions, mimicking muscle fiber dimensions.
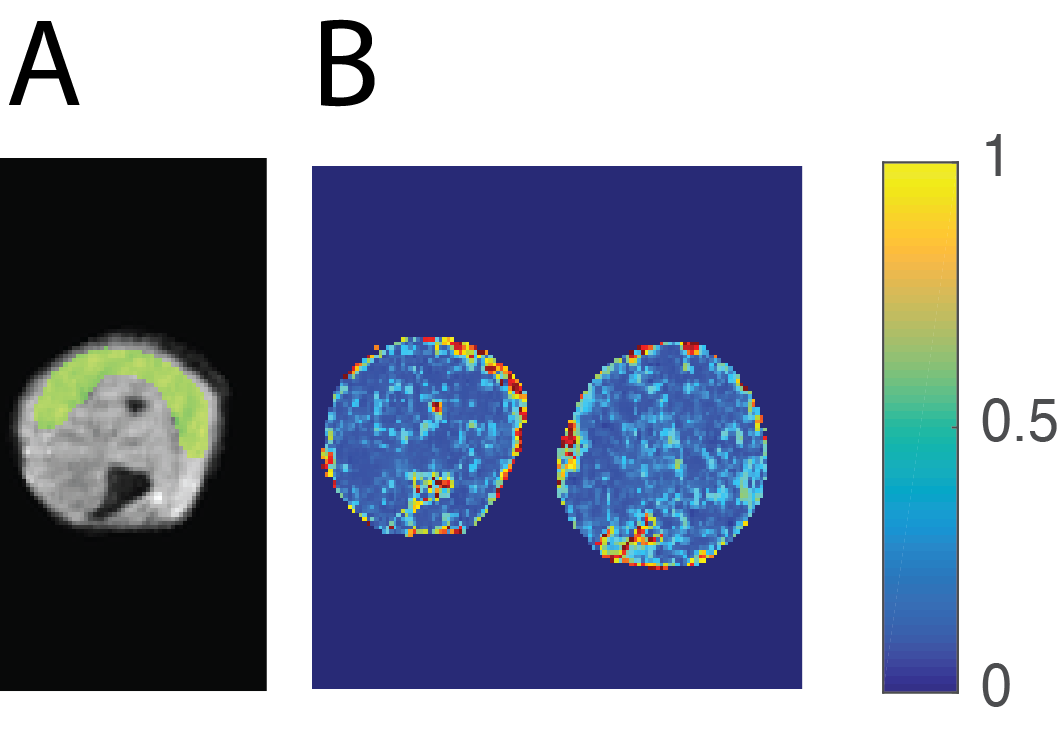
A) An example of a ROI in the gastrocnemius muscle overlaid in a non-weighed diffusion image with EPI readout. ROIs were drawn in the middle three slices.
B) Example FA maps of a WT-BL10 mouse (left) and a mdx-BL10 mouse (right) at a diffusion time of Δ=20ms is shown. Average FA was significantly different between mdx and wild type mice at Δ=20ms, while this is not easily seen on individual FA maps.
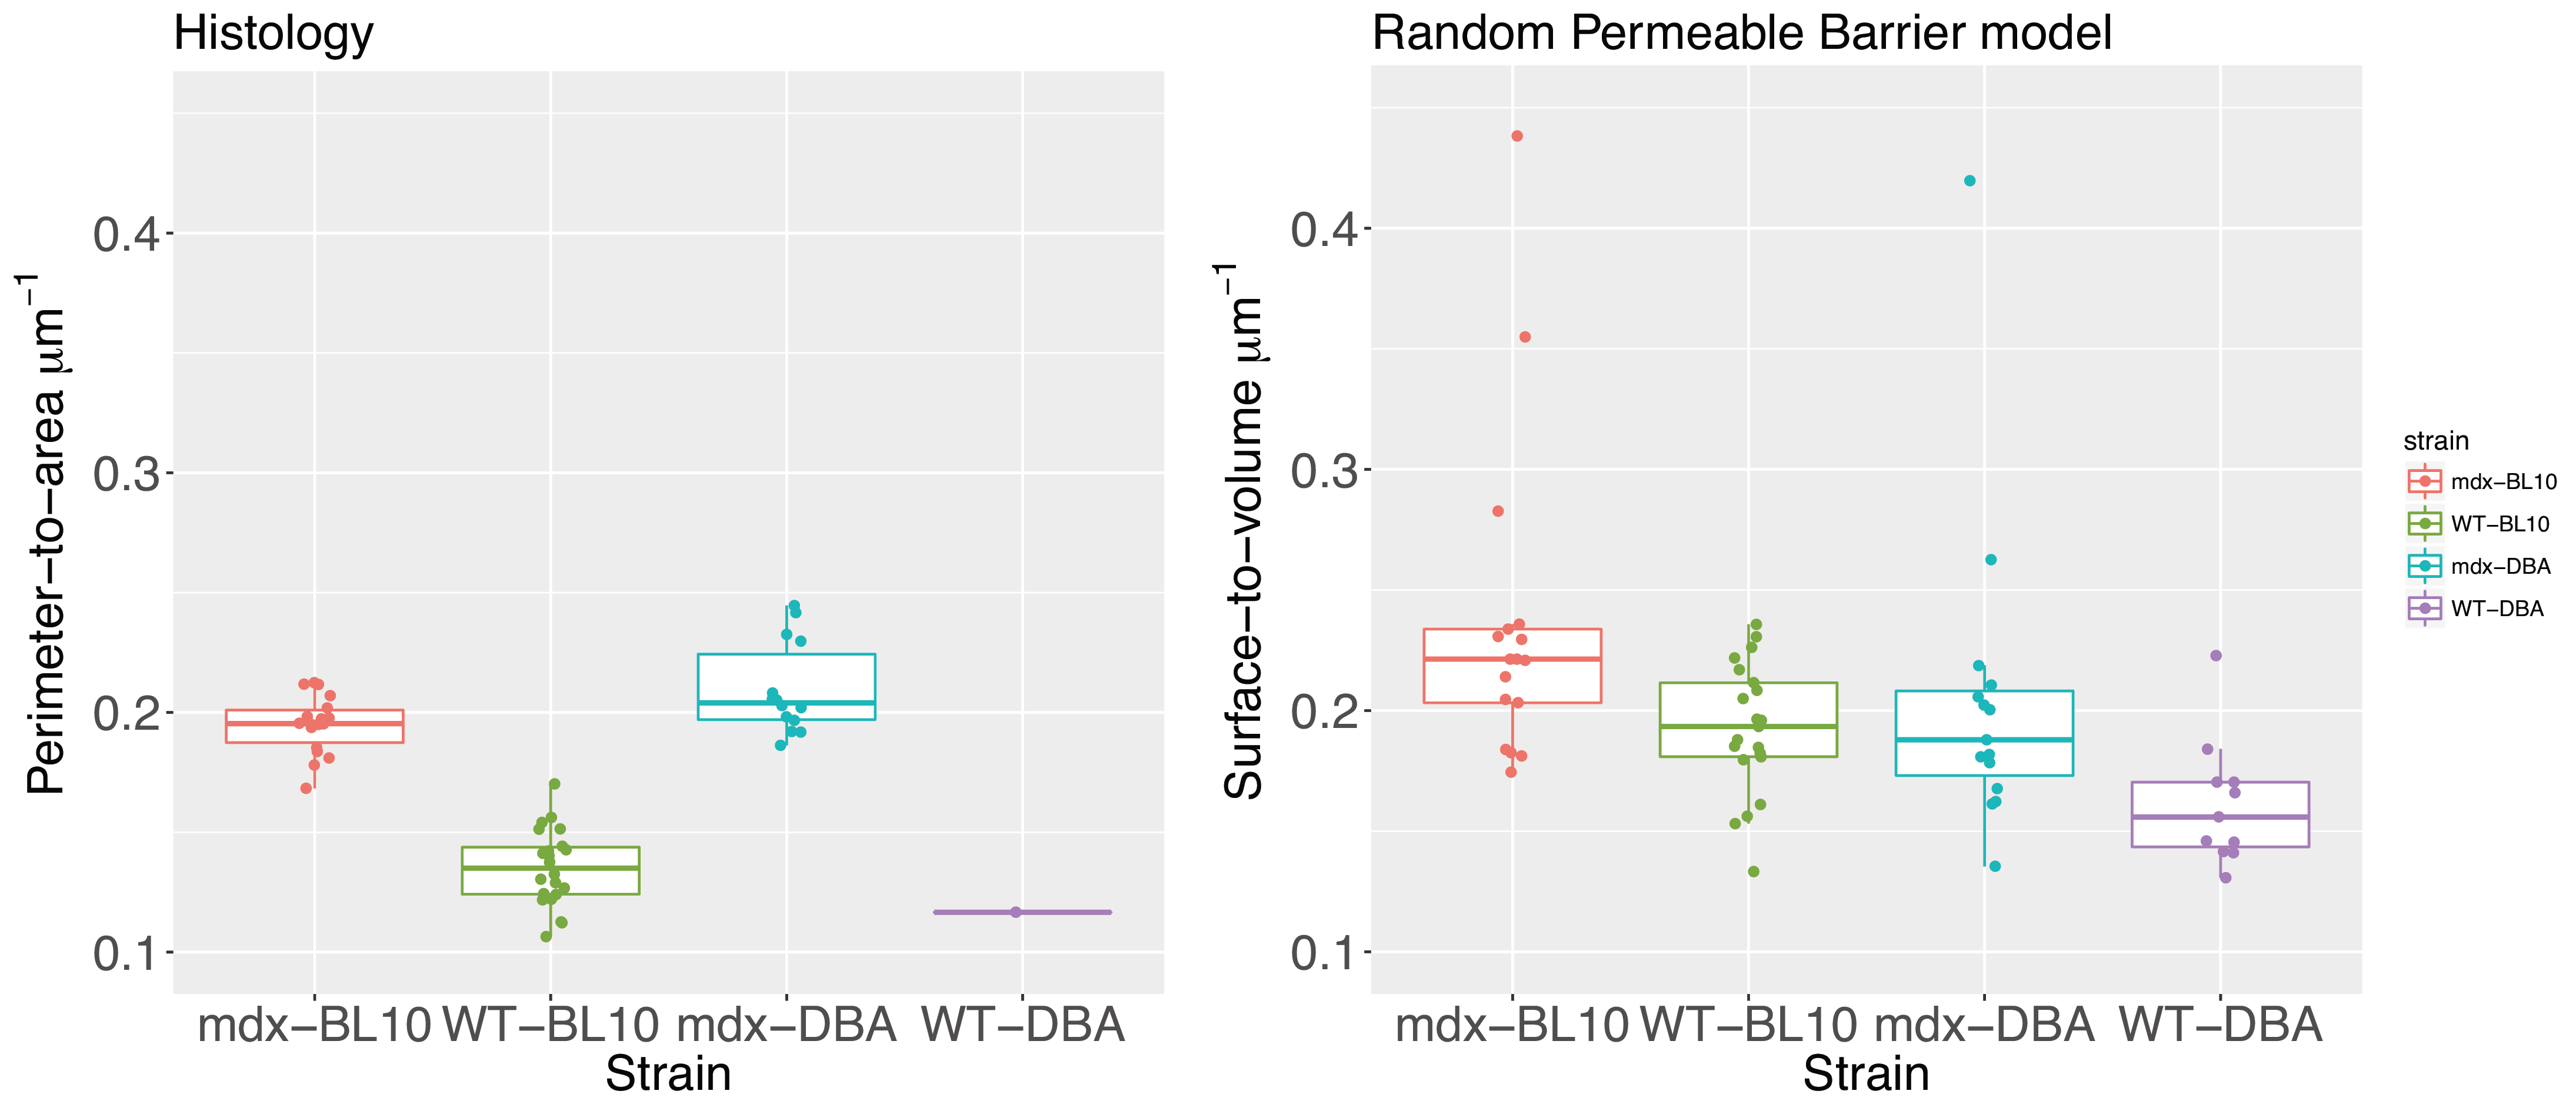
The histologically assessed perimeter-to-area ratio was significantly increased in 16 week old male mdx-BL10 compared to WT-BL10 mice (19.49+1.21% vs 13.51+1.60%; P<0.001).
The corresponding RPBM surface-to-volume ratio was increased as well (23.61+6.75% vs 19.27+2.71%; P=0.02). In mdx-DBA mice the surface-to-volume ratio was significantly increased compared to WT-DBA mice (20.50+6.64% vs 16.13+2.60%, P=0.03). For both genetic backgrounds the RPBM was able to differentiate between mdx and wild type mice.