0325
Isotropic 3D quantification of R1 and R2 relaxation and proton density in 6 minutes scan time1SyntheticMR, Linköping, Sweden, 2Center for Medical Imaging Science and Visualization (CMIV), Linköping, Sweden, 3Radiation Physics, Linköping, Sweden, 4Center for Medical Imaging Science and Visualization (CMIV), Linkoping, Sweden
Synopsis
Absolute quantification of R1 and R2 relaxation and proton density PD has been gaining considerable attention in the recent years. As yet, simultaneous quantification of R1, R2 and PD has been restricted to 2D methods, with high resolution in-plane but using relatively thick slices. A previously published method on cardiac quantification, QALAS, has been applied to the brain, providing a full quantification of R1, R2 and PD at 1.2 mm isotropic resolution in 3D using only 6 minutes scan time.
Purpose
Absolute quantification of MR properties such as R1 and R2 relaxation and proton density PD can provide objective measures in MRI. The additional advantage of a 3D quantification method is that the patient can be viewed from all sides. Recently, a cardiac 3D quantification method was published to measure R1, R2 and PD in a single breathhold1,2. This method, called QALAS, is generally applicable and the aim of this work was apply QALAS on the brain, with an isotropic resolution of 1.2 mm in 3D. QALAS was compared with the existing 2D quantification method QRAPMASTER3.
Methods
QALAS is a segmented 3D spoiled gradient echo sequence with 5 parallel acquisitions, interleaved with a T2 preparation and inversion pulse. QRAPMASTER is a saturation recovery multi-slice TSE sequence with multi-echo read-out. Both sequences generate multiple (5 and 8) images with different effects of R1 and R2 relaxation. Twenty-four different phantoms were produced, containing various mixtures of Gadolinium contrast media and agar to create different combinations of R1 relaxation in the range 0.25-3 s-1 and R2 relaxation in the range 1-20 s-1. For comparison, an inversion recovery sequence was performed with a TR of 10 s and 6 inversion delay times at 100, 200, 500, 1000, 2000 and 5000 ms, to calculate a reference R1. Furthermore, a multi-echo TSE sequence was performed using 20 echoes at 10 ms echo time spacing to calculate a reference R2. ROIs were placed in the phantoms tubes and the correlation was investigated with linear regression and the Pearsson correlation coefficient. Additionally, a group of 10 volunteers was acquired with the two quantification methods, QALAS and QRAPMASTER. The automatically segmented brain volumes4 of white matter, grey matter, cerebrospinal fluid and myelin5 were then correlated. All post-processing was performed by SyMRI6 v11 (SyntheticMR, Sweden). The scanner was a patched Ingenia 3T at R5.1.8 of Philips Healthcare (Best, the Netherlands).Results
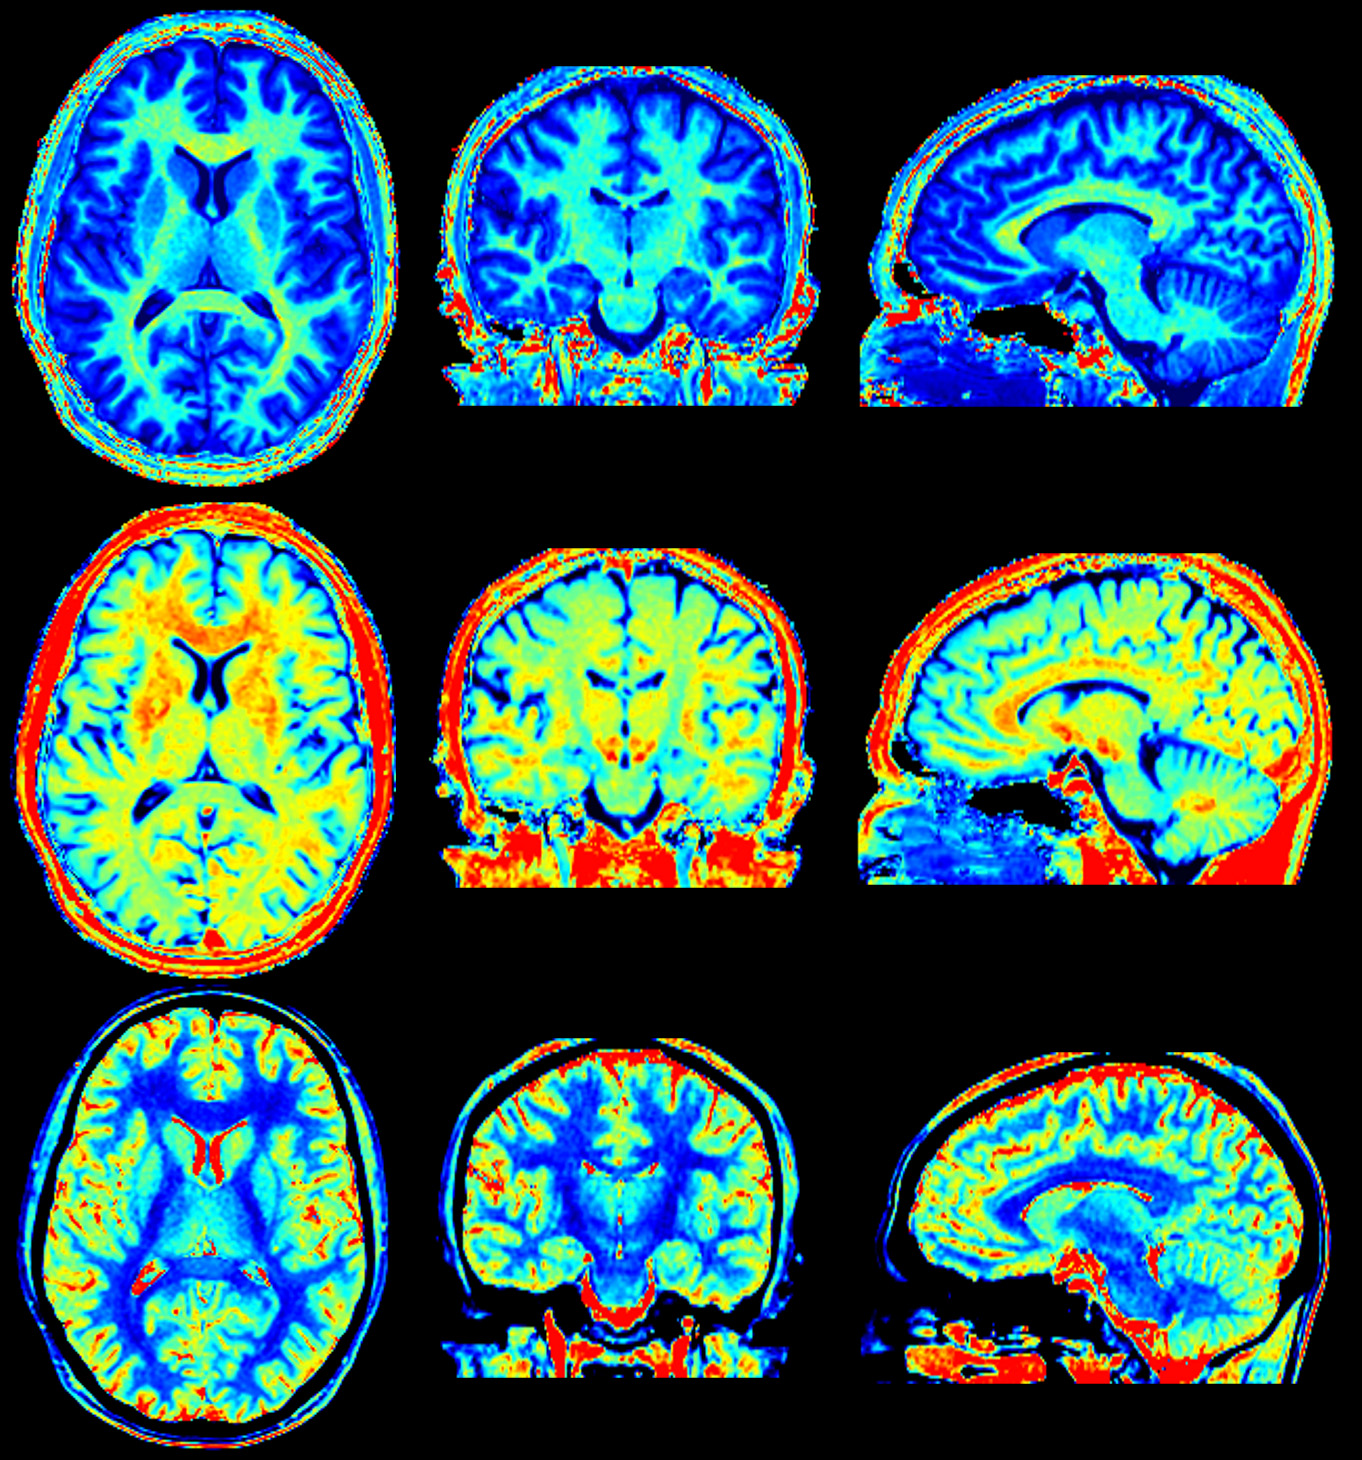
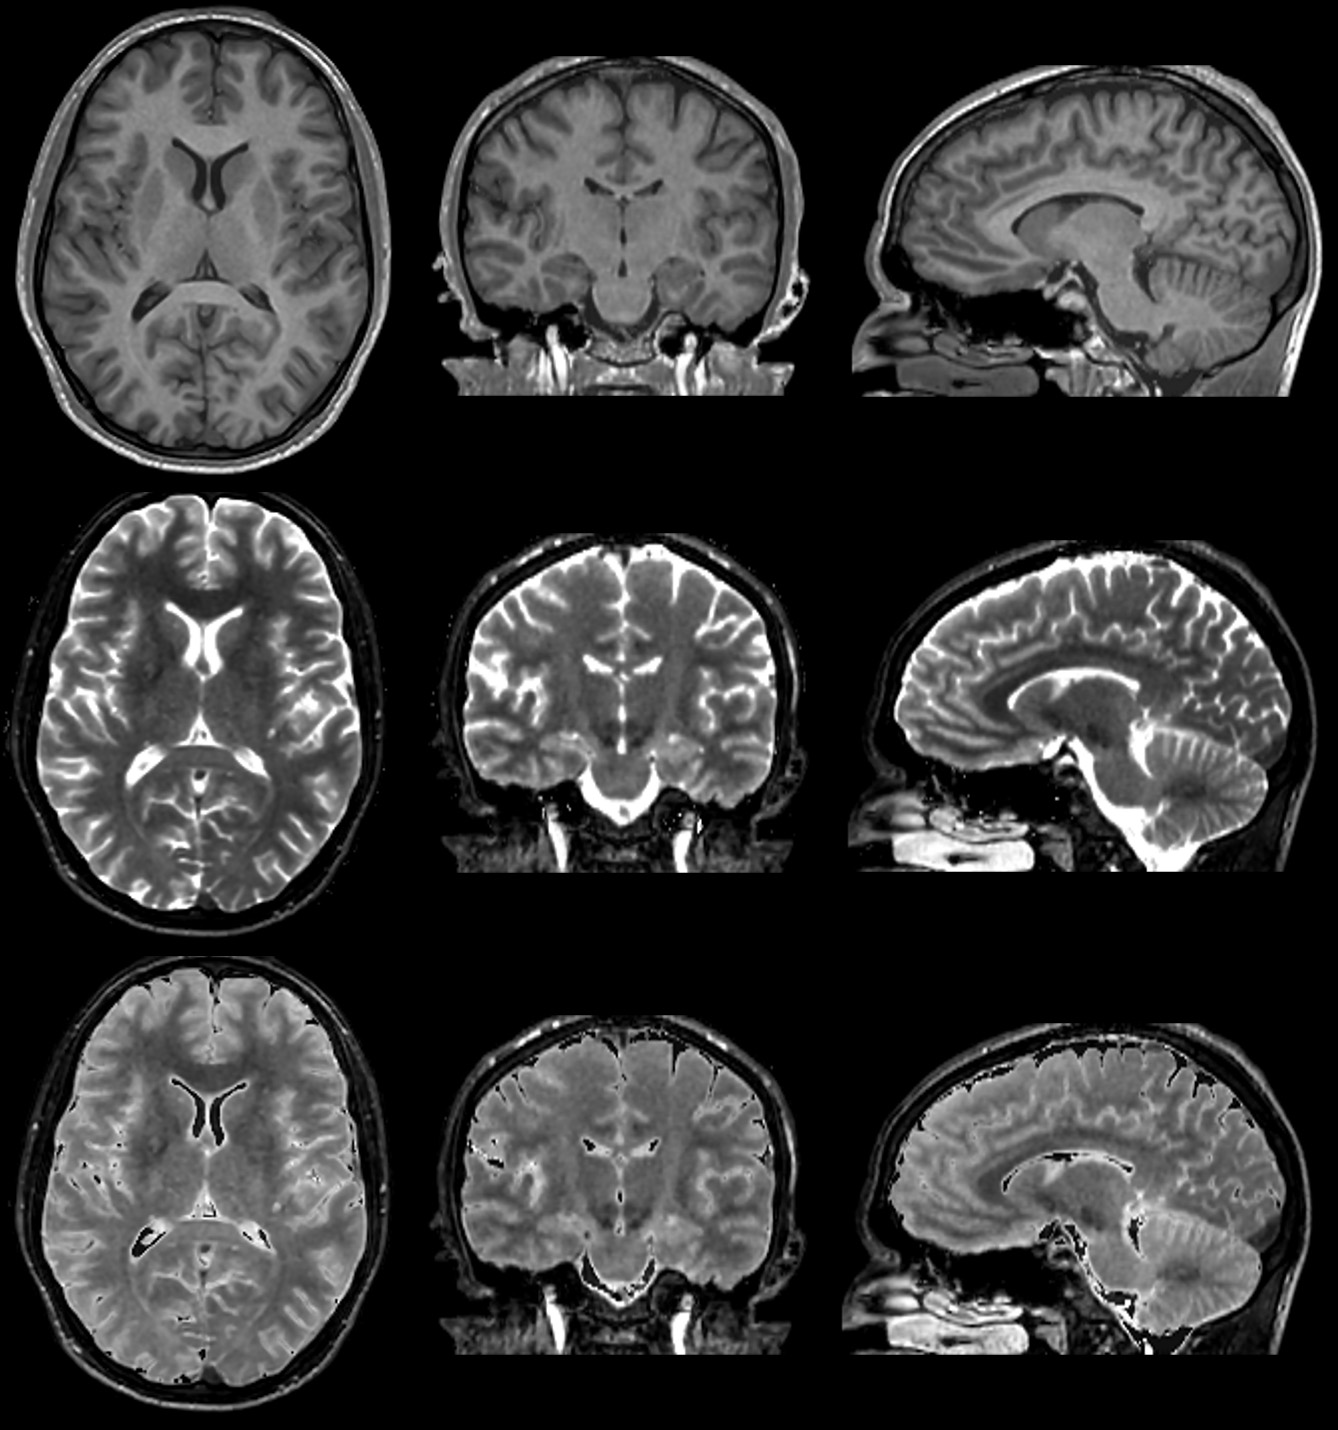
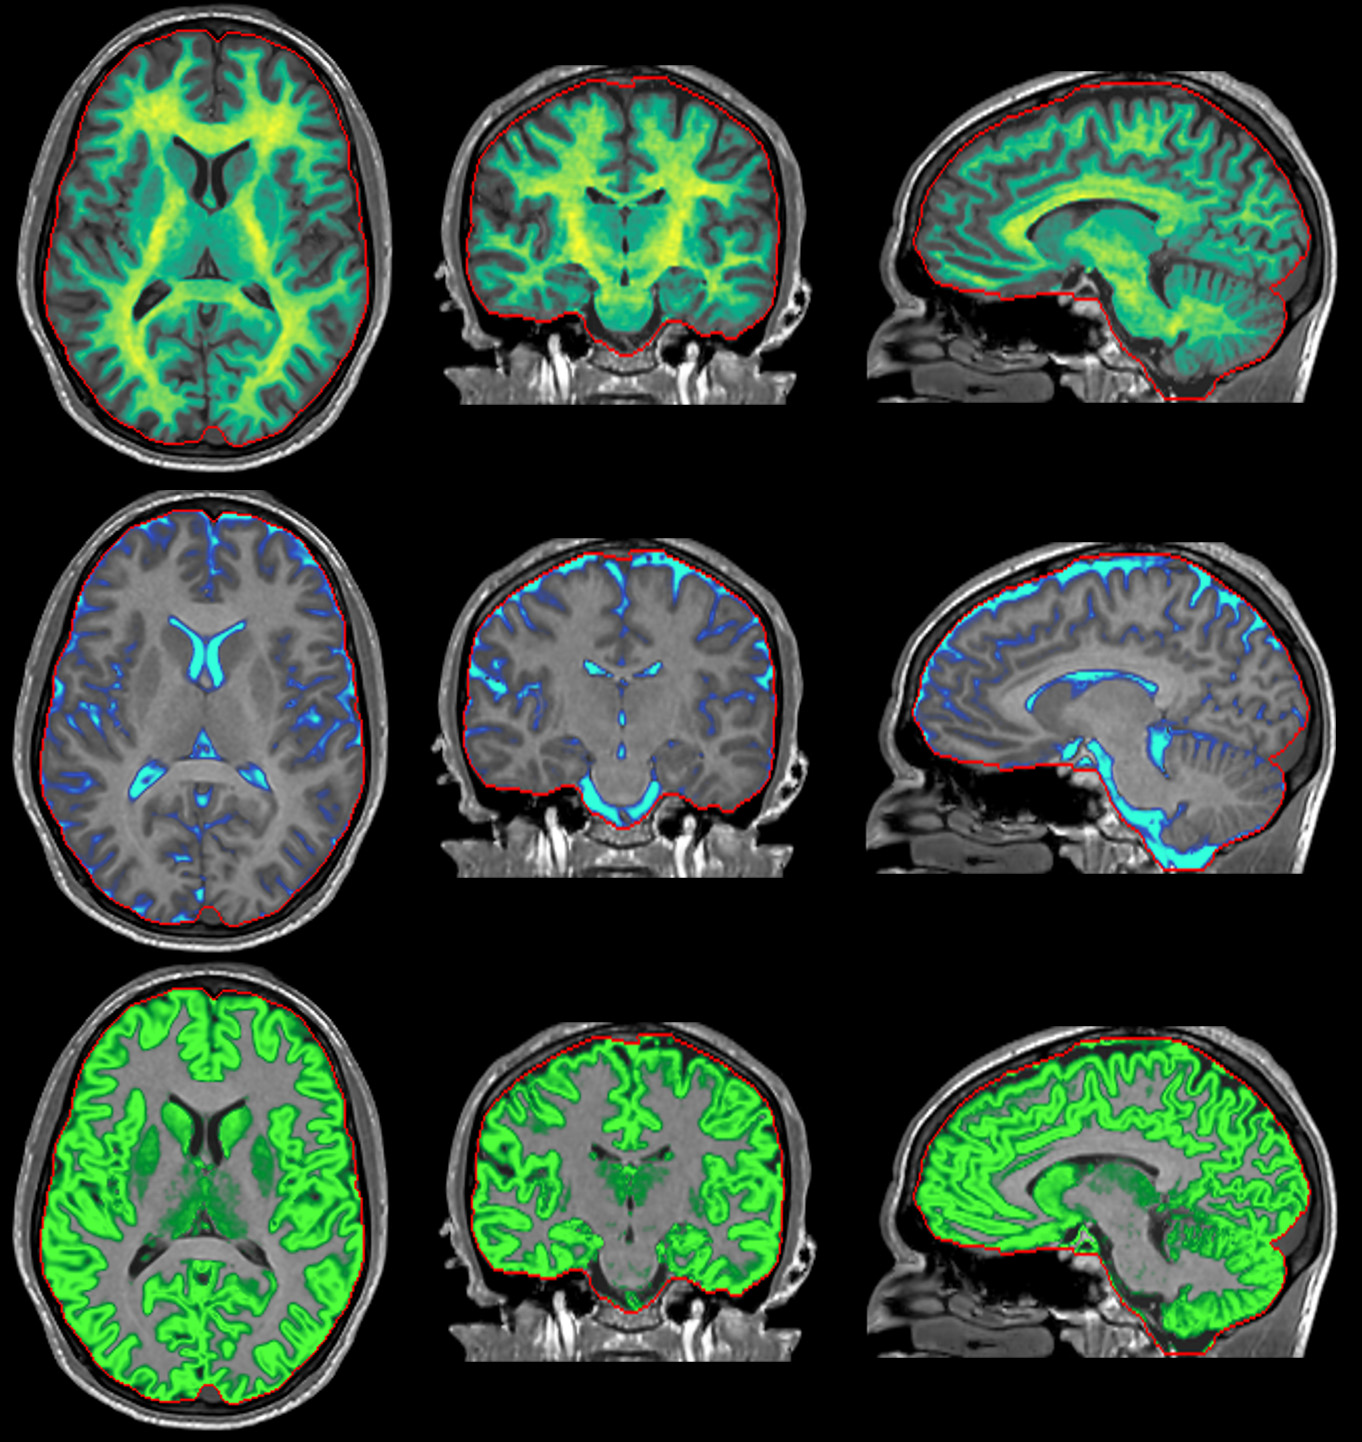
Linear regression showed a slope of 0.97 and an intercept of 0.01 of QALAS R1 in comparison with inversion recovery R1. A slope of 1.02 and an intercept of 0.01 was observed for QALAS R2 in comparison with multi-echo R2. The Pearson correlation coefficient was 0.99 in both cases. The observed mean brain volume for QALAS was 1337 ml, the mean intracranial volume was 1493 ml, a difference of -36 ml and -34 ml, respectively, compared with QRAPMASTER. WM volume was 552 ml, GM 744 ml, CSF 157 ml and myelin 176 ml, a difference -9, -45, -1, -11 ml, respectively. All QALAS volumes were smaller, with 2.0-2.7% of the ICV in comparison to QRSPMASTER. Normalized for ICV, the brain fraction BPF was 89.5% (difference -0.2%), WM fraction 36.9%, GM fraction 49.8%, CSF fraction 10.5% and myelin fraction 11.8%. The difference of the normalized volumes was <1% both methods. In the figures, examples of the possibilities of the simultaneous R1, R2 and PD mapping are shown, including quantification maps, synthetic contrast images and automatic brain segmentation. All images in the figures were generated from the same 6 minutes acquisition.Conclusion
Absolute quantification of R1, R2 and PD in 3D isotropic resolution provides very similar values compared to a known 2D quantification method in the brain. Automatic brain volume measurements showed an overall scaling difference which could be removed by normalizing with the ICV. Quantitative MRI may provide more objective decision support and abundant information in a very short scan time.Acknowledgements
No acknowledgement found.References
1. Kvernby et al. Simultaneous three-dimensional myocardial T1 and T2 mapping in one breath hold with 3D-QALAS. J Cardiovasc Magn Reson 2014;16:102-105
2. Kverby et al. Clinical feasibility of 3D-QALAS - Single breath-hold 3D myocardial T1- and T2-mapping. Magn Reson Imaging 2017;38:13-2
3. Warntjes et al. Rapid magnetic resonance quantification on the brain: Optimization for clinical usage. Magn Reson Med 2008;60:320-329
4. West et al. Novel whole brain segmentation and volume estimation using quantitative MRI. Eur Radiol. 2012;22:998-1007
5. Warntjes et al. Myelin Detection Using Rapid Quantitative MR Imaging Correlated to Macroscopically Registered Luxol Fast Blue-Stained Brain Specimens. AJNR Am J Neuroradiol. 2017;38:1096-1102
6. Hagiwara et al. SyMRI of the Brain: Rapid Quantification of Relaxation Rates and Proton Density, With Synthetic MRI, Automatic Brain Segmentation, and Myelin Measurement. Invest Radiol. 2017;52:647-65
Figures