0322
Formalin Tissue Fixation Biases Myelin Density Measurement by Quantitative Magnetization Transfer and Myelin Water Imaging1Translational and Molecular Imaging Institute, Icahn School of Medicine at Mount Sinai, New York, NY, United States, 2Department of Radiology, Icahn School of Medicine at Mount Sinai, New York, NY, United States, 3Graduate School of Biomedical Sciences, Icahn School of Medicine at Mount Sinai, New York, NY, United States, 4Department of Pathology, Icahn School of Medicine at Mount Sinai, New York, NY, United States, 5Department of Neuroscience, Icahn School of Medicine at Mount Sinai, New York, NY, United States
Synopsis
Quantitative magnetization transfer (qMT) and multi-exponential T2-based myelin water imaging (MWI) are commonly-used MRI methods to quantify myelin content. Ex vivo MRI remains an essential step for validating these quantitative in vivo MRI biomarkers. However, ex vivo tissue is often preserved using formalin, which cross-links proteins and directly impacts these methods. We performed qMT and MWI on human spinal cord tissue before and after formalin fixation to quantify the effect of fixation on these biomarkers. QMT bound pool fraction (F) increased by 37.5% and MWI myelin water fraction (MWF) increased by 35.5-38.6%, but myelin-related image contrast was preserved.
Introduction
Quantification of central nervous system myelin content has important applications to demyelinating diseases. Quantitative magnetization transfer (qMT)1,2 and multi-exponential T2-based myelin water imaging (MWI)3,4 are two commonly used MRI methods to quantify myelin content. Although substantial literature exists to histologically validate ex vivo qMT and MWI, most of these reports used tissue samples after fixation. Chemical fixatives, such as formalin, form cross-links between proteins5,6, which decreases T1 and T2 of tissue water7,8 and enhances the magnetization transfer effect8. In this work, we perform qMT and MWI on human spinal cord tissue before and after formalin fixation to detect and quantify biases introduced by the fixation process.Methods
Two 16-mm segments of unfixed, unfrozen human cervical spinal cord were obtained at autopsy from a 59-year-old male with no demyelinating conditions. Specimens were placed in 20-mm glass NMR tubes and immersed in saline. Imaging, beginning 23 hours after death, was performed on a 9.4T micro-imaging system (Bruker, USA) using a 33-mm birdcage RF probe (Rapid Biomedical, Germany).
QMT: MT-prepared 3D spoiled gradient-echo (MT-SPGR) sequence2 with the following parameters: MT pulse duration=10.3ms, MT pulse flip angles=142°/710°/1388°, 20 MT pulse offsets log-spaced 234Hz-80kHz, TR=25ms, excitation flip angle=7°, TE=2.01ms, 2 signal averages (16 for MT off), FOV=20x20x40mm3, resolution=250x250x500μm3. Voxelwise MT data were fitted to a two-pool MT model using qMRILab9.
MWI: 3D multi-echo spin echo sequence10,11 with the following parameters: TR=520ms, 18 echoes, echo spacing=7.5ms, amplitude-modulated refocusing spoiler gradients12, 4 signal averages, FOV=20x20x40mm3, resolution=250x250x500μm3. Voxelwise and ROI-averaged echo trains were fitted to an array of 100 exponentials under both two-Gaussian-pool (width=5) and minimum curvature (regularization weight=0.002) constraints using the MERA toolbox13. Fitted pools with time constants <30ms were classified as myelin water, and pools with time constants >30ms were classified as intra/extracellular water.
Fixation: After pre-fixation scanning (38 hours after death), the specimens were placed in 20mL of 10% neutral buffered formalin for 24 hours, then rinsed by serial immersion in 20mL volumes of saline over 24 hours to remove residual formalin. The specimens were then scanned again using the same imaging protocols.
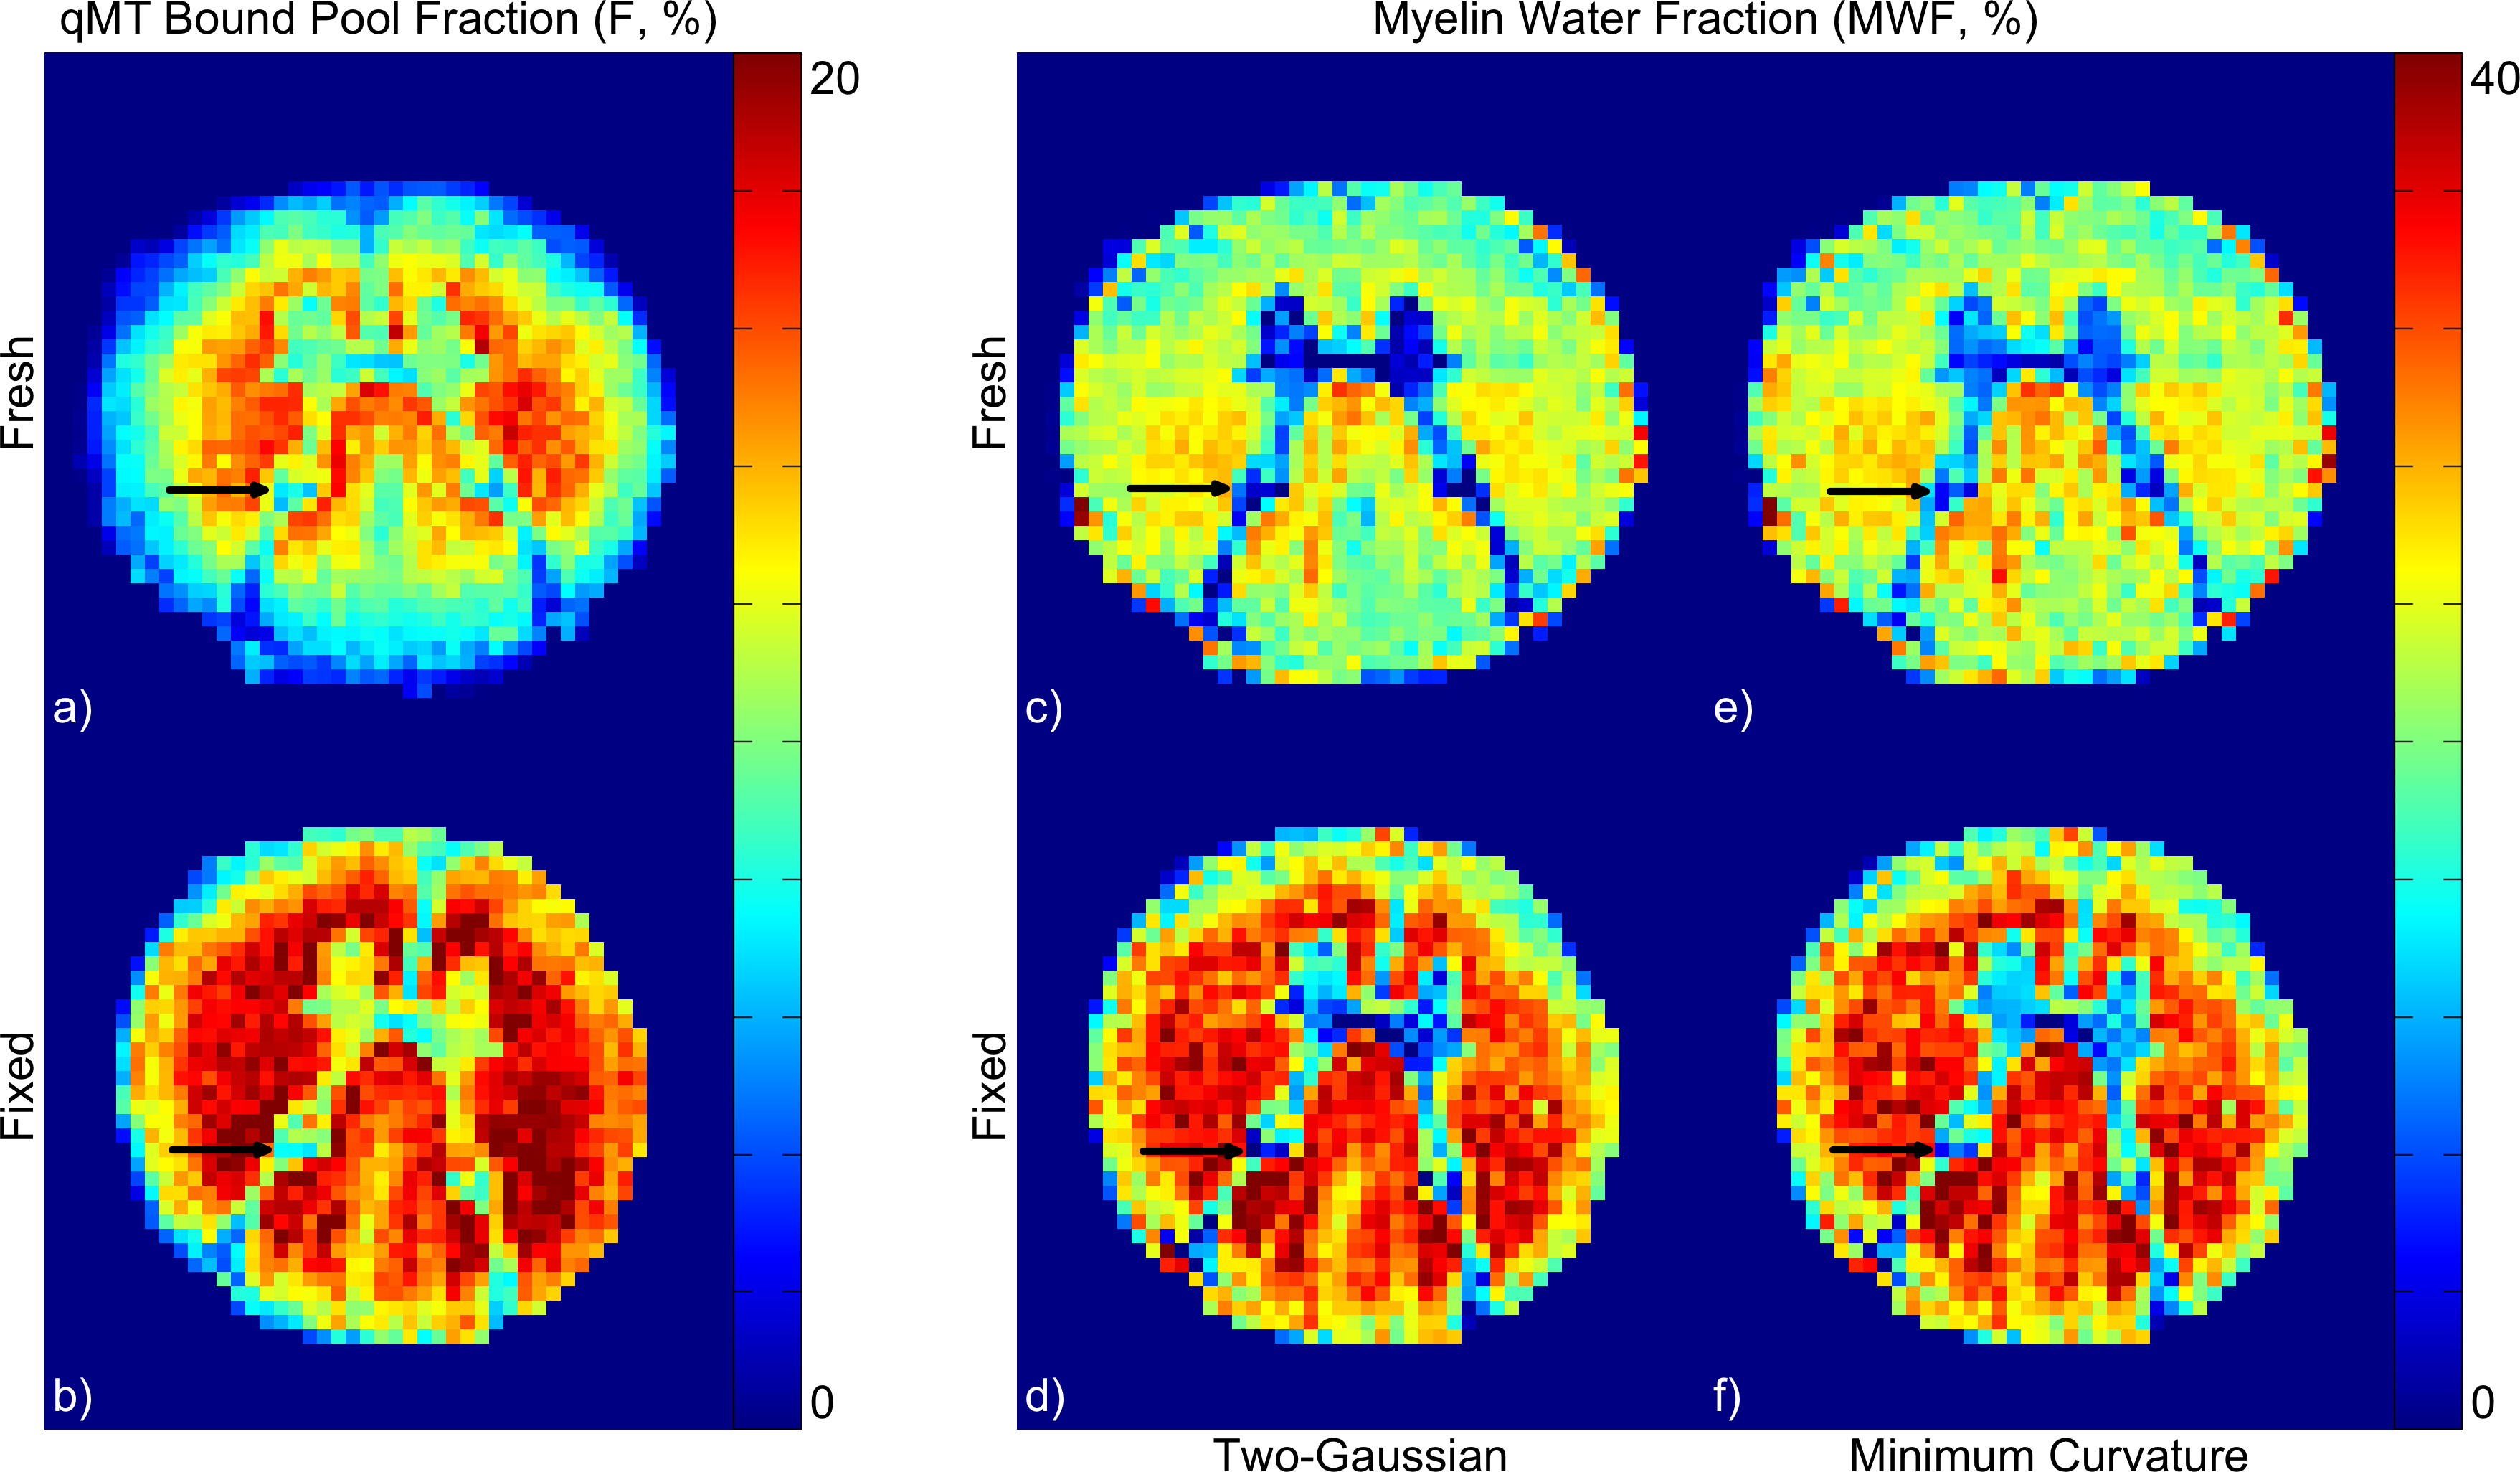
Analysis: Three ROIs were drawn in a central 2-mm slab in each specimen: the dorsal column white matter, lateral white matter, and gray matter. Voxelwise maps of qMT bound pool fraction (F), and myelin water fraction (MWF) under both constraints, were averaged within these ROIs. T2 signal decay curves were also averaged within the ROIs and then analyzed separately in MERA. Paired two-tailed t-tests were performed to compare pre- and post-fixation measurements.
Results
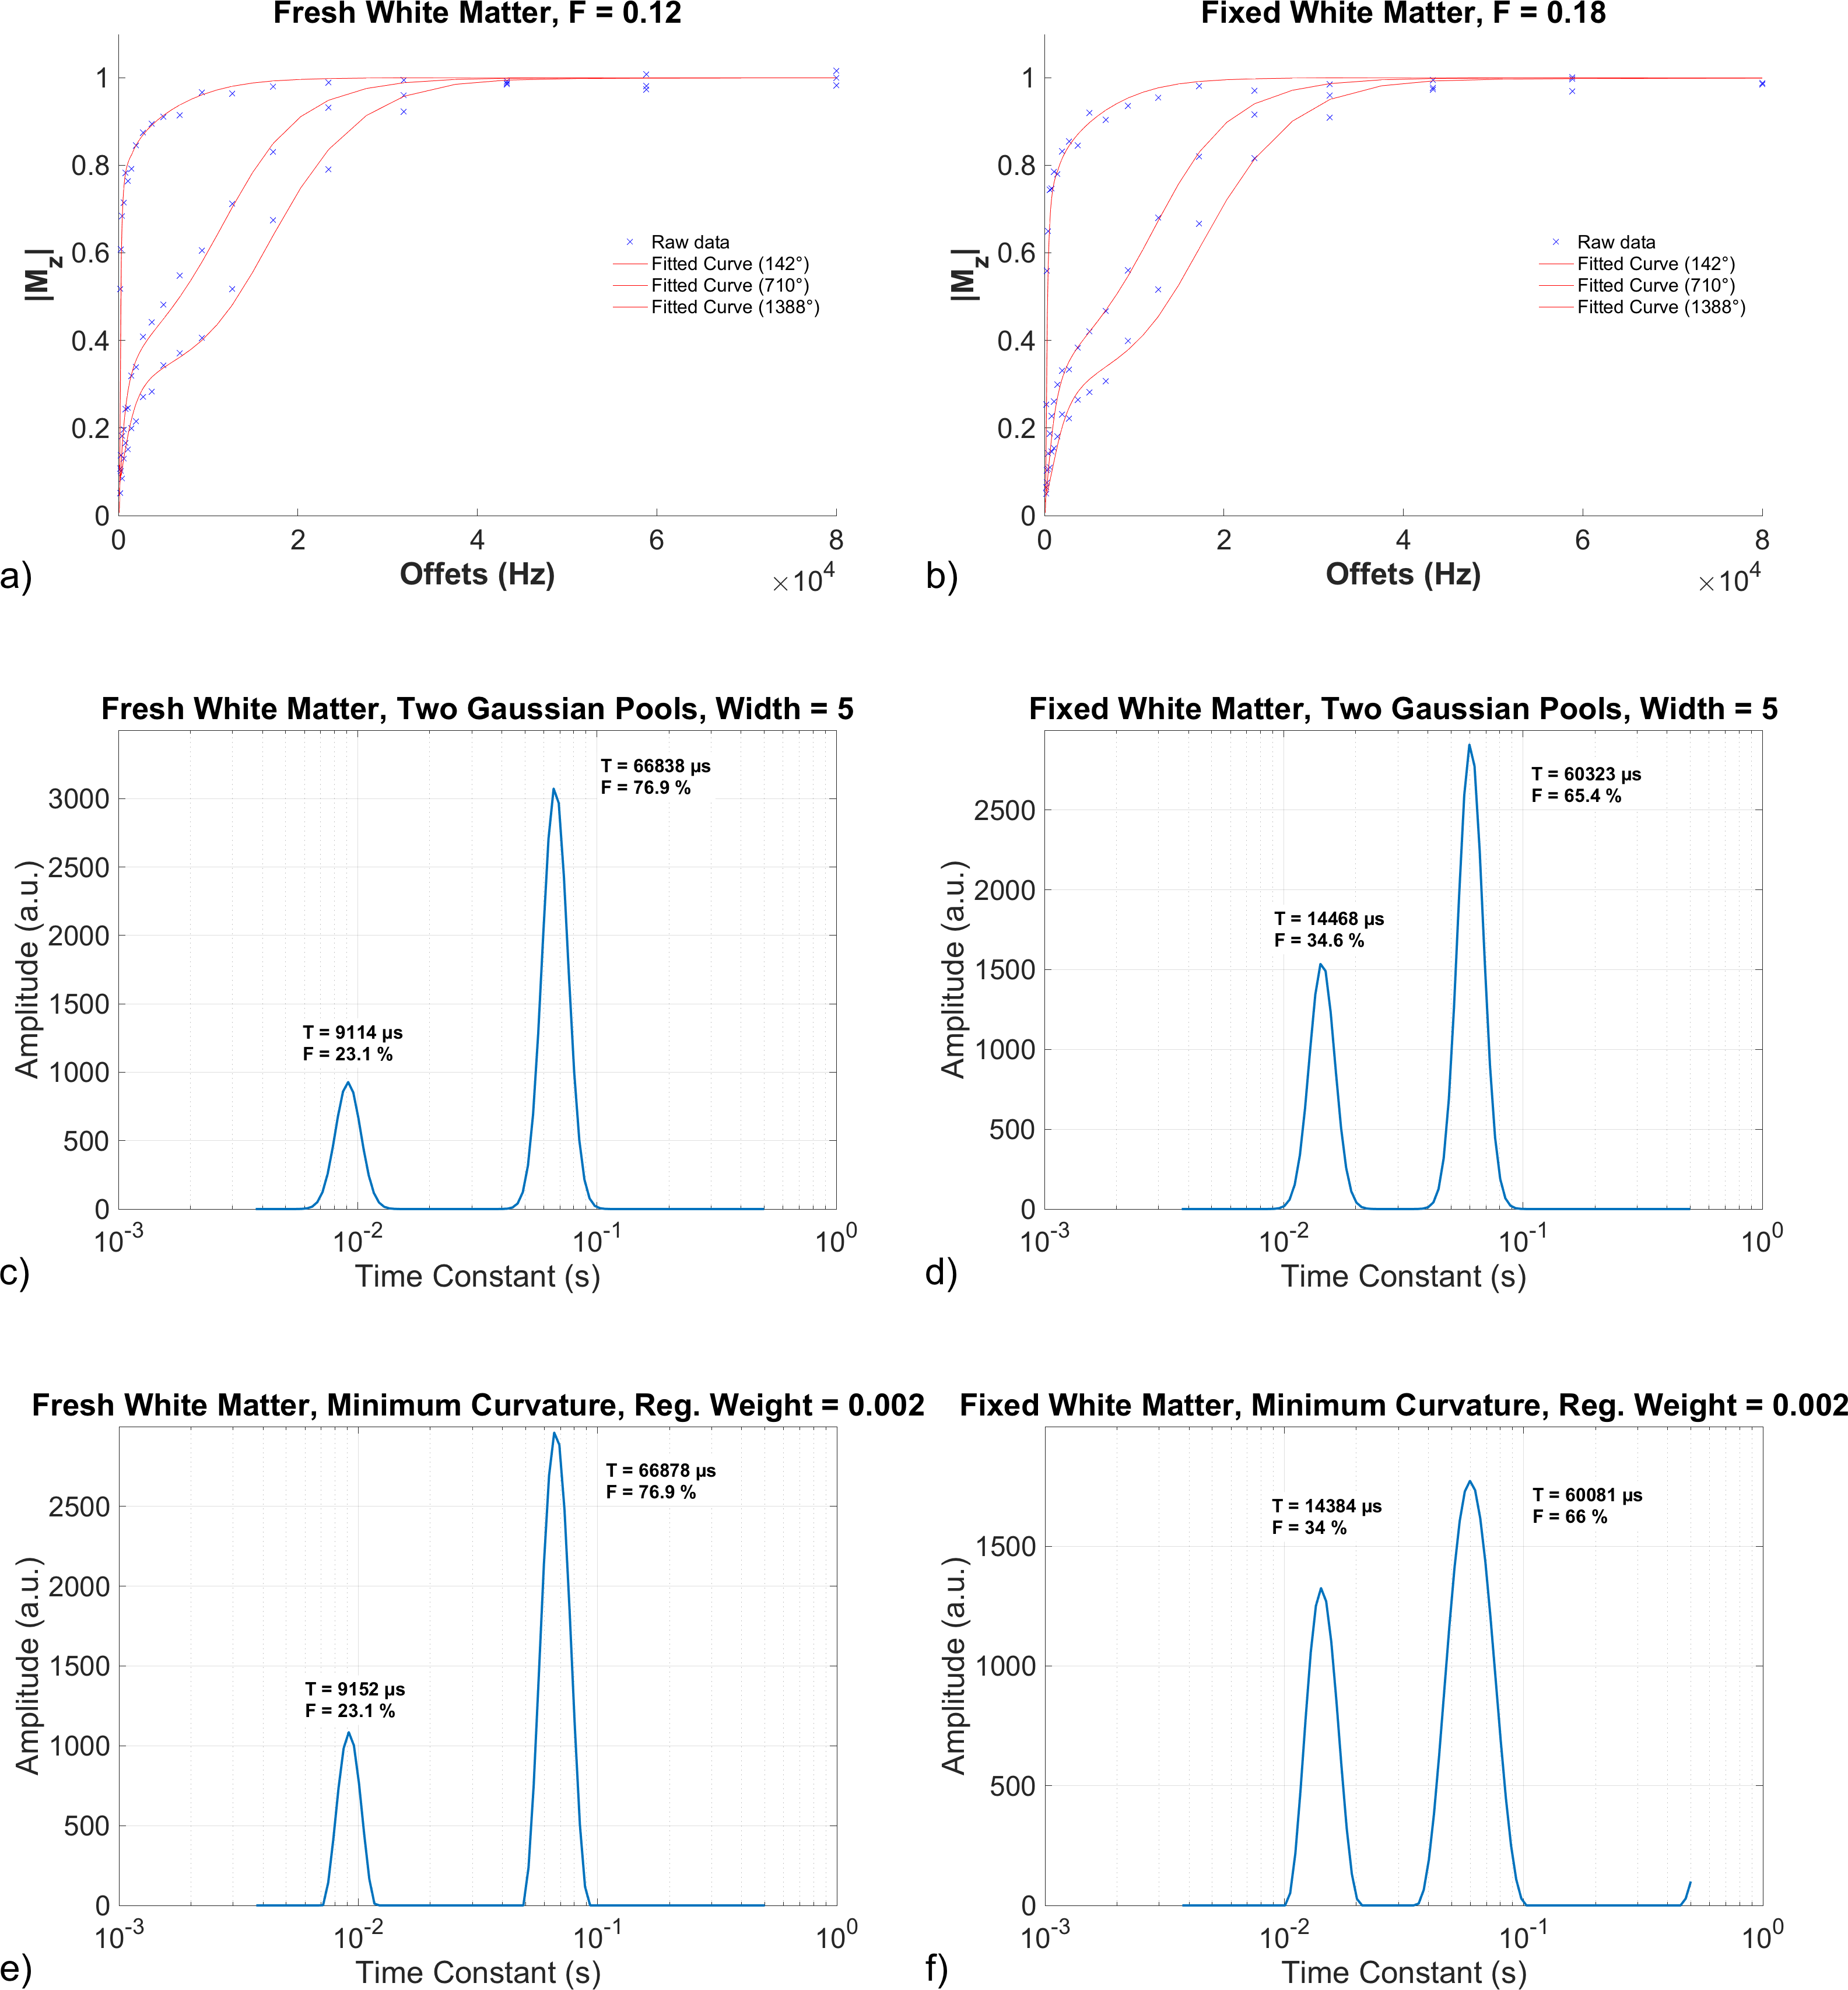
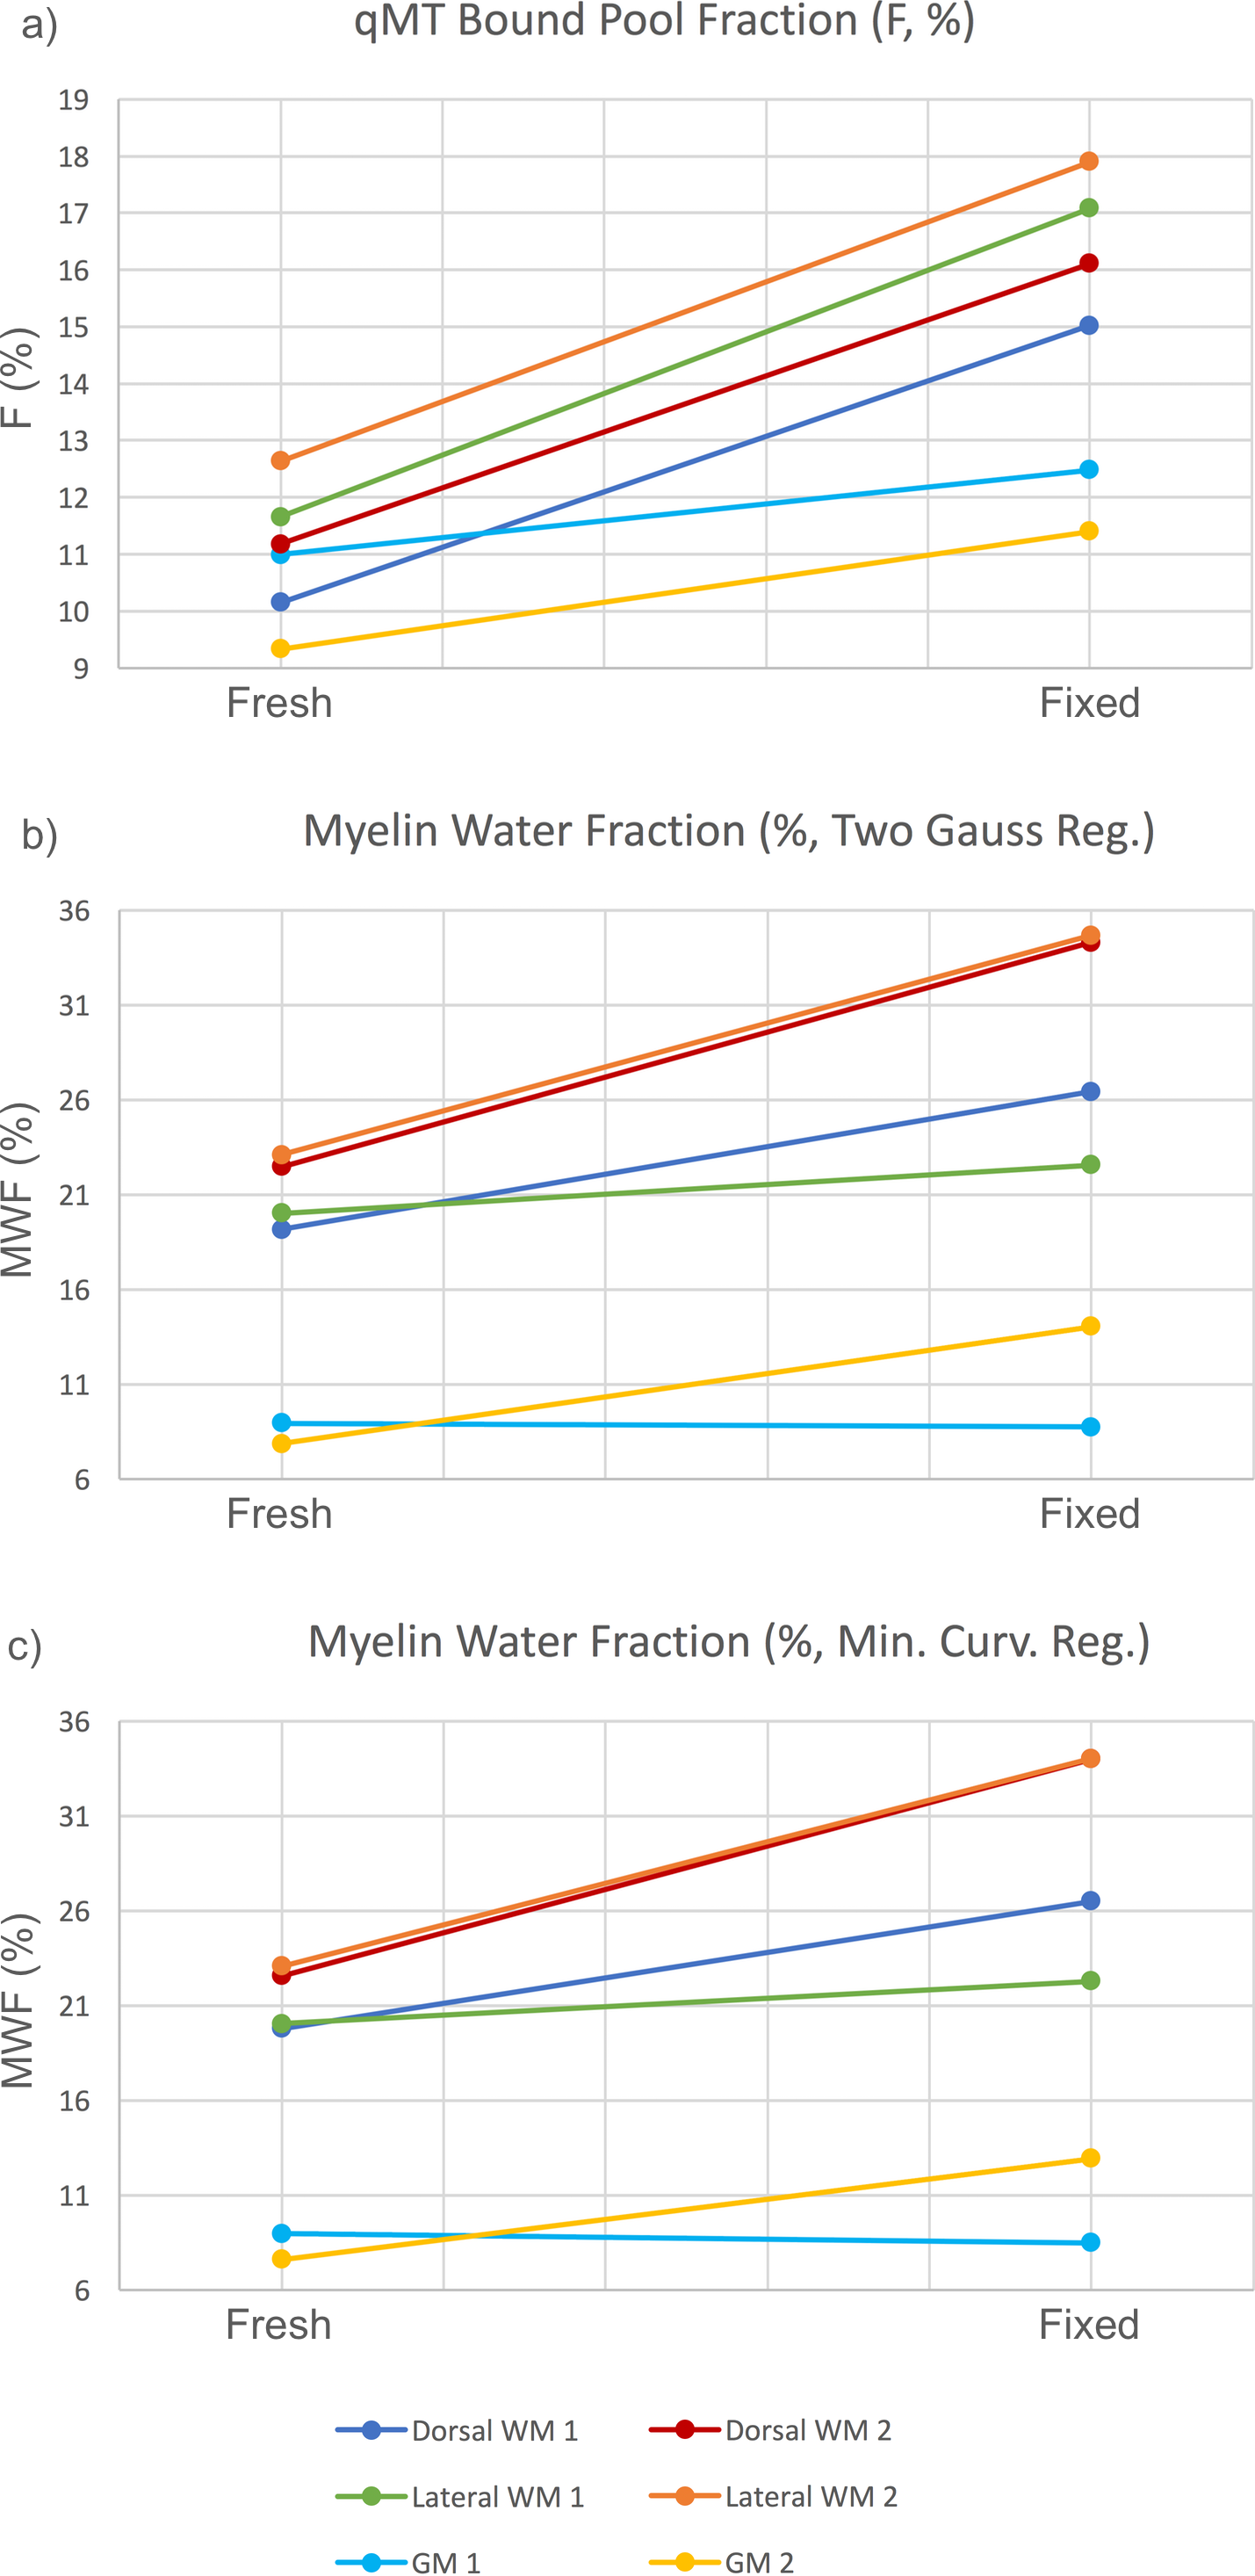
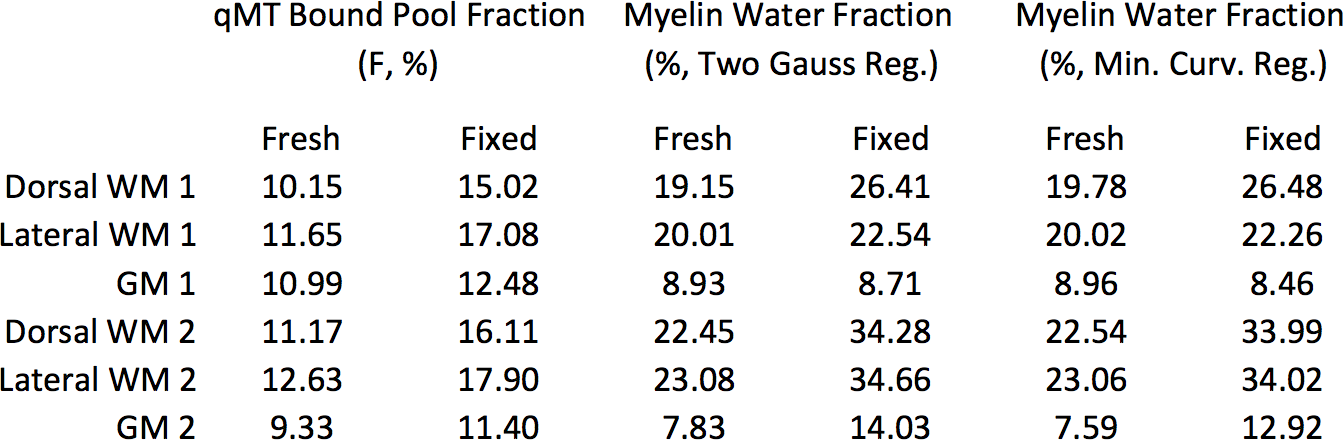
Representative F and MWF maps for a specimen pre- and post-fixation are shown in Figure 1, and example fitting results are shown in Figure 2. After fixation, F increased by 37.5% (p=0.0025), MWF under a two-Gaussian constraint increased by 38.6% (p=0.021), and MWF under a minimum-curvature constraint increased by 35.5% (p=0.026). Under both regularization constraints, the time constant of the intra/extracellular water pool decreased by ~10% and the time constant of the myelin water pool increased by ~40%. Line plots (Figure 3) and a data table (Table 1) are also provided. Notably, myelin-related contrast in all parametric maps is maintained after fixation. Cross-sectional area of the spinal cords decreased by 7% after fixation.Discussion
F increased significantly due to the cross-linking of proteins by formalin and the resulting expansion of the macromolecular pool, though by slightly less than the ~50% reported by Schmierer et al.14. Surprisingly, MWF also increased significantly. This observed increase in MWF after fixation using the aforementioned regularization methods differs from the consistency of MWF measured in vivo and after tissue fixation reported by Laule et al.4, although this difference may be explained by differences in regularization during multi-exponential fitting. Tissue microstructure changes are also expected between in vivo and fresh post-mortem tissue.
Formalin fixation is expected to decrease the fitted T2 of the intra/extracellular water pool, which is evident in our data (Figure 2). The observed increase in both the myelin water pool T2 and fractional size is likely secondary to the regularization involved in multi-exponential T2 fitting (i.e., fitting a broad spectrum of T2 values to a set of discrete pools). Specifically, we suspect that the shortening of intra/extracellular water T2 may have resulted in some intra/extracellular water being assigned to the myelin water pool, increasing both its fractional area and its mean T2.
Conclusion
Fixation of human spinal cord tissue by immersion in 10% formalin for 24 hours results in a 35-39% increase in the measured qMT bound pool fraction and myelin water fraction, despite the expected preservation of myelin contrast.Acknowledgements
No acknowledgement found.References
[1] Henkelman RM, Stanisz GJ, Graham SJ. Magnetization transfer in MRI: a review. NMR Biomed 2001;14:57-64
[2] Sled JG, Pike GB. Quantitative imaging of magnetization transfer exchange and relaxation properties in vivo using MRI. MRM 2001;46:923-931.
[3] MacKay A, Laule C, Vavasour I, Bjarnason T, Kolind S, Mädler B. Insights into brain microstructure from the T2 distribution. Magn Res Imaging 2005;24:515-525.
[4] Laule C, Kozlowski P, Leung E, Li D, MacKay A, Moore G. Myelin water imaging of multiple sclerosis at 7 T: correlations with histopathology. NeuroImage 2008;40:1757-1580.
[5] Puchtler H, Meloan SN. On the chemistry of formaldehyde fixation and its effects on immunohistochemical reactions. Histochemistry 1985;82:201-204.
[6] Metz B, Kersten GF, Hoogerhout P, et al. Identification of formaldehyde-induced modifications in proteins: reactions with model peptides. J Biol Chem 2004;279(8):6235-6243.
[7] Dawe RJ, Bennett DA, Schneider JA, et al. Postmortem MRI of human brain hemispheres: T2 relaxation times during formaldehyde fixation. Magn Res Med 2009;61(4):810-818.
[8] Fishbein KW, Gluzband YA, Kaku M, et al. Effects of formalin fixation and collagen cross-linking on T2 and magnetization transfer in bovine nasal cartilage. Magn Res Med 2007;57:1000-1011.
[9] Cabana J-F, Gu Y, Boudreau M, et al. Quantitative magnetization transfer imaging made easy with qMTLab: software for data simulation, analysis, and visualization. Concepts in Magnetic Resonance Part A 2015;44A:263-277.
[10] Harkins KD, Dula AN, Does MD. Effect of intercompartmental water exchange on the apparent myelin water fraction in multiexponential T2 measurements of rat spinal cord. Magn Res Med 2012;67:793-800.
[11] West KL, Kelm ND, Carson RP, Gochberg DF, Ess KC, Does MD. Myelin volume fraction imaging with MRI. NeuroImage 2016 (in press).
[12] Poon CS, Henkelman RM. Practical T2 quantitation for clinical applications. J Magn Res Imaging 1992;2:541-553.
[13] Does MD. MERA. http://www.vuiis.vanderbilt.edu/~doesmd/MERA/MERA_Toolbox.html.
[14] Schmierer K, Wheeler-Kingshott C, Tozer D, et al. Quantitative magnetic resonance of postmortem multiple sclerosis brain before and after fixation. Magn Res Med 2008;59:268-277.
Figures