0321
Myelin Lipid 1H Density Measurements by IR-UTE are Consistent Before and After D2O Exchange1Department of Radiology, University of Pennsylvania, Philadelphia, PA, United States, 2Translational and Molecular Imaging Institute, Icahn School of Medicine at Mount Sinai, New York, NY, United States, 3Department of Chemistry, Temple University, Philadelphia, PA, United States, 4SAIF Core Facility, Children's Hospital of Philadelphia, Philadelphia, PA, United States
Synopsis
In this work, the efficacy of long-T2 tissue water suppression by adiabatic inversion-recovery preparation is examined by IR-UTE imaging of an ovine spinal cord specimen in native hydration and deuterium oxide (D2O)-exchanged states. Myelin density in three white matter regions of interest (ROIs) was found to be 18.1% to 23.5% in the non-exchanged cord, and 19.9% to 22.5% in the D2O-exchanged cord, with the highest density in the dorsal columns. The agreement of myelin density measurements between non-exchanged and D2O-exchanged cords supports the efficacy of tissue water suppression in white matter by adiabatic inversion-recovery with an appropriately-chosen TI.
Introduction
Most current MRI methods for quantification of myelin density use magnetization transfer (MT)1 or T2 relaxometry2. However, both methods exploit water’s chemical or magnetic interaction with the myelin matrix, rather than directly imaging myelin matrix 1H signal. Direct detection of myelin using solid-state imaging would remove the complications of indirect methods3, but is challenging due to the extremely short lifetime of the myelin matrix proton MR signal4, and is confounded by long-T2 tissue water signals5. In this work, the efficacy of long-T2 tissue water suppression by adiabatic inversion-recovery preparation is examined by imaging an ovine spinal cord specimen in native hydration and deuterium oxide (D2O)-exchanged states.Methods
Sample Preparation: Myelin was extracted from ovine spinal cord by the sucrose gradient technique6 and re-suspended in D2O to create reference samples of 6%, 8%, 10%, 12%, and 14% myelin (%w/w). Two more 36-mm segments of ovine cervical spinal cord were dissected from the same animal. One segment was stored in 12 mL of phosphate-buffered saline, while the other was serially immersed in three volumes of 12 mL D2O-saline each over the course of 72 hours, replacing all native (light) water in the tissue with D2O, which is invisible on 1H MRI, and thus effectively removing the confounding effects of tissue water on myelin 1H measurement.
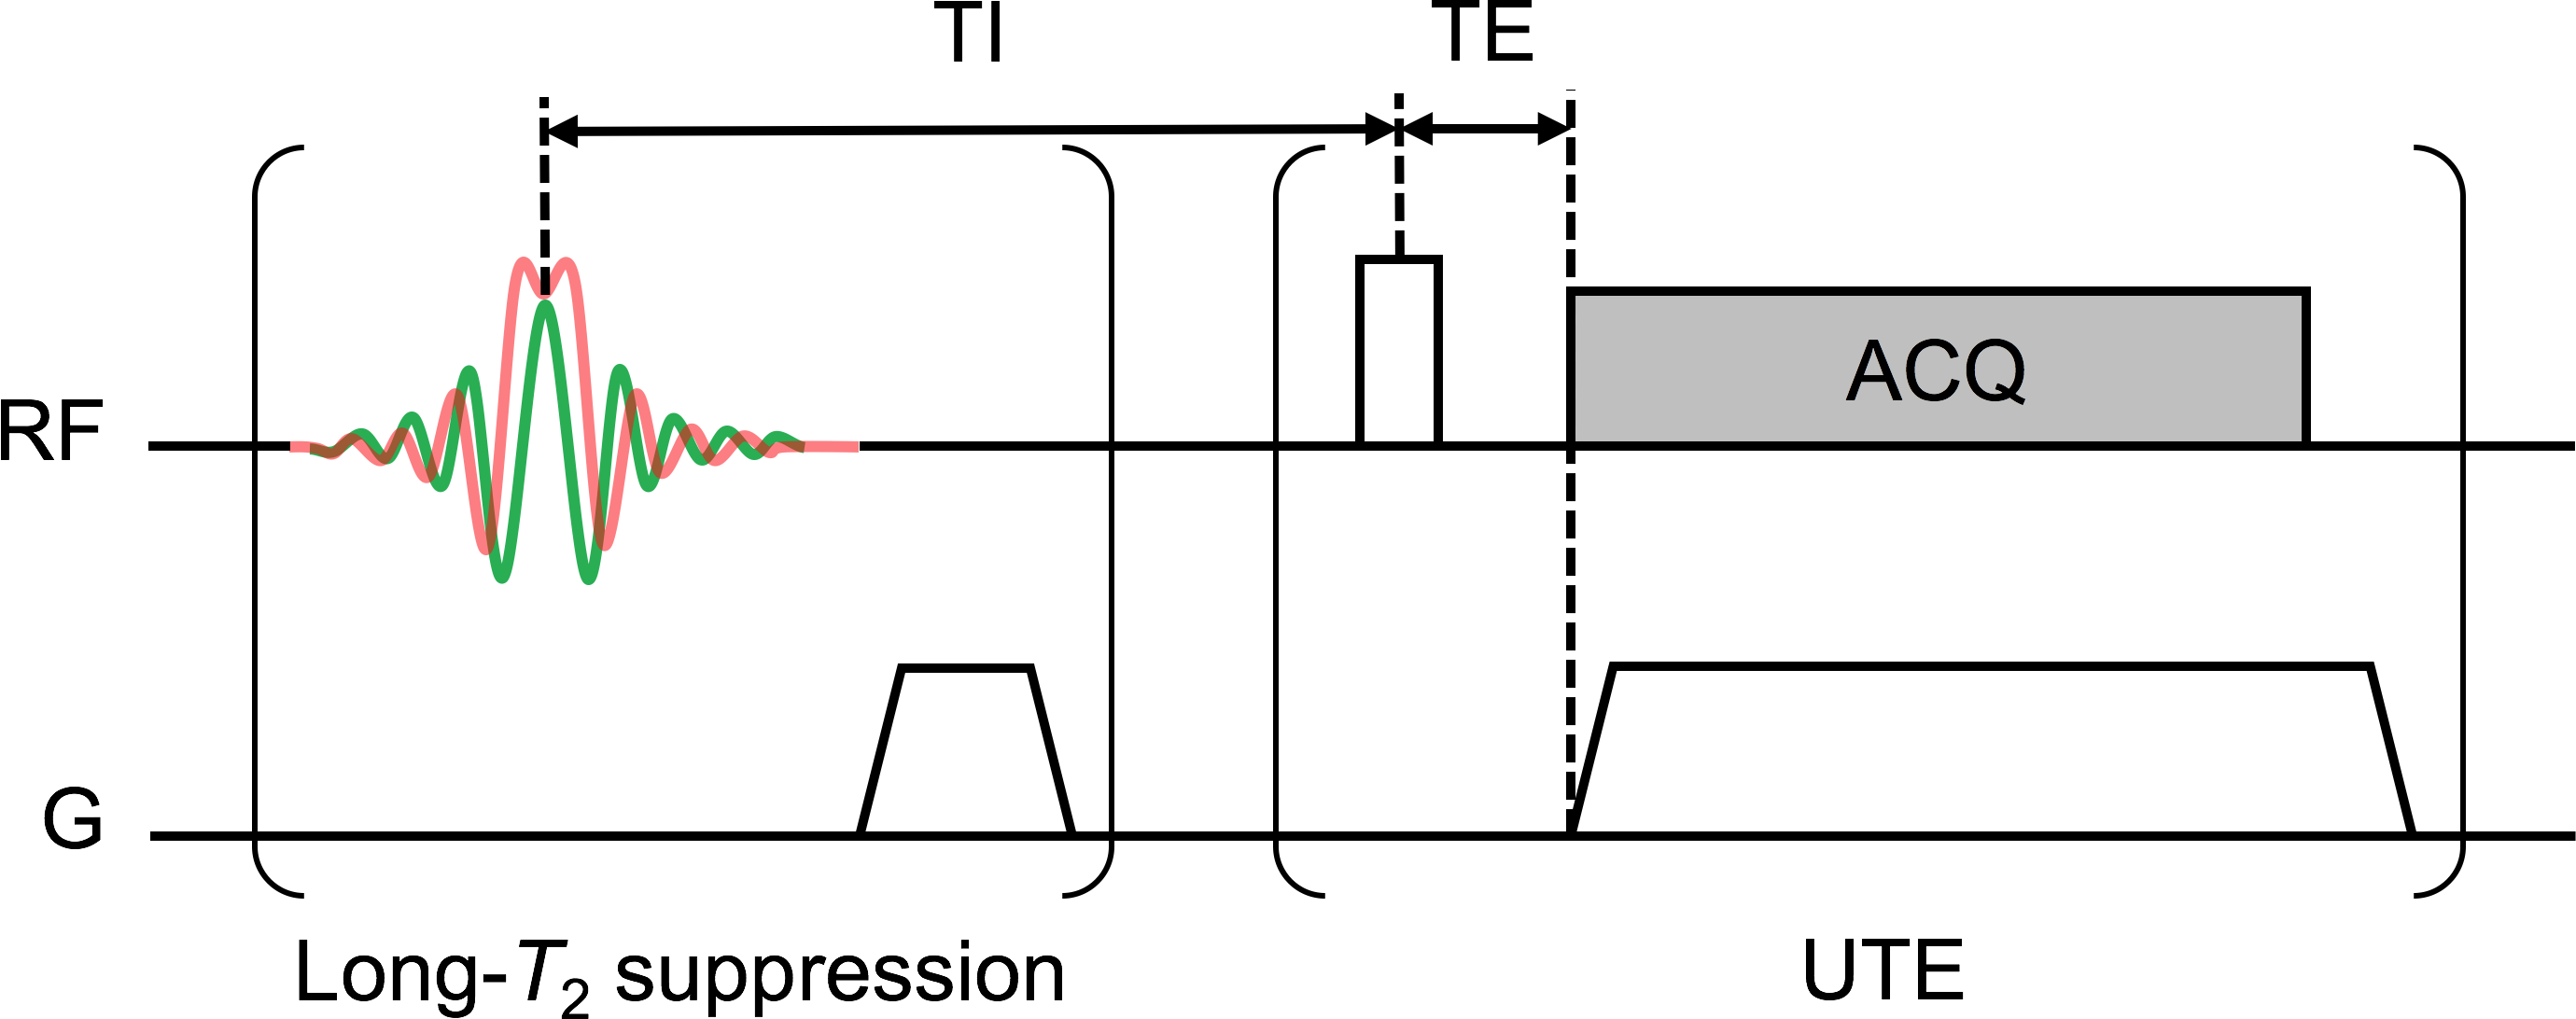
Imaging: Each specimen was scanned on a 9.4 T micro-imaging system with 1000 mT/m gradients (Avance III 400, Bruker, Billerica, MA) using an adiabatic inversion-recovery-prepared ultrashort echo-time (IR-UTE) pulse sequence (Fig. 1), along with the myelin reference samples. Each adiabatic inversion pulse inverts long-T2 magnetization (water) and saturates short-T2 magnetization (myelin). At an appropriate inversion time (TI), the inverted long-T2 magnetization passes through Mz=0, at which time a UTE imaging readout can be applied to selectively image short-T2 signal.
The following scan parameters were used: TR=200ms; TI=90ms; HS1 adiabatic inversion pulse, 5-kHz bandwidth, 5-ms pulse duration; excitation pulse duration=40µs, flip angle=50° (maximum power); 51360 half-projections (no undersampling); FOV=32×32×96mm3; voxel size=250×250×750µm3; scan time=3.1hr. The optimal TI was predicted by Bloch equation simulations and verified empirically.
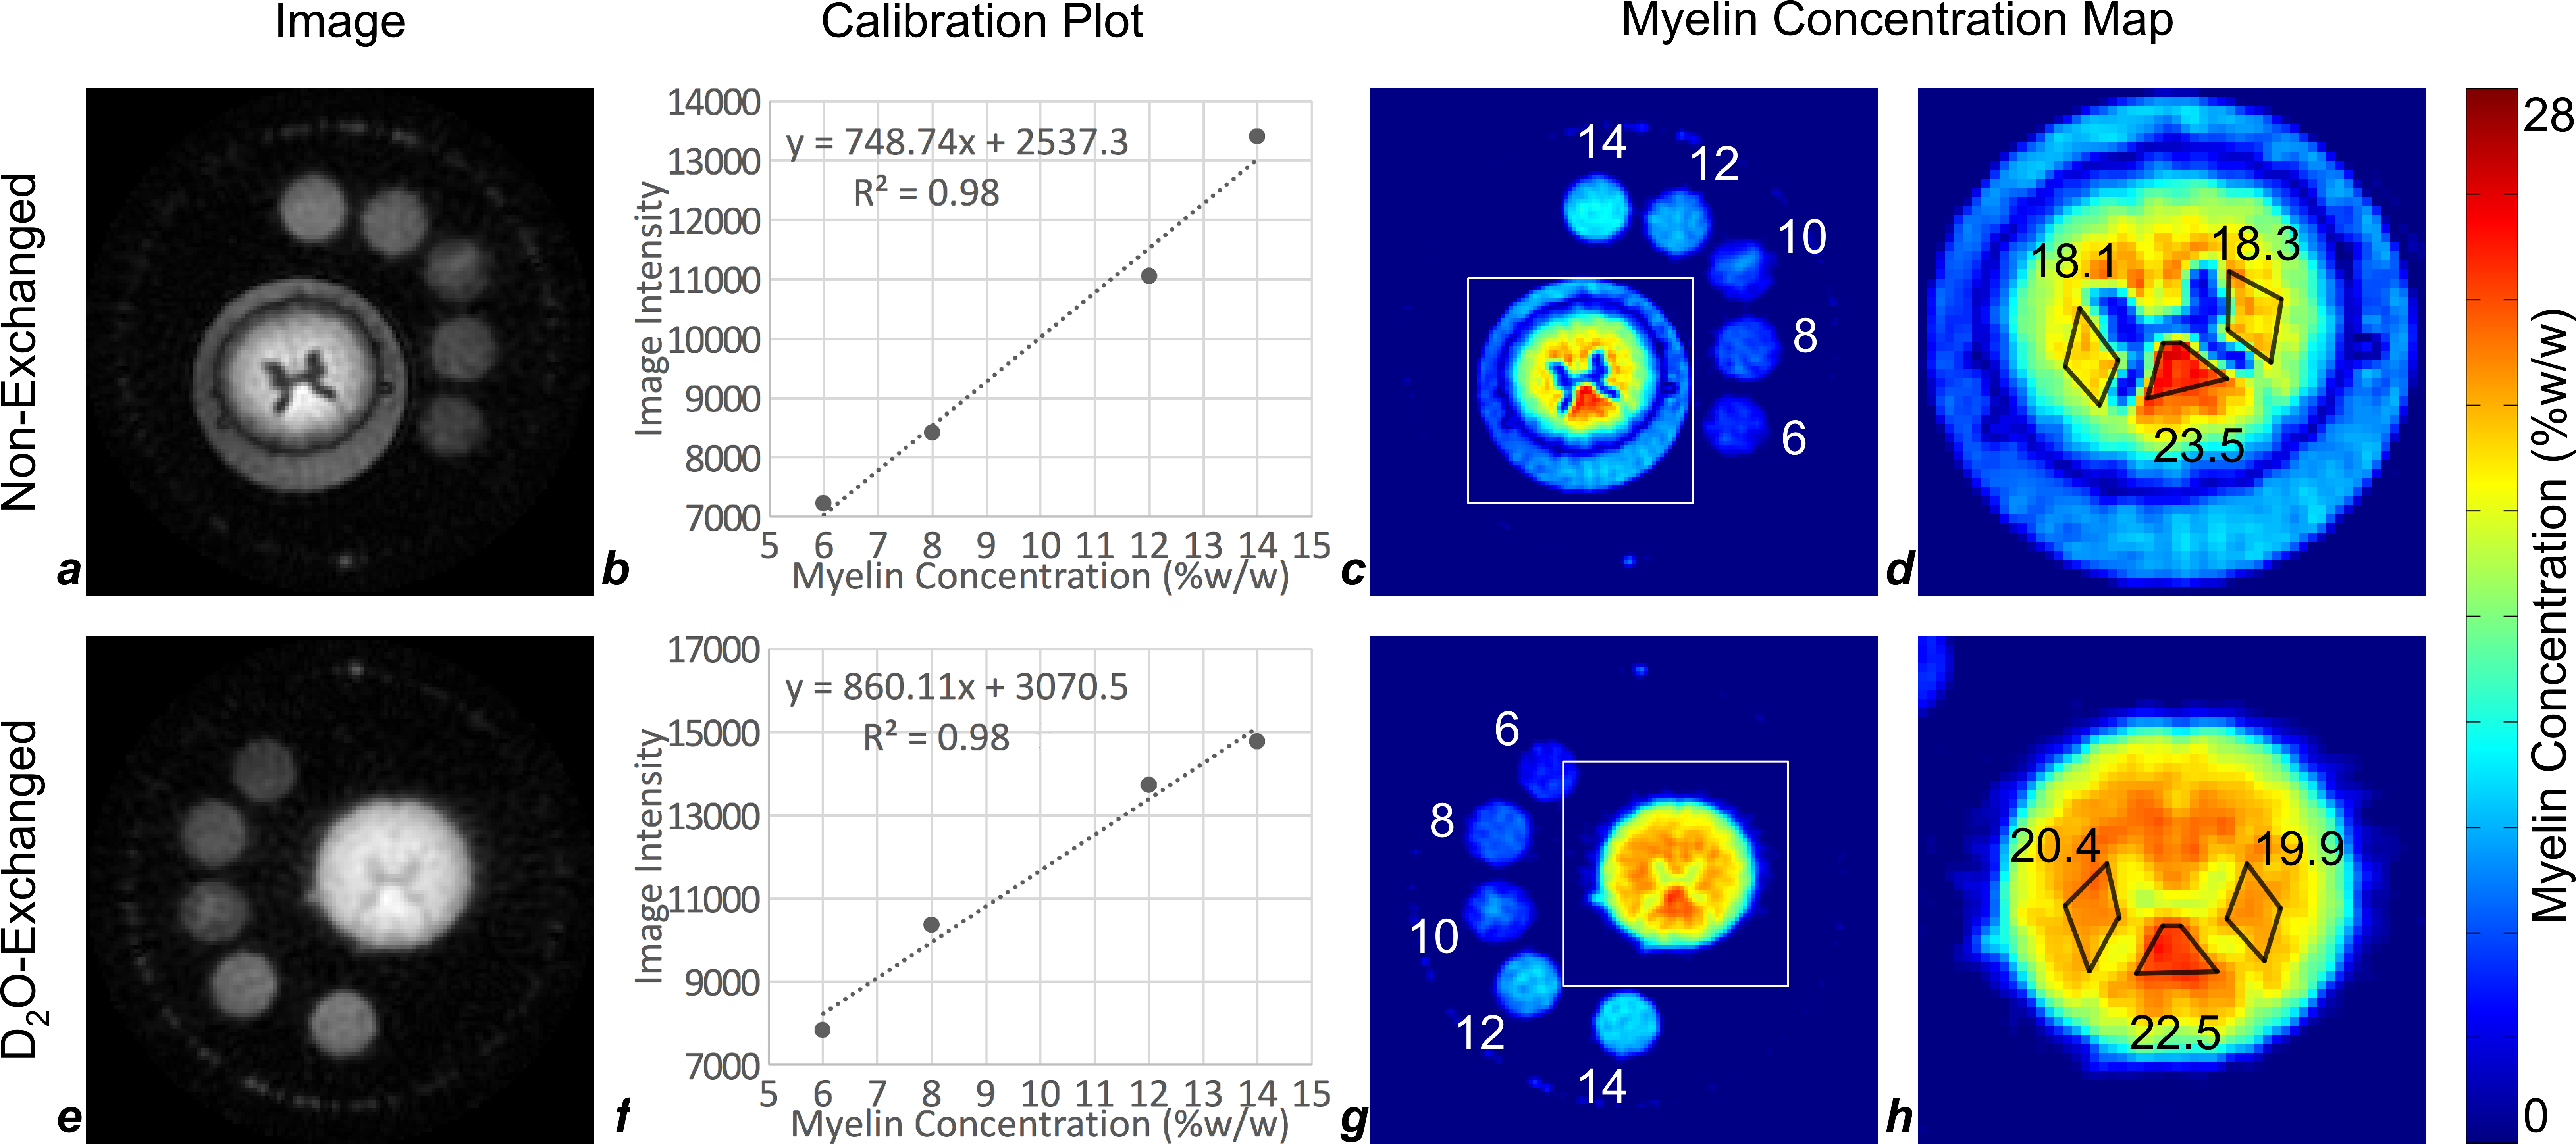
Analysis: After image reconstruction, myelin fractions in the spinal cord white matter were determined from a calibration equation derived from the association between MR signals of the reference samples and their known myelin fractions. The reference samples do not contain myelin proteins (which comprise about 30% of macromolecular volume in white matter7), while the intact spinal cord white matter does, so a correction factor of 0.7 was applied to the measured intensity in the spinal cord.
Results
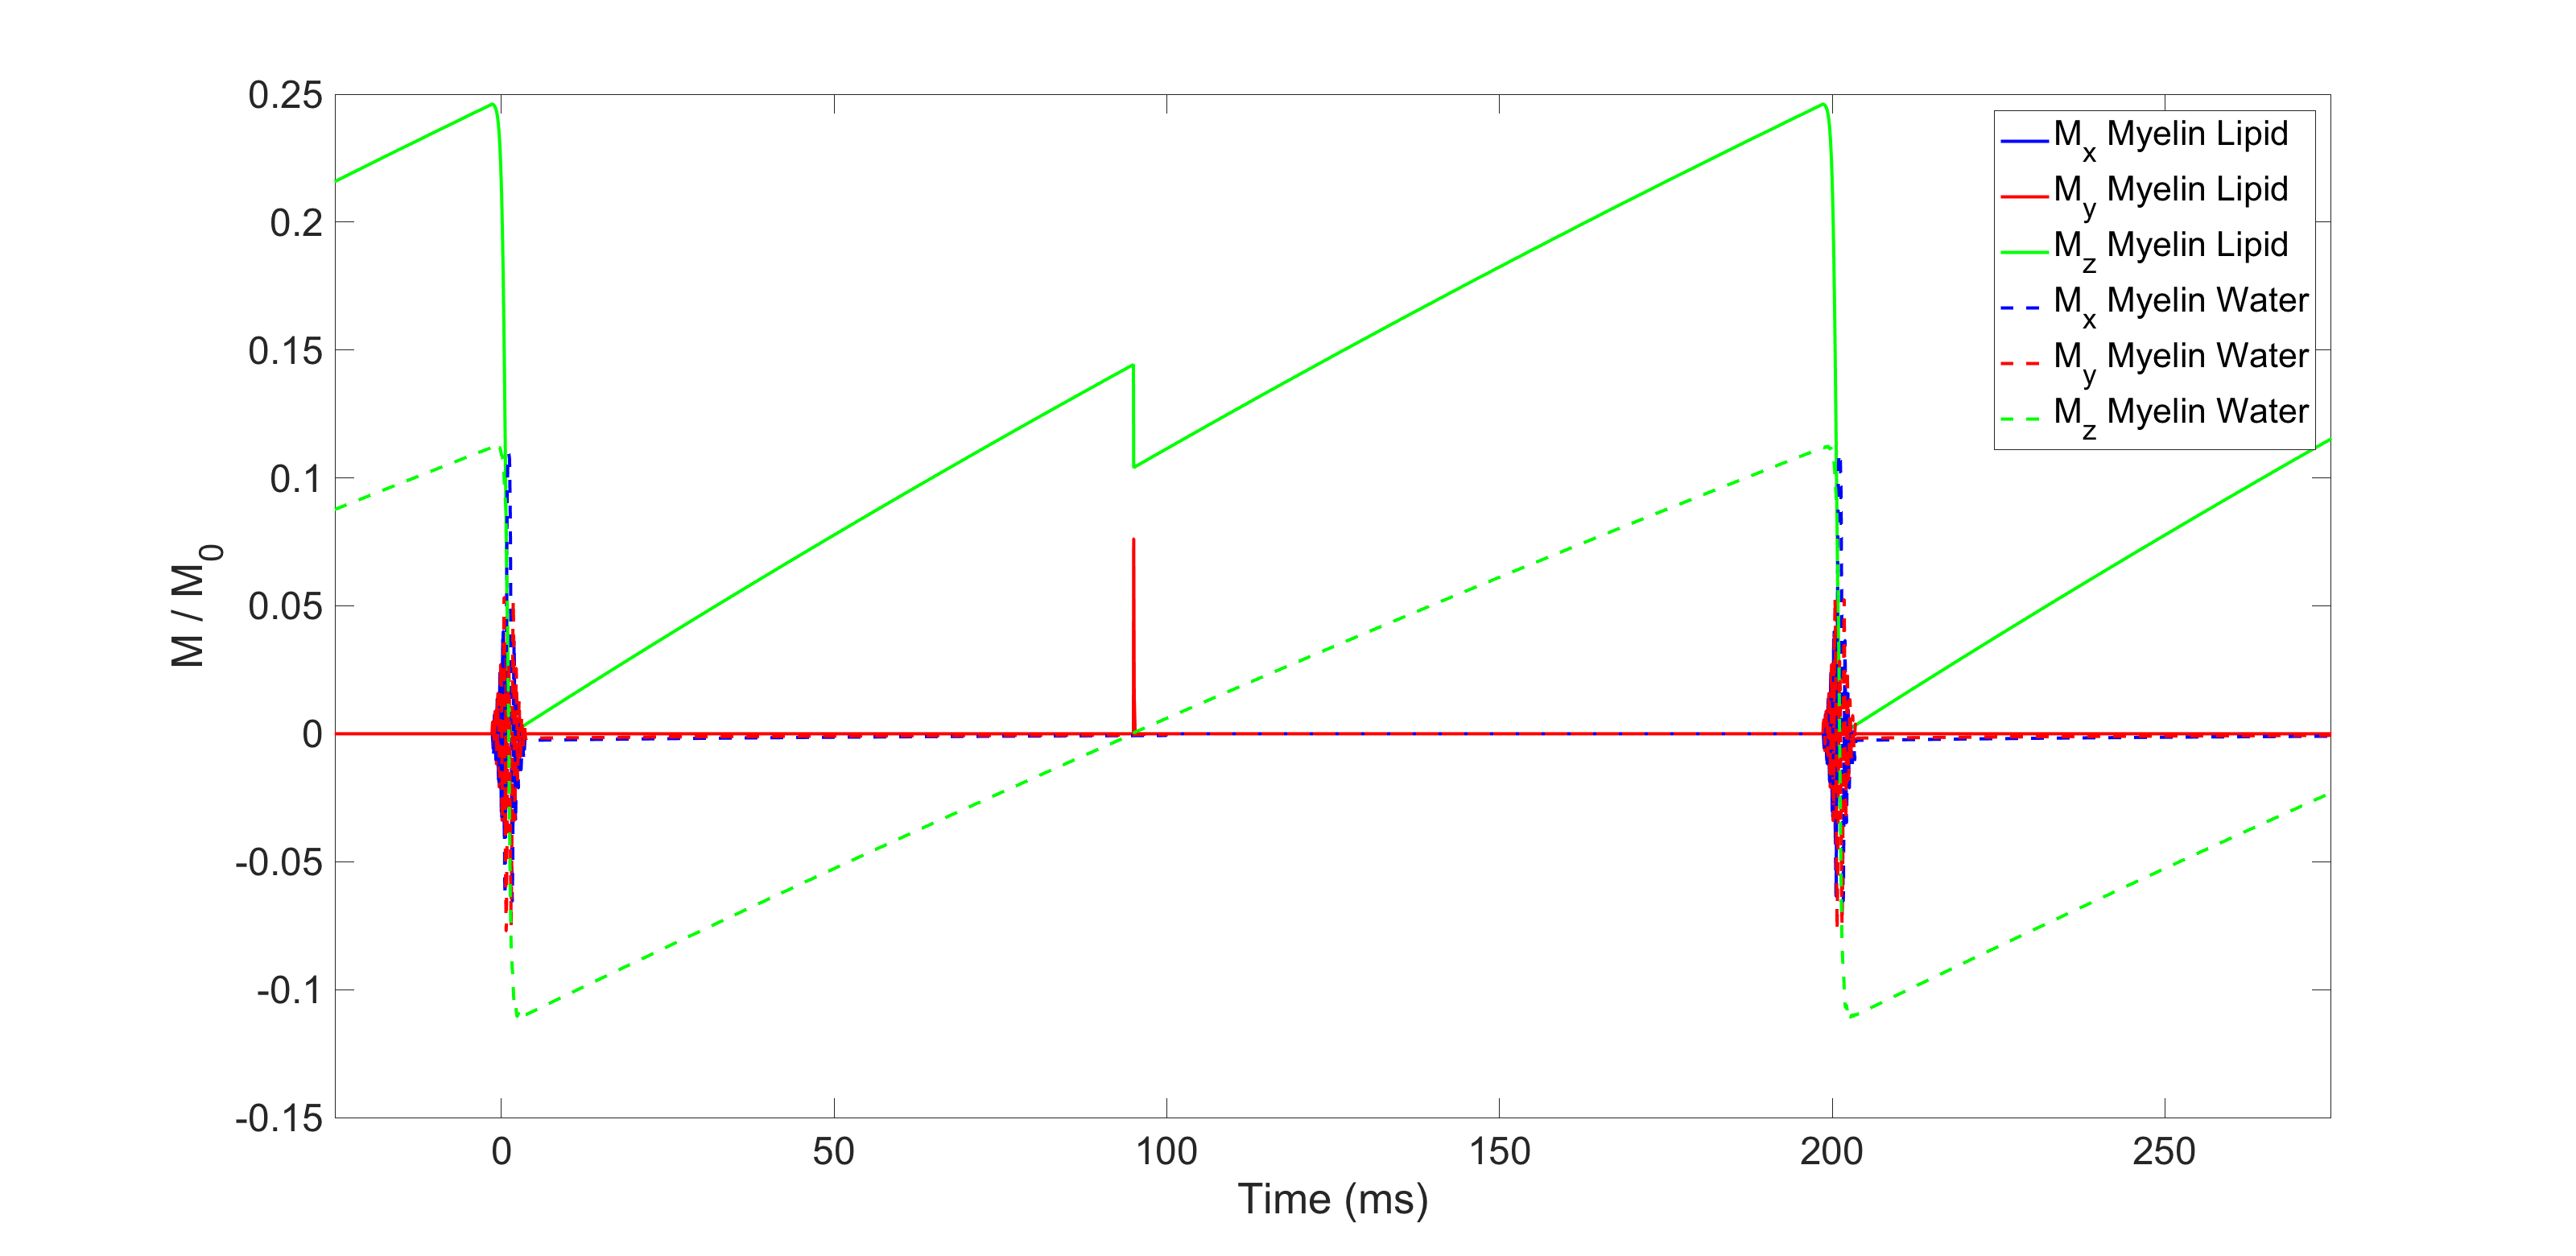
Bloch equation simulations of the steady-state signal predict an optimal TI=90ms for the aforementioned scan parameters (Fig. 2). The process of image-based quantification of white matter myelin density based on the acquired IR-UTE images is shown in Fig. 3. Myelin extract in the 10% reference sample had precipitated out of suspension and could not be re-suspended, and was therefore excluded from the calibration curve fit.
Myelin density in three white matter regions of interest (ROIs) was found to be 18.1% to 23.5% in the non-exchanged cord, and 19.9% to 22.5% in the D2O-exchanged cord, with the highest density in the dorsal columns.
Discussion
The agreement of myelin density measurements between non-exchanged and D2O-exchanged cords supports the efficacy of tissue water suppression in white matter by adiabatic inversion-recovery with an appropriately-chosen TI. The efficacy of long-T2 suppression, however, is sensitive to the composite T1 of tissue water. This dependence is visible in the different gray matter signal intensities between non-exchanged and D2O-exchanged cords (Figs. 3d, h) and in the residual bulk water outside the cord (Fig. 3d). TI can be tuned to suppress tissue water in healthy white matter; however, T1 is largely determined by cross-relaxation involving myelin8, so any reduction in myelin density (e.g. in the setting of disease) would require TI to be re-tuned, and precise quantification may not be achievable simultaneously in multiple tissues.
Non-myelin signal can also be attenuated by subtracting a second-echo image, which would be primarily composed of long-T2* signal, from a first-echo image containing both short-T2* myelin and long-T2* water signal. The choice of adiabatic inversion-recovery for this work is based on the sharper transition between T2 pass-band and stop-band, and the selectivity for T2, rather than T2*.
Conclusion
Appropriately designed adiabatic inversion-recovery preparation effectively suppresses long-T2 non-myelin signal in white matter. Myelin density maps in both non-exchanged and D2O-exchanged cords show the expected contrast between gray and white matter, and the densities measured in three regions of white matter are consistent between the non-exchanged and D2O-exchanged cords.Acknowledgements
This work was supported by the National Institutes of Health Grant R21-NS082953.References
[1] Schmierer, K., Scaravilli, F., Altmann, D.R., Barker, G.J., Miller, D.H. Magnetization transfer ratio and myelin in postmortem multiple sclerosis brain. Ann. Neurol. 2004;56:407-415.
[2] Whittall, K.P., MacKay, A.L., Graeb, D.A., Nugent, R.A., Li, D.K., Paty, D.W. In vivo measurement of T2 distributions and water contents in normal human brain. Magn Reson Med 1997;37:34-43.
[3] Wilhelm, M.J., Ong, H.H., Wehrli, S.L., Li, C., Tsai, P.H., Hackney, D.B., Wehrli, F.W. Direct magnetic resonance detection of myelin and prospects for quantitative imaging of myelin density. Proc Natl Acad Sci U S A 2016;109:9605-9610.
[4] Horch, R.A., Gore, J.C., Does, M.D. Origins of the ultrashort-T2 1H NMR signals in myelinated nerve: A direct measure of myelin content? Mag. Res. Med. 2011;66:24-31.
[5] Seifert A.C., Li C., Wilhelm M.J., Wehrli S.L., Wehrli F.W. Towards quantification of myelin by solid-state MRI of the lipid matrix protons. Neuroimage 2017;163:358-367.
[6] Norton, W.T. Isolation of myelin from nerve tissue. Methods Enzymol. 1974;31:435-444.
[7] Wessel, D., Flügge, U.I. A method for the quantitative recovery of protein in dilute solution in the presence of detergents and lipids. Anal. Biochem. 1984;138:141-143.
[8] Henkelman, R.M., Stanisz, G.J., Graham, S.J. Magnetization transfer in MRI: a review. NMR Biomed 2001;14:57-64.
Figures