0320
Accelerated quantitative susceptibility and R2* mapping with flexible k-t-segmented 3D-EPI1MR Physics, German Center for Neurodegenerative Diseases (DZNE), Bonn, Germany, 2Medical Physics Group, Institute of Diagnostic and Interventional Radiology, University Hospital Jena, Jena, Germany, 3Department of Neurology, Essen University Hospital, Essen, Germany, 4Erwin L. Hahn Institute for Magnetic Resonance Imaging, University Duisburg-Essen, Essen, Germany, 5Department of Physics and Astronomy, University of Bonn, Bonn, Germany
Synopsis
We introduce and demonstrate a novel “k-t-segmented” gradient echo 3D-EPI variant for motion-robust, rapid quantitative susceptibility and R2* mapping at 3T. The combination of a versatile 2D-CAIPIRINHA EPI sampling (“k-segmentation”) and two complementing multi-echo options (“t-segmentation”) provides maximum time- and SNR-efficiency by acquiring exactly as many k-space lines per echo time as fit to the required R2* sampling without compromising spatial resolution. Offline averaging of multiple, rapid measurements (here: 6 averages, 6 echo times from 6.5-31.5ms, 52s/average) following optional, retrospective correction for motion and B0 drift, yields excellent quantitative whole-brain maps at 0.8mm isotropic resolution acquired in approximately 5 minutes.
INTRODUCTION
Quantitative Susceptibility Mapping (QSM) and R2* mapping are important tools to locally characterize the iron distribution in deep gray matter, or changes of myelination in a quantitative and non-invasive manner1–5. In particular elderly subjects require motion-insensitive MRI methods to acquire high-resolution gradient echo (GRE) MRI data. Recently, this problem has been approached by employing 2D-6 or 3D7 echo-planar imaging (EPI) for QSM. However, despite strong parallel imaging acceleration along the primary phase encode direction (PE1), both spatial resolution and sampling of the R2* signal decay have thus far been limited by the EPI echo train length (ETL). We demonstrate a novel 3D-EPI sequence variant that features versatile 2D-CAIPIRINHA8 sampling (“k-segmentation”) and two complementing multi-echo options (“t-segmentation”) on the example of a 5 minute, 0.8mm isotropic whole-brain protocol with six echo times at 3T.METHODS
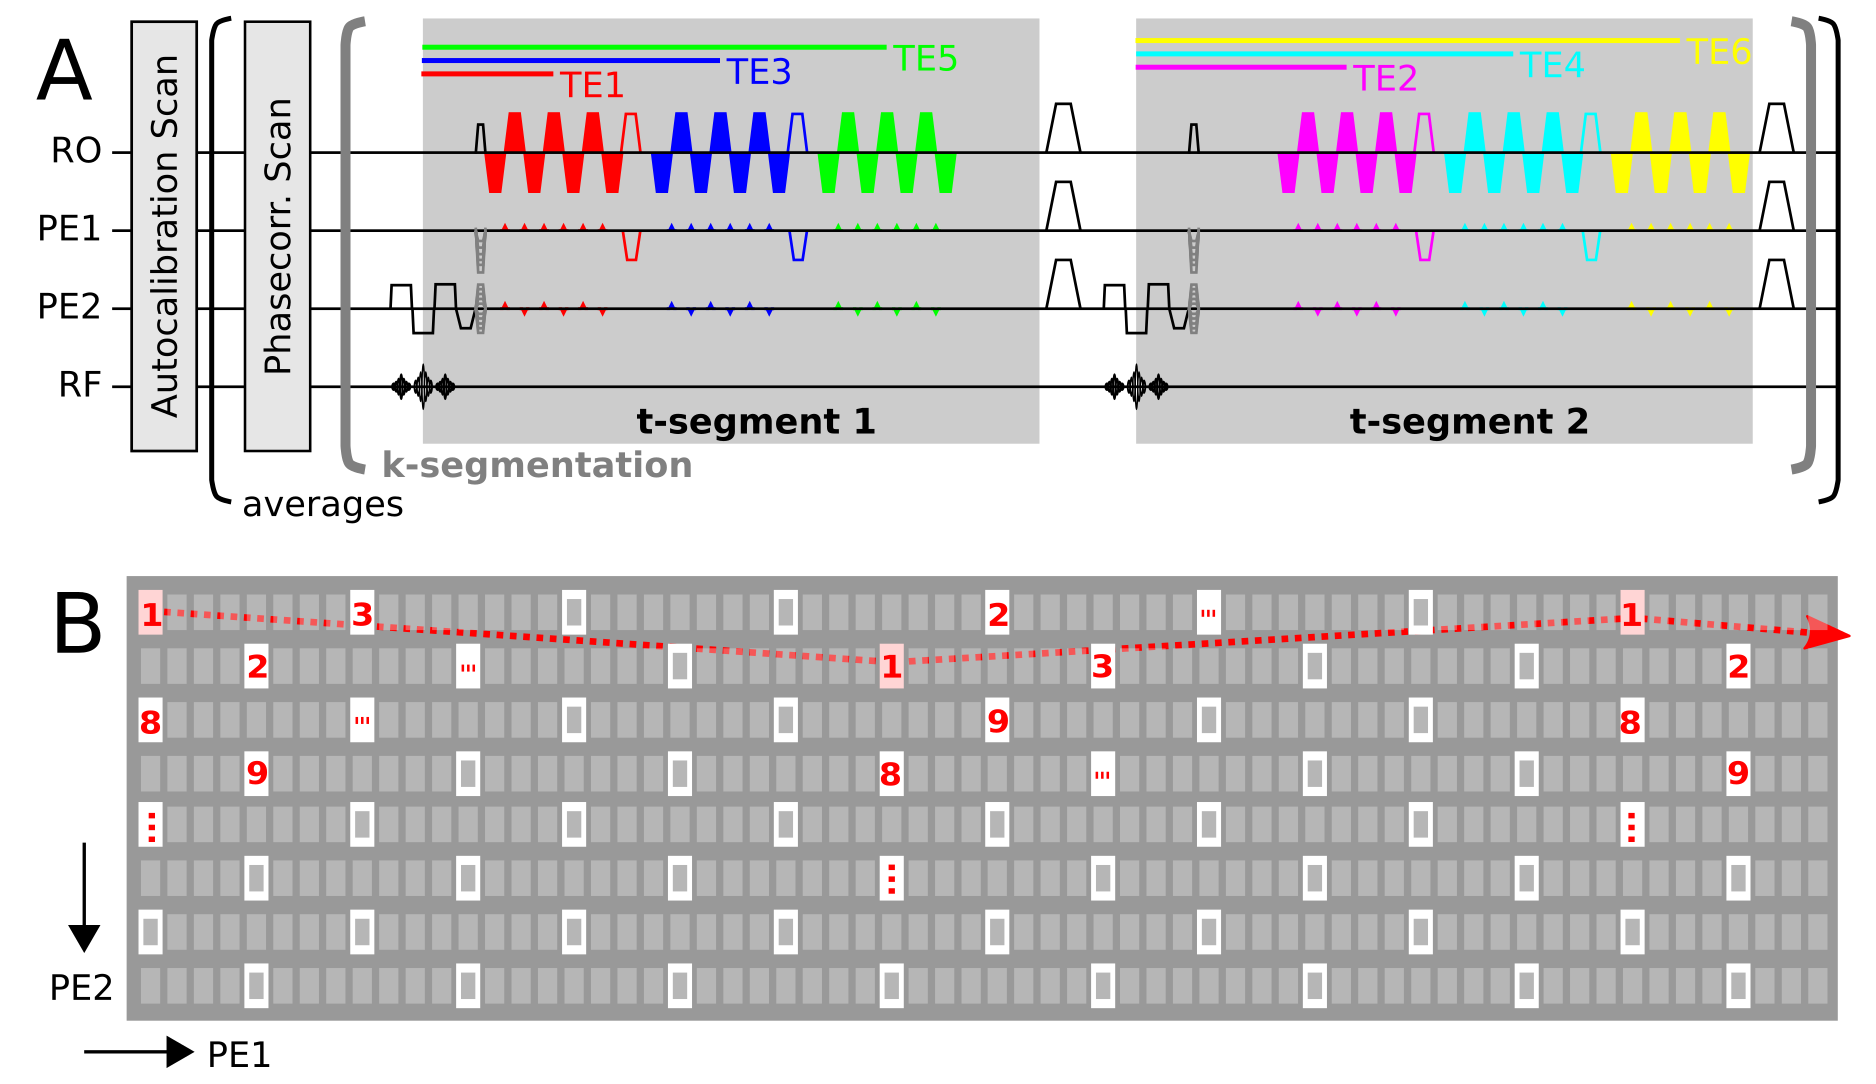
A gradient-echo 3D-EPI sequence9,10 was extended by “true” multi-echo capability and an additional option to achieve a finer TE spacing than given by the ETL (Fig. 1A). In extension to traditional segmentation along the secondary phase encode direction (PE2), a flexible 2D-CAIPIRINHA k-segmentation of the EPI trajectory (Fig. 1B) was implemented to decouple the ETL from spatial resolution. Further vital modifications were: binomial-121 water excitation instead of typical fat-saturation, and performing only one EPI phase correction scan prior to each volume acquisition (minimize first TE). The following whole-brain protocol was performed on a MAGNETOM Prisma 3T scanner (Siemens, 80mT/m gradients, 64-channel head-neck coil, complex coil combination using body-coil as reference, online 2D-GRAPPA reconstruction): 264x264x176 matrix, 0.8mm isotropic, TE1-6=[6.5, 11.5, 16.5, 21.5 26.5, 31.5]ms (odd-numbered TEs acquired first), CAIPIRINHA 4x2(shift=1), partial Fourier 6/8x1, k-/t-segmentation: 7/2, 1.2ms echo spacing, 15° flip angle, TRvol=26s (52s for all TEs), 6 averages, TA=5:25min (incl. 13s preparation and FLASH autocalibration scans11).
Offline averaging of the complex images allows for retrospective motion correction (or scrubbing in case of excessive motion) and to correct for a B0 drift over time. The latter was done here using the voxel-wise autocorrelation method12 across all averages to estimate a temporal field slope. Following complex averaging, an optional adaptive non-local means (NLM) denoising filter13 was applied to the corresponding real and imaginary parts.
Monoexponential R2* maps have been computed via linear fitting of the logarithm of the averaged magnitude images according to TE1-6. The averaged phase maps have been unwrapped14, divided by 2πTE and summarized to a single frequency map using optimized weights15. The frequency map was corrected for background contributions using V-SHARP16,17 and supplied to homogeneity enabled incremental dipole inversion (HEIDI)18 to reveal quantitative susceptibility maps.
RESULTS
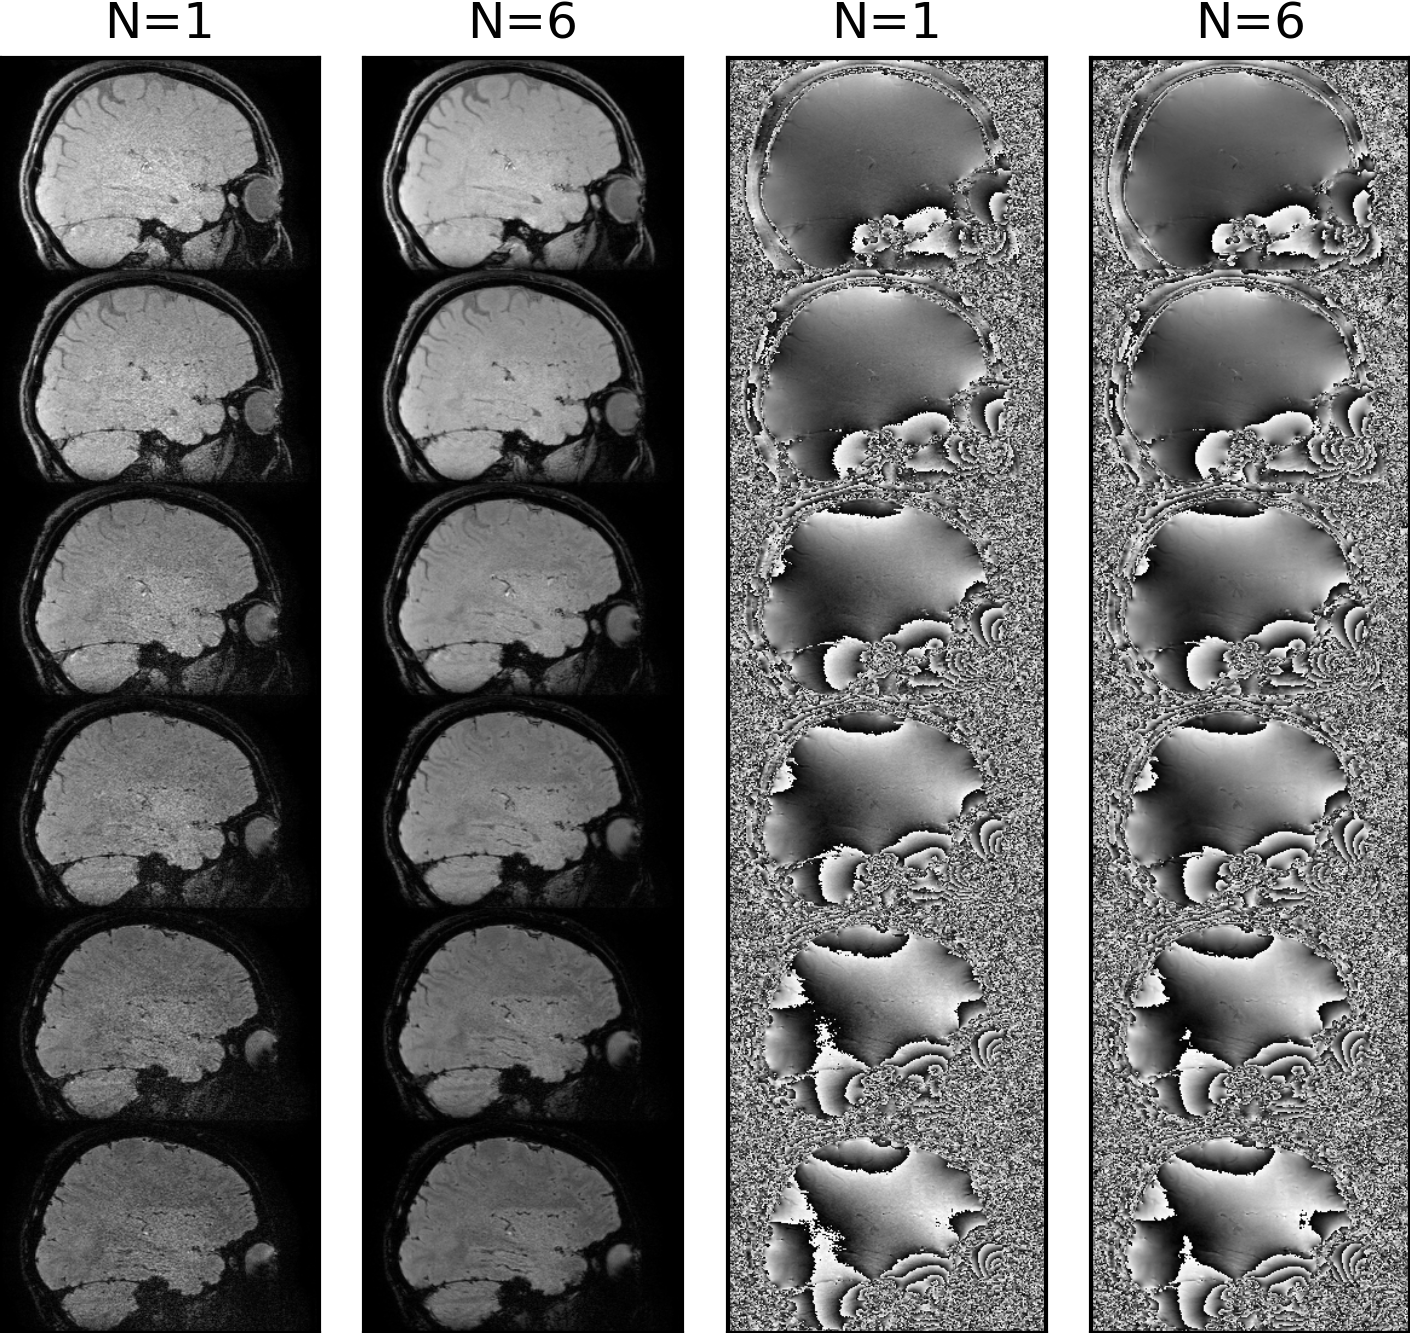
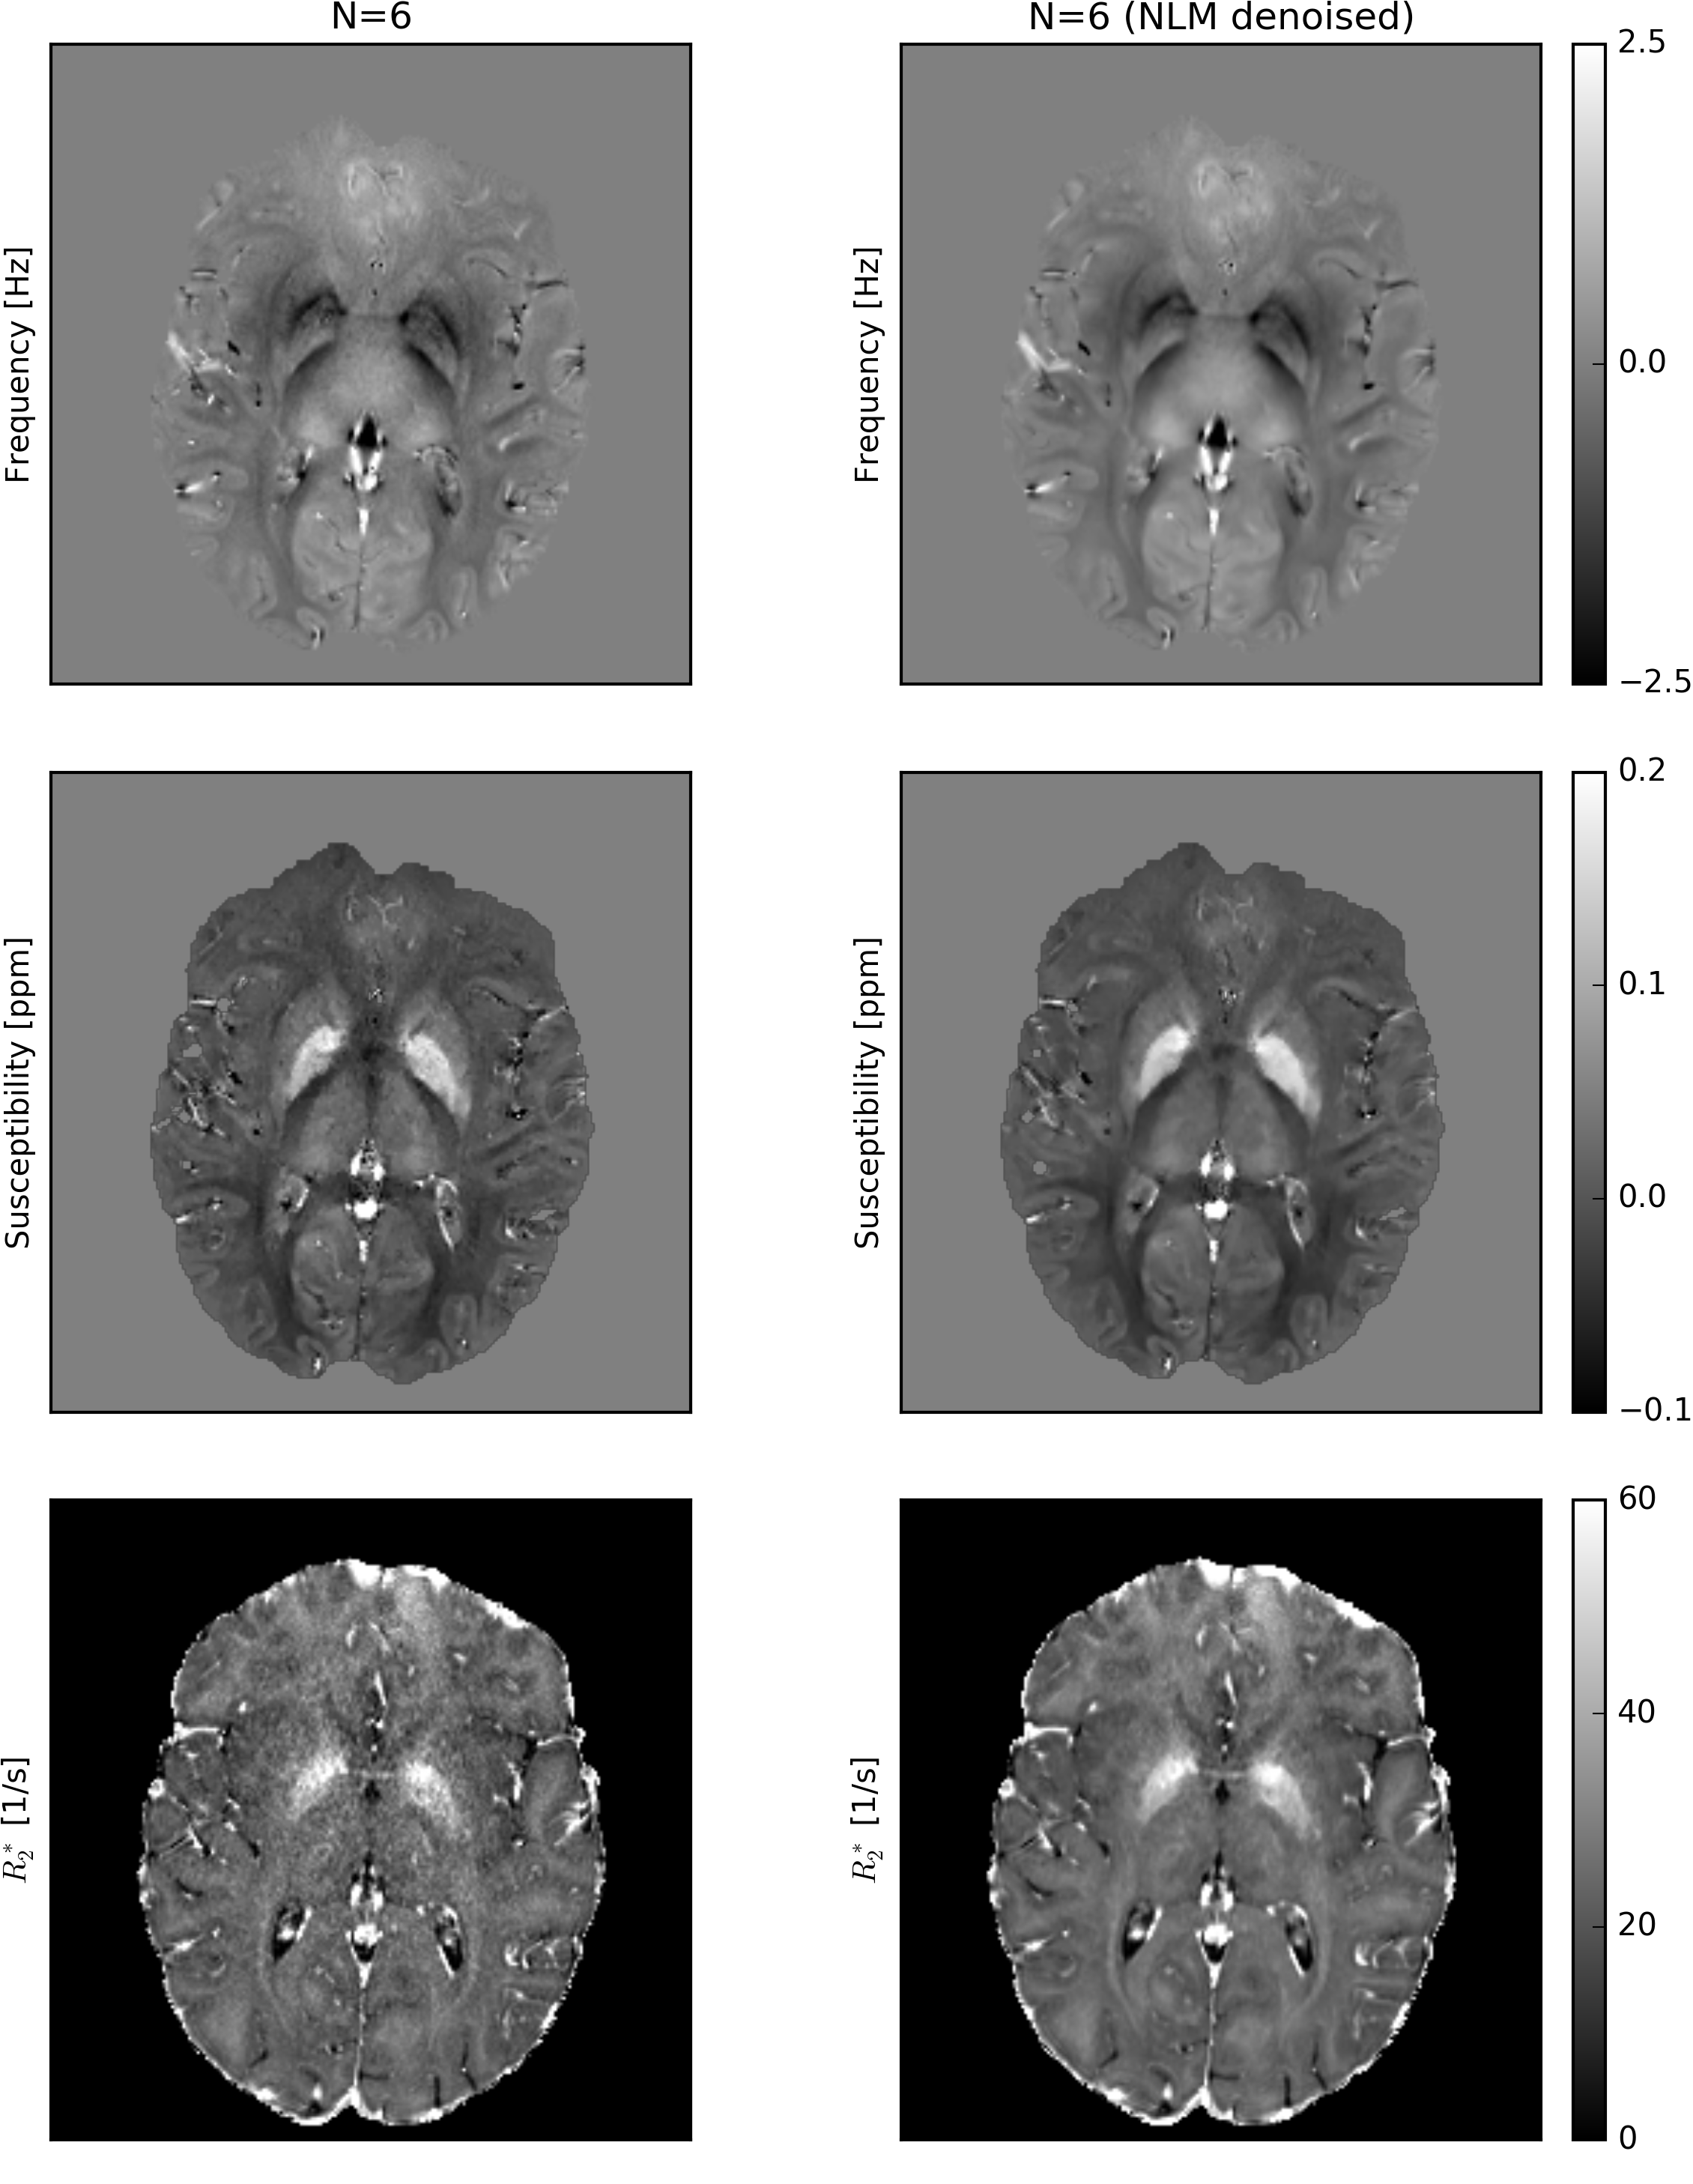
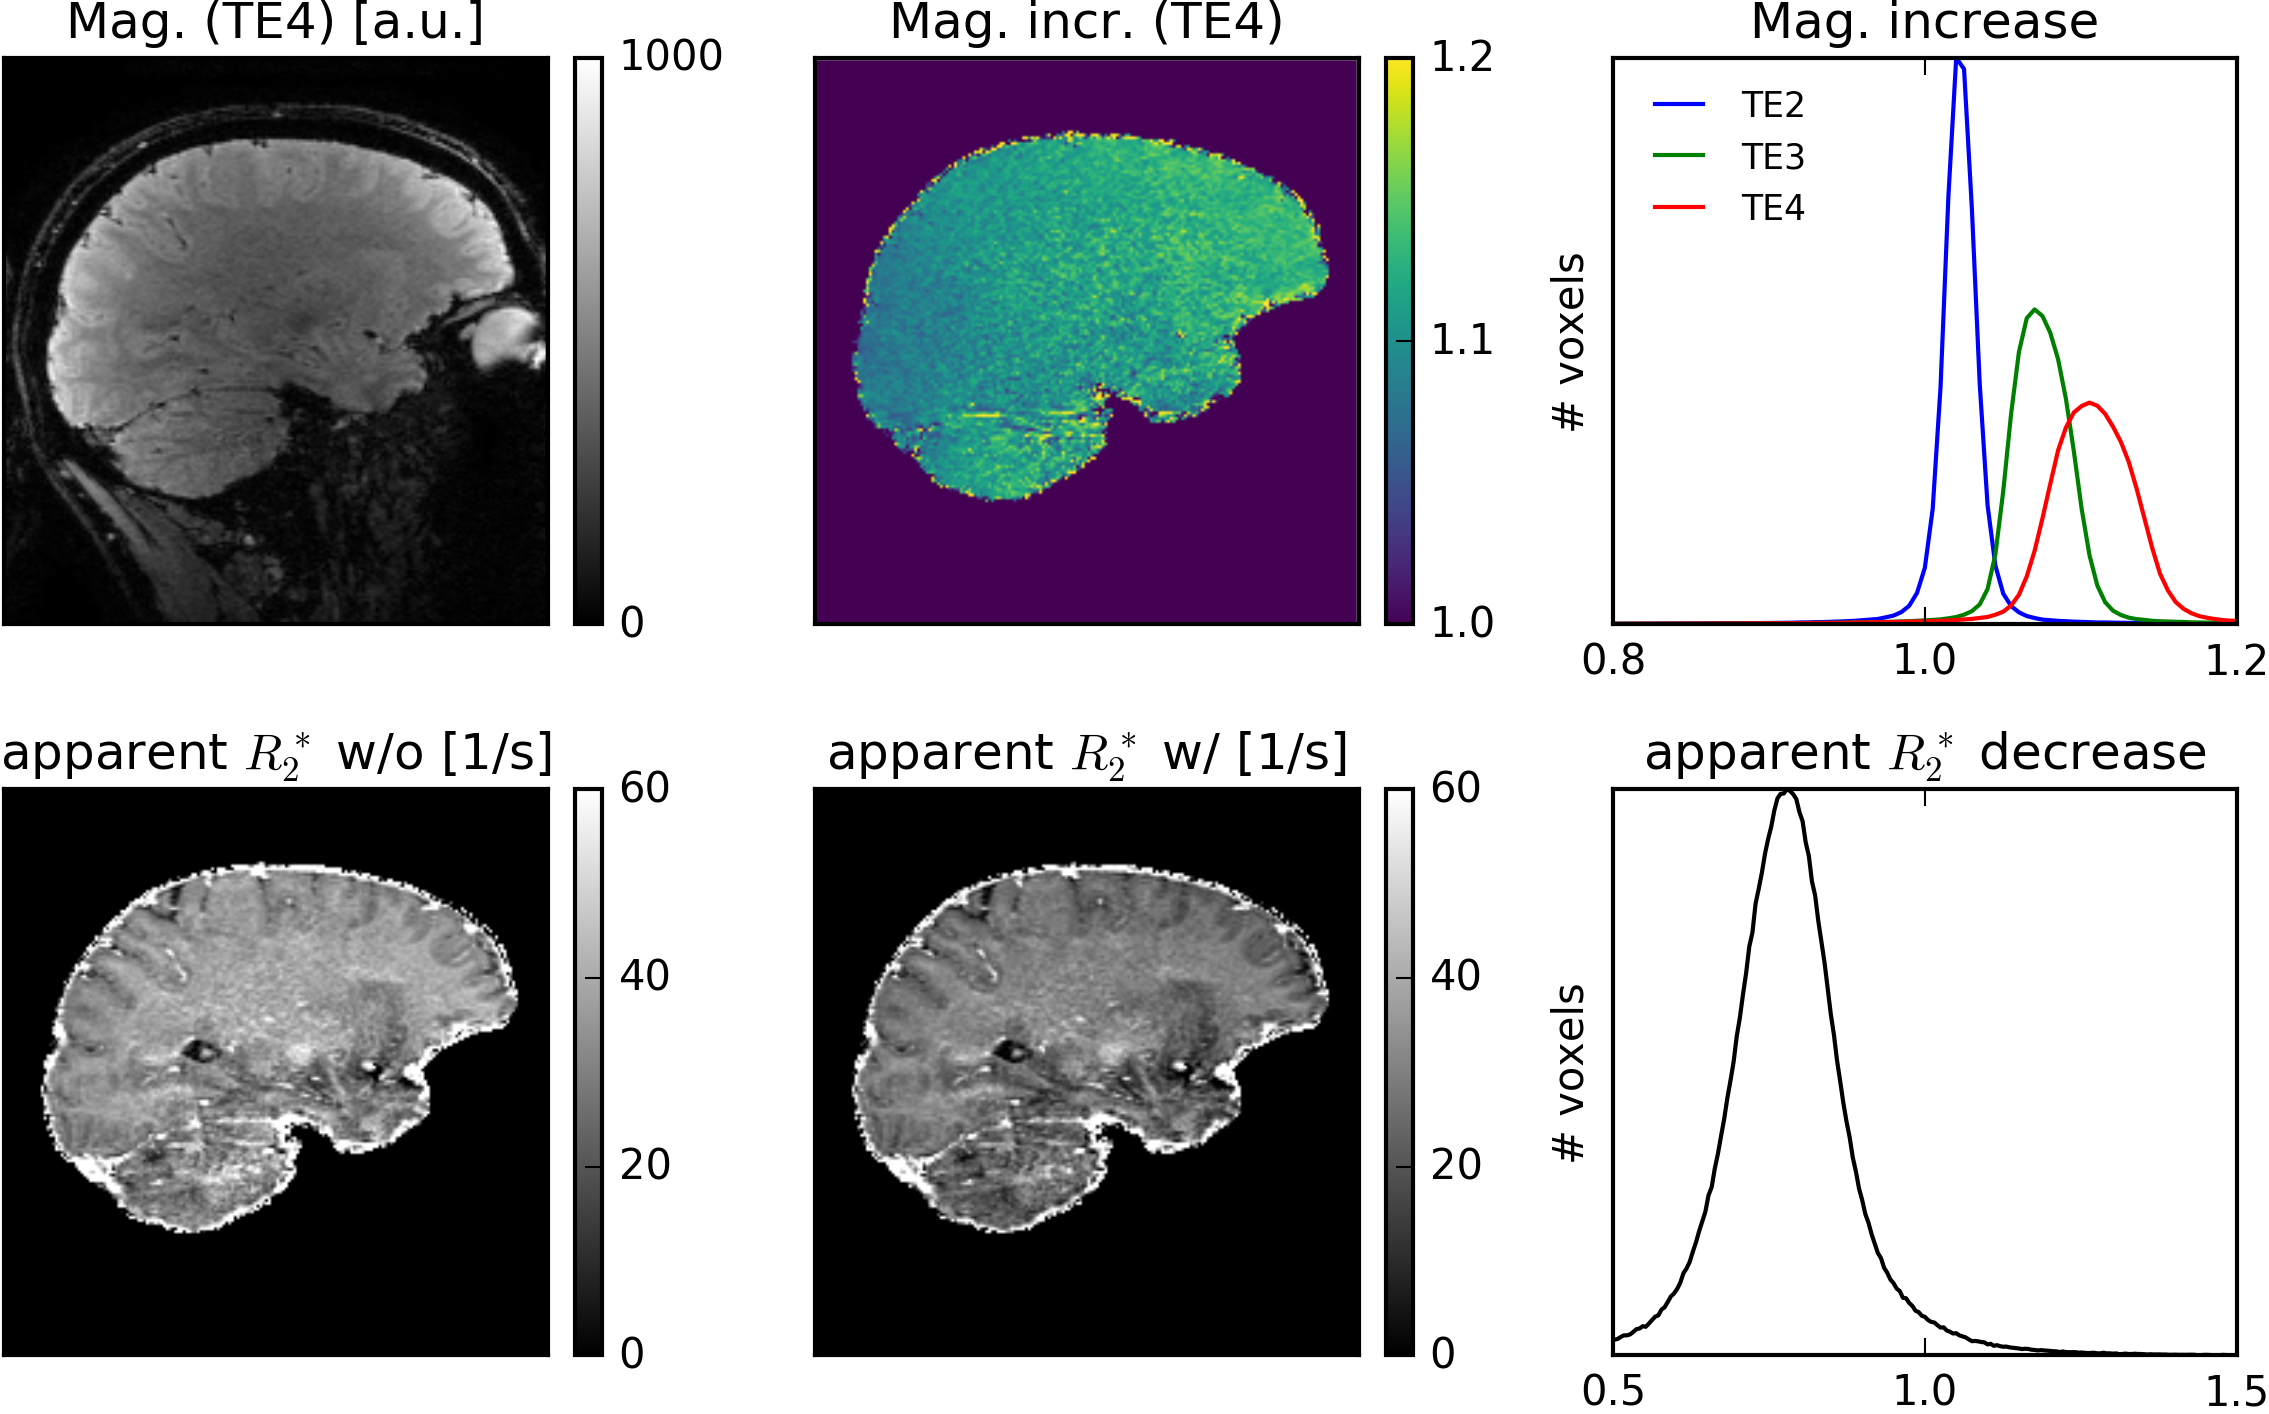
Fig. 2 shows the first magnitude and phase images of the first measurement (N=1) and the corresponding average images across all measurements (N=6) for all TEs. Corresponding QSM and R2* maps without and with NLM denoising are displayed in Fig. 3. Fig. 4 illustrates R2* maps without and with B0 drift correction prior to complex averaging on an example of a comparable, 1mm isotropic acquisition with 4 TEs performed on a MAGNETOM Skyra 3T scannerDISCUSSION
The results demonstrate feasibility of rapid QSM and R2* mapping using the proposed (k-t-segmented) multi-echo 3D-EPI sequence. Relatively decent signal-to-noise ratio (SNR) of a single acquisition (26s per TE1,3,5 or TE2,4,6) is significantly increased by complex offline averaging (Fig. 2). Owing to the 4x2(shift=1) CAIPIRINHA sampling and the 52 head-receive-elements used, only a moderate g-factor SNR penalty is observed. However, trading a reduced g-factor (e.g. by 3x2(shift=1) undersampling and 8/6-fold increased k-segmentation for unchanged ETL=7) versus fewer averages and increased motion sensitivity may be a viable choice. Geometric distortions and chemical shift artifacts (effective PE1 bandwidth ~120-130Hz/pixel) are not greater than with a typical GRE QSM protocol (similar readout bandwidth). While excellent susceptibility maps have been obtained from the raw averaged data, the R2* maps benefit clearly from NLM denoising (Fig. 3). In particular long TE acquisitions benefit from the B0 drift correction before averaging, which results in more accurate R2* estimation (Fig. 4).CONCLUSION
We have proposed a novel k-t-segmented 3D-EPI variant that may alternatively be regarded as a “t-segmented” 3D-GRE sequence with 2D-CAIPIRINHA sampling and EPI-factor. In either case, the segmented EPI-trajectory along a 2D-CAIPIRINHA sampling pattern (k-segmentation) as well as the two complementing multi-echo options (t-segmentation) have increased the degrees-of-freedom significantly to realize motion-robust, time- and SNR-efficient whole-brain MRI protocols for high quality susceptibility and R2* mapping in high isotropic resolution at 3T. Future applications will explore higher spatial resolutions and different contrasts to expand the space of quantifiable parametersAcknowledgements
No acknowledgement found.References
1 Deistung A, Schweser F, Reichenbach JR. Overview of quantitative susceptibility mapping. NMR Biomed 2016;(May). https://doi.org/10.1002/nbm.3569.
2 Sati P, Gelderen P van, Silva AC, Reich DS, Merkle H, De Zwart JA et al. Micro-compartment specific T2* relaxation in the brain. Neuroimage 2013;77:268–78. https://doi.org/10.1016/j.neuroimage.2013.03.005.
3 Liu C, Li W, Johnson GA, Wu B. High-field (9.4T) MRI of brain dysmyelination by quantitative mapping of magnetic susceptibility. Neuroimage 2011;56(3):930–8. https://doi.org/10.1016/j.neuroimage.2011.02.024.
4 Langkammer C, Krebs N, Goessler W, Scheurer E, Ebner F, Yen K et al. Quantitative MR Imaging of Brain Iron: A Postmortem Validation Study. Radiology 2010;257(2):455–62. https://doi.org/10.1148/radiol.10100495.
5 Langkammer C, Schweser F, Krebs N, Deistung A, Goessler W, Scheurer E et al. Quantitative susceptibility mapping (QSM) as a means to measure brain iron? A post mortem validation study. Neuroimage 2012;62(3):1593–9. https://doi.org/10.1016/j.neuroimage.2012.05.049.
6 Sun H, Wilman AH. Quantitative susceptibility mapping using single-shot echo-planar imaging. Magn Reson Med 2014;00:1–7. https://doi.org/10.1002/mrm.25316.
7 Langkammer C, Bredies K, Poser Ba, Barth M, Reishofer G, Fan AP et al. Fast quantitative susceptibility mapping using 3D EPI and total generalized variation. Neuroimage 2015;111:622–30. https://doi.org/10.1016/j.neuroimage.2015.02.041.
8 Breuer FA, Blaimer M, Mueller MF, Seiberlich N, Heidemann RM, Griswold MA et al. Controlled aliasing in volumetric parallel imaging (2D CAIPIRINHA). Magn Reson Med 2006;55(3):549–56. https://doi.org/10.1002/mrm.20787.
9 Poser BA, Koopmans PJ, Witzel T, Wald LL, Barth M. Three dimensional echo-planar imaging at 7 Tesla. Neuroimage 2010;51(1):261–6. https://doi.org/10.1016/j.neuroimage.2010.01.108.
10 Stirnberg R, Huijbers W, Brenner D, Poser BA, Breteler M, Stöcker T. Rapid whole-brain resting-state fMRI at 3 Tesla: Efficiency-optimized three-dimensional EPI versus repetition time-matched simultaneous-multi-slice EPI. Neuroimage 2017;163(August):81–92. https://doi.org/10.1016/j.neuroimage.2017.08.031.
11 Ivanov D, Barth M, Uludağ K, Poser BA. Robust ACS
acquisition for 3D echo planar imaging.
In Proc Intl Soc Mag Reson Med 23, 2015
12 Ahn CB, Cho ZH. A new phase correction method in NMR imaging based on autocorrelation and histogram analysis. IEEE Trans Med Imaging 1987;6(1):32–6. https://doi.org/10.1109/TMI.1987.4307795.
13 Manjón JV, Coupé P, Martí-Bonmatí L, Collins DL, Robles M. Adaptive non-local means denoising of MR images with spatially varying noise levels. J Magn Reson Imaging 2010;31(1):192–203. https://doi.org/10.1002/jmri.22003.
14 Abdul-Rahman HS, Gdeisat M a, Burton DR, Lalor MJ, Lilley F, Moore CJ. Fast and robust three-dimensional best path phase unwrapping algorithm. Appl Opt 2007;46(26):6623–35. https://doi.org/10.1364/AO.46.006623.
15 Wu B, Li W, Avram AV, Gho SM, Liu C. Fast and tissue-optimized mapping of magnetic susceptibility and T2* with multi-echo and multi-shot spirals. Neuroimage 2012;59(1):297–305. https://doi.org/10.1016/j.neuroimage.2011.07.019.
16 Schweser F, Deistung A, Lehr BW, Reichenbach JR. Quantitative imaging of intrinsic magnetic tissue properties using MRI signal phase: An approach to in vivo brain iron metabolism? Neuroimage 2011;54(4):2789–807. https://doi.org/10.1016/j.neuroimage.2010.10.070.
17 Wu B, Li W, Guidon A, Liu C. Whole brain susceptibility mapping using compressed sensing. Magn Reson Med 2012;67(1):137–47. https://doi.org/10.1002/mrm.23000.
18 Schweser F, Sommer K, Deistung A, Reichenbach JR. Quantitative susceptibility mapping for investigating subtle susceptibility variations in the human brain. Neuroimage 2012;62(3):2083–100. https://doi.org/10.1016/j.neuroimage.2012.05.067.
Figures