0318
Evaluation of a wave-MPRAGE sequence for brain morphometery1Center for Brain Science, Harvard University, Cambridge, MA, United States, 2AA Martinos Center for Biomedical Imaging, Massachusetts General Hospital, Charlestown, MA, United States, 3Department of Psychology, Harvard University, Cambridge, MA, United States, 4Department of Psychiatry, Massachusetts General Hospital, Charlestown, MA, United States
Synopsis
A new readout method for 3D scans, wave-CAIPI, with low g-factor characteristics that enable high degrees of acceleration, can reduce the scan time for a 1.0 mm MPRAGE to under 90 seconds. We have validated the morphometrics from this rapid wave-MPRAGE with those from conventional MPRAGE scans. The wave-MPRAGE sequence produces a lower-SNR image of the brain, but surfaces created from the wave images match those from the conventional scans well. In morphometric data, a bias is seen toward the conventional MPRAGE scans in average cortical thickness and estimated total intra-cranial volume, however values for total brain volume are similar.
Introduction
Automated MRI-derived measurements of human brain volumes from anatomical scans provide novel insights into normal and abnormal neuroanatomy. However, traditionally, these scans have taken 6-10 minutes to acquire, often being repeated in the case of subject motion, or as a precaution against motion. Our group has studied morphometric results from shorter scans employing lower resolution and/or higher in-plane acceleration1-3, however conventional in-plane acceleration (GRAPPA) has decreasing time-benefits above 4-fold acceleration, while drastically reducing image SNR due to g-factor noise amplification. In recent times, a new readout method for 3D Cartesian scans has been developed. Known generally as wave-CAIPI, it employs oscillating gradients in both phase-encode directions yielding a corkscrew trajectory through k-space, while low g-factor characteristics enable high degrees of acceleration in both directions4. This readout has now been paired with a conventional MPRAGE preparation, enabling 1 mm isotropic T1-weighted images to be acquired in less than 90 seconds5. Here, we validate the morphometrics from this rapid wave-MPRAGE scan with those from conventional MPRAGE scans with 3D Cartesian acquisition.Methods
All measurements were performed using a 3.0 T MRI scanner (Siemens Prisma). 6 subjects (mean: 26.5 years, 5 female) were scanned with the product 32-channel head coil. Each session included 4 MPRAGE scans acquired with recommended FreeSurfer parameters (6:12 min, TR/TI/TE=2530/1100/2.9 ms, matrix 256×256×176, resolution=1 mm, GRAPPA R=2). 20 wave-MPRAGE scans were acquired (1:16 min, CAIPI acceleration R=3x3, TE=3.3 ms, other parameters as above). To examine variable acceleration levels, 2 additional scans with 2 other protocols were acquired (MPRAGE: 3:22 min, TR/TE=2200/3.1 ms, GRAPPA R=4; wave-MPRAGE: 2:45 min, CAIPI acceleration R=2x2) Siemens WIP sequence 1084 was used to acquire the wave-MPRAGE scans. Images were analyzed using FreeSurfer6 v5.3 after all the scans from each subject were aligned using the FreeSurfer robust registration tool7. An automated parcellation of the cortex, subcortical and white matter structures was performed. Correlation plots were made for the thickness and volume of each of the 34 regions of the Desikan-Killiany atlas8. Total brain volume (TBV), average cortical thickness and intracranial volume (eTIV) were plotted for all scans with all subjects.Results
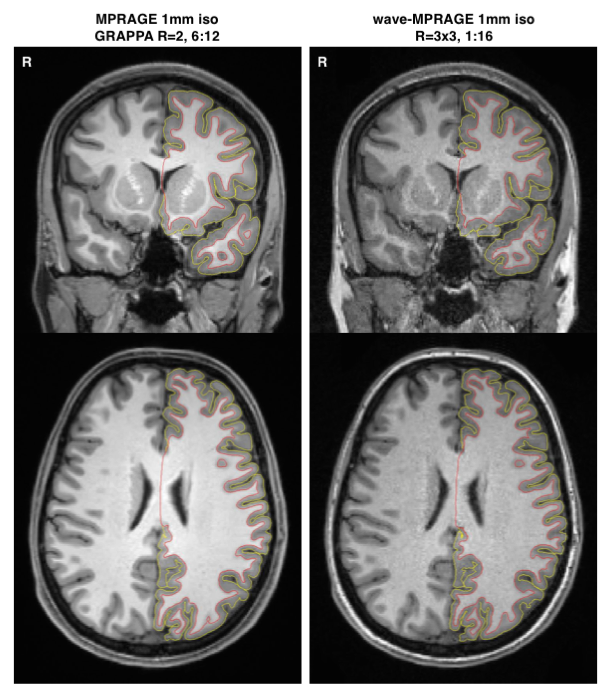
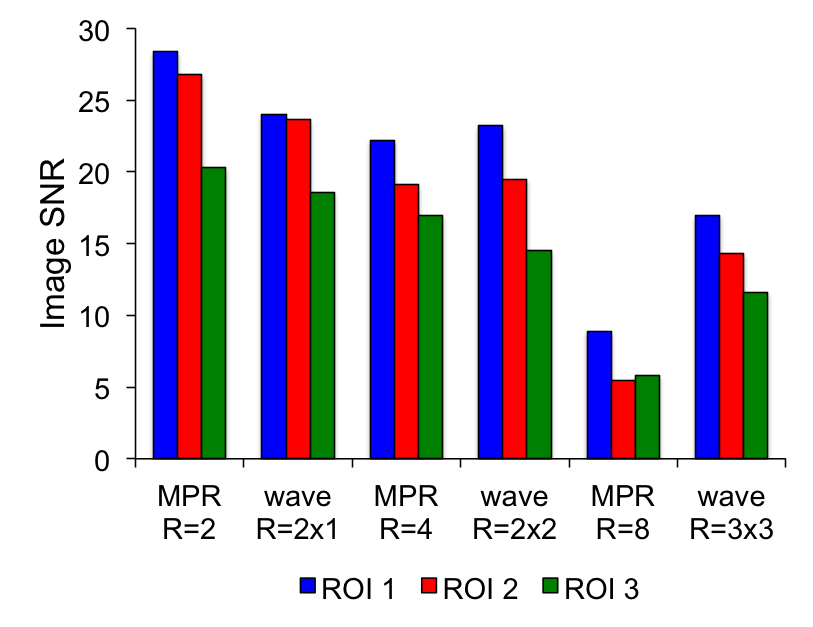
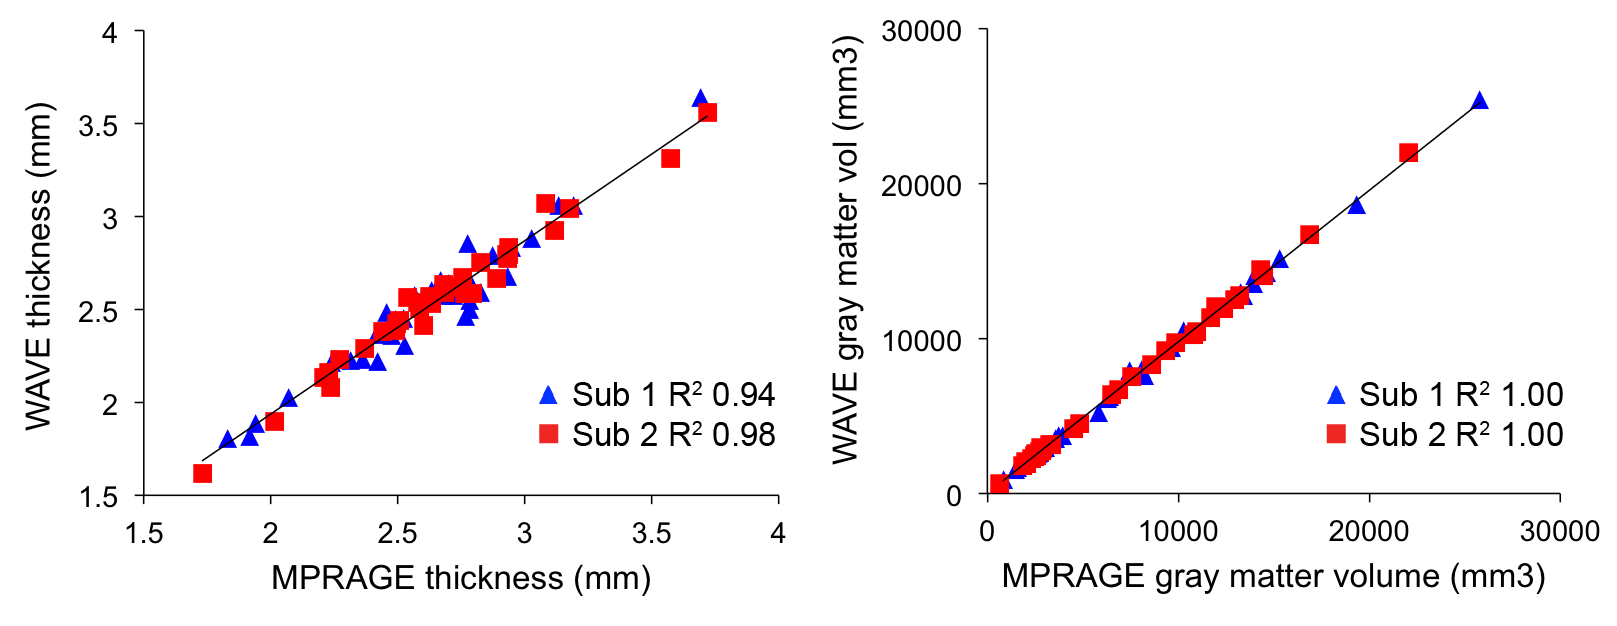
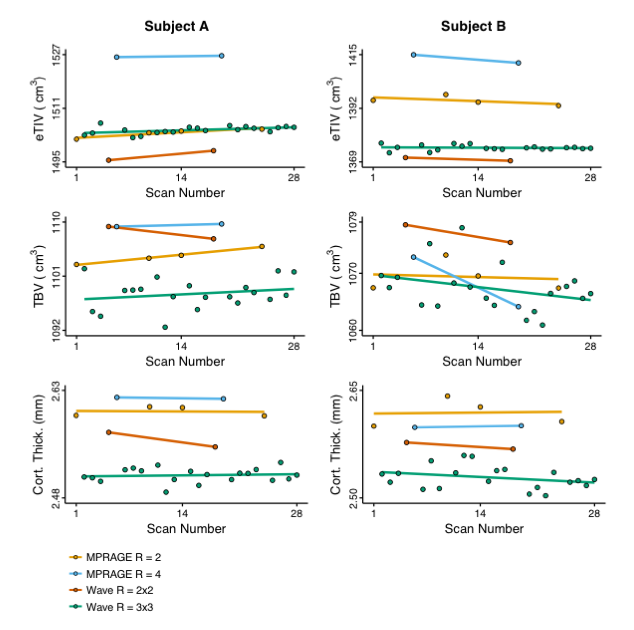
Fig. 1 shows example images, with FreeSurfer-generated pial and white-matter surfaces superimposed, of a 6:12 min conventional MPRAGE scan, and a single 1:16 min wave-MPRAGE scan. Although the SNR is noticeably lower in the wave-MPRAGE scan, the surfaces are comparable. Fig. 2 shows image SNR, determined from mean signal intensity and standard-deviation in ROIs of uniform intensity, for the different scans with different levels of acceleration. GRAPPA acceleration up to R=8 was employed in this initial trial for comparison to the total R=9 of the wave-MPRAGE scan. At R=9, the wave-MPRAGE scans maintain 50-60% of the SNR of the R=2 MPRAGE. Fig. 3 shows correlation of the cortical thickness and gray matter volume for all 34 regions of the Desikan-Killiany atlas as determined from a single conventional MPRAGE and a wave-MPRAGE scan. Within-subject correlations are high (r2>0.94 for all comparisons). However, a noticeable bias in absolute values between the conventional and wave scans was observed. Fig. 4 shows total brain volume, average cortical thickness and eTIV for all scans in the session with two of the six subjects. Cortical thickness and eTIV were consistently lower with the wave 1:16 min scan than with the 6:12 min conventional MPRAGE, and both wave protocols in general gave lower values than the conventional scans. However, for TBV, the differences were less distinct.Discussion
The wave-MPRAGE sequence with R=3x3 acceleration produces a high-quality T1-weighted image of the brain in under 90 seconds. Despite the noticeable decrease in SNR vs a conventional 6-minute MPRAGE, the surfaces created from the wave images match those from the conventional scans well. Comparing SNR at similar acceleration levels (and scan time), the wave-MPRAGE produces images with lower SNR at low acceleration, is similar at 4-fold acceleration, but the low g-factor noise amplification results in much higher SNR at very high acceleration levels. While a bias is seen toward the conventional MPRAGE scans in average cortical thickness and eTIV, the actual morphometric values in a living subject are unknown. This implies that care should be taken when combining morphometric data across studies and sites, but does not necessarily imply one value is wrong. The rapid acquisition time of the wave-MPRAGE allows the acquisition of multiple images in the same time as a conventional scan, to signal average, or average the surfaces, and so reduce the standard error in morphometric values over that from a single conventional MPRAGE scan. Additionally, the rapid acquisition time inherently ameliorates the effects of significant subject motion.Acknowledgements
Harvard Center for Brain Science; NIH Shared Instrumentation Grant S10OD020039; NIH Grants P41-RR14075, U24-RR021382. Berkin Bilgic, Steve Cauley, Kawin Setsompop (MGH) and Yulin Chang (Siemens) for making the WIP sequence available.References
1. Holmes, A.J. et al., ‘Brain Genomics Superstruct Project initial data release with structural, functional, and behavioral measures’, Sci. Data 2015;2:150031.
2. Mair, R.W. et al., ‘Quantitative Comparison of Morphometric Data from Multi-Echo MPRAGE with Variable Acceleration and Different Head Coils’, Proceedings ISMRM 2013;21:947.
3. Mair, R.W. et al., ‘Impact of acquisition parameters on cortical thickness and volume derived from Multi-Echo MPRAGE scans’, Proceedings ISMRM 2016;24:1158.
4. Bilgic, B. et al., ‘Wave-CAIPI for highly accelerated 3D imaging’, Magn. Reson. Med. 2015;73:2152-2162.
5. Polak D. et al., ‘Wave-CAIPI for Highly Accelerated MP-RAGE Imaging’, Magn. Reson. Med. 2017; DOI: 10.1002/mrm.26649
6. Fischl, B, ‘Measuring the thickness of the human cerebral cortex from magnetic resonance images’, Proc. Natl. Acad. Sci. USA, 2000;97:11050-11055.
7. Reuter, M., ‘Highly Accurate Inverse Consistent Registration: A Robust Approach’, NeuroImage, 2010;53;1181-1196.
8. Desikan, R. et al., ‘An automated labeling system for subdividing the human cerebral cortex on MRI scans into gyral based regions of interest’, NeuroImage 2006;31:968-980.
Figures