0317
The UK7T Network – optimized design of a multi-site, multi-vendor travelling heads study.1Wellcome Centre for Integrative Neuroimaging, FMRIB, Nuffield Department of Clinical Neurosciences, University of Oxford, Oxford, United Kingdom, 2Sir Peter Mansfield Imaging Centre, School of Physics and Astronomy, University of Nottingham, Nottingham, United Kingdom, 3Cardiff University Brain Research Imaging Centre, School of Psychology, Cardiff University, Cardiff, United Kingdom, 4Wolfson Brain Imaging Centre, Department of Clinical Neurosciences, University of Cambridge, Cambridge, United Kingdom, 5Institute of Neuroscience & Psychology, University of Glasgow, Glasgow, United Kingdom
Synopsis
Research sites in the “UK7T Network”, a consortium of 7 tesla capable sites in the UK, have conducted a pilot multi-site, multi-vendor neuroimaging study. The Network aims to create a harmonized set of imaging protocols relevant for clinical research. This study evaluates the differences seen in a set of structural and functional sequences run on three different scanner models, manufactured by two different vendors, at four different sites. In this abstract we identify key differences found between systems and a provide a synopsis of the main findings. The results will inform a future ten subject “travelling heads” study.
Introduction
The UK7T Network is a consortium of 7 tesla MRI capable sites in the United Kingdom. The Network will establish a harmonized set of anatomical and functional MRI protocols for neuroimaging and future clinical studies across the Network sites.1
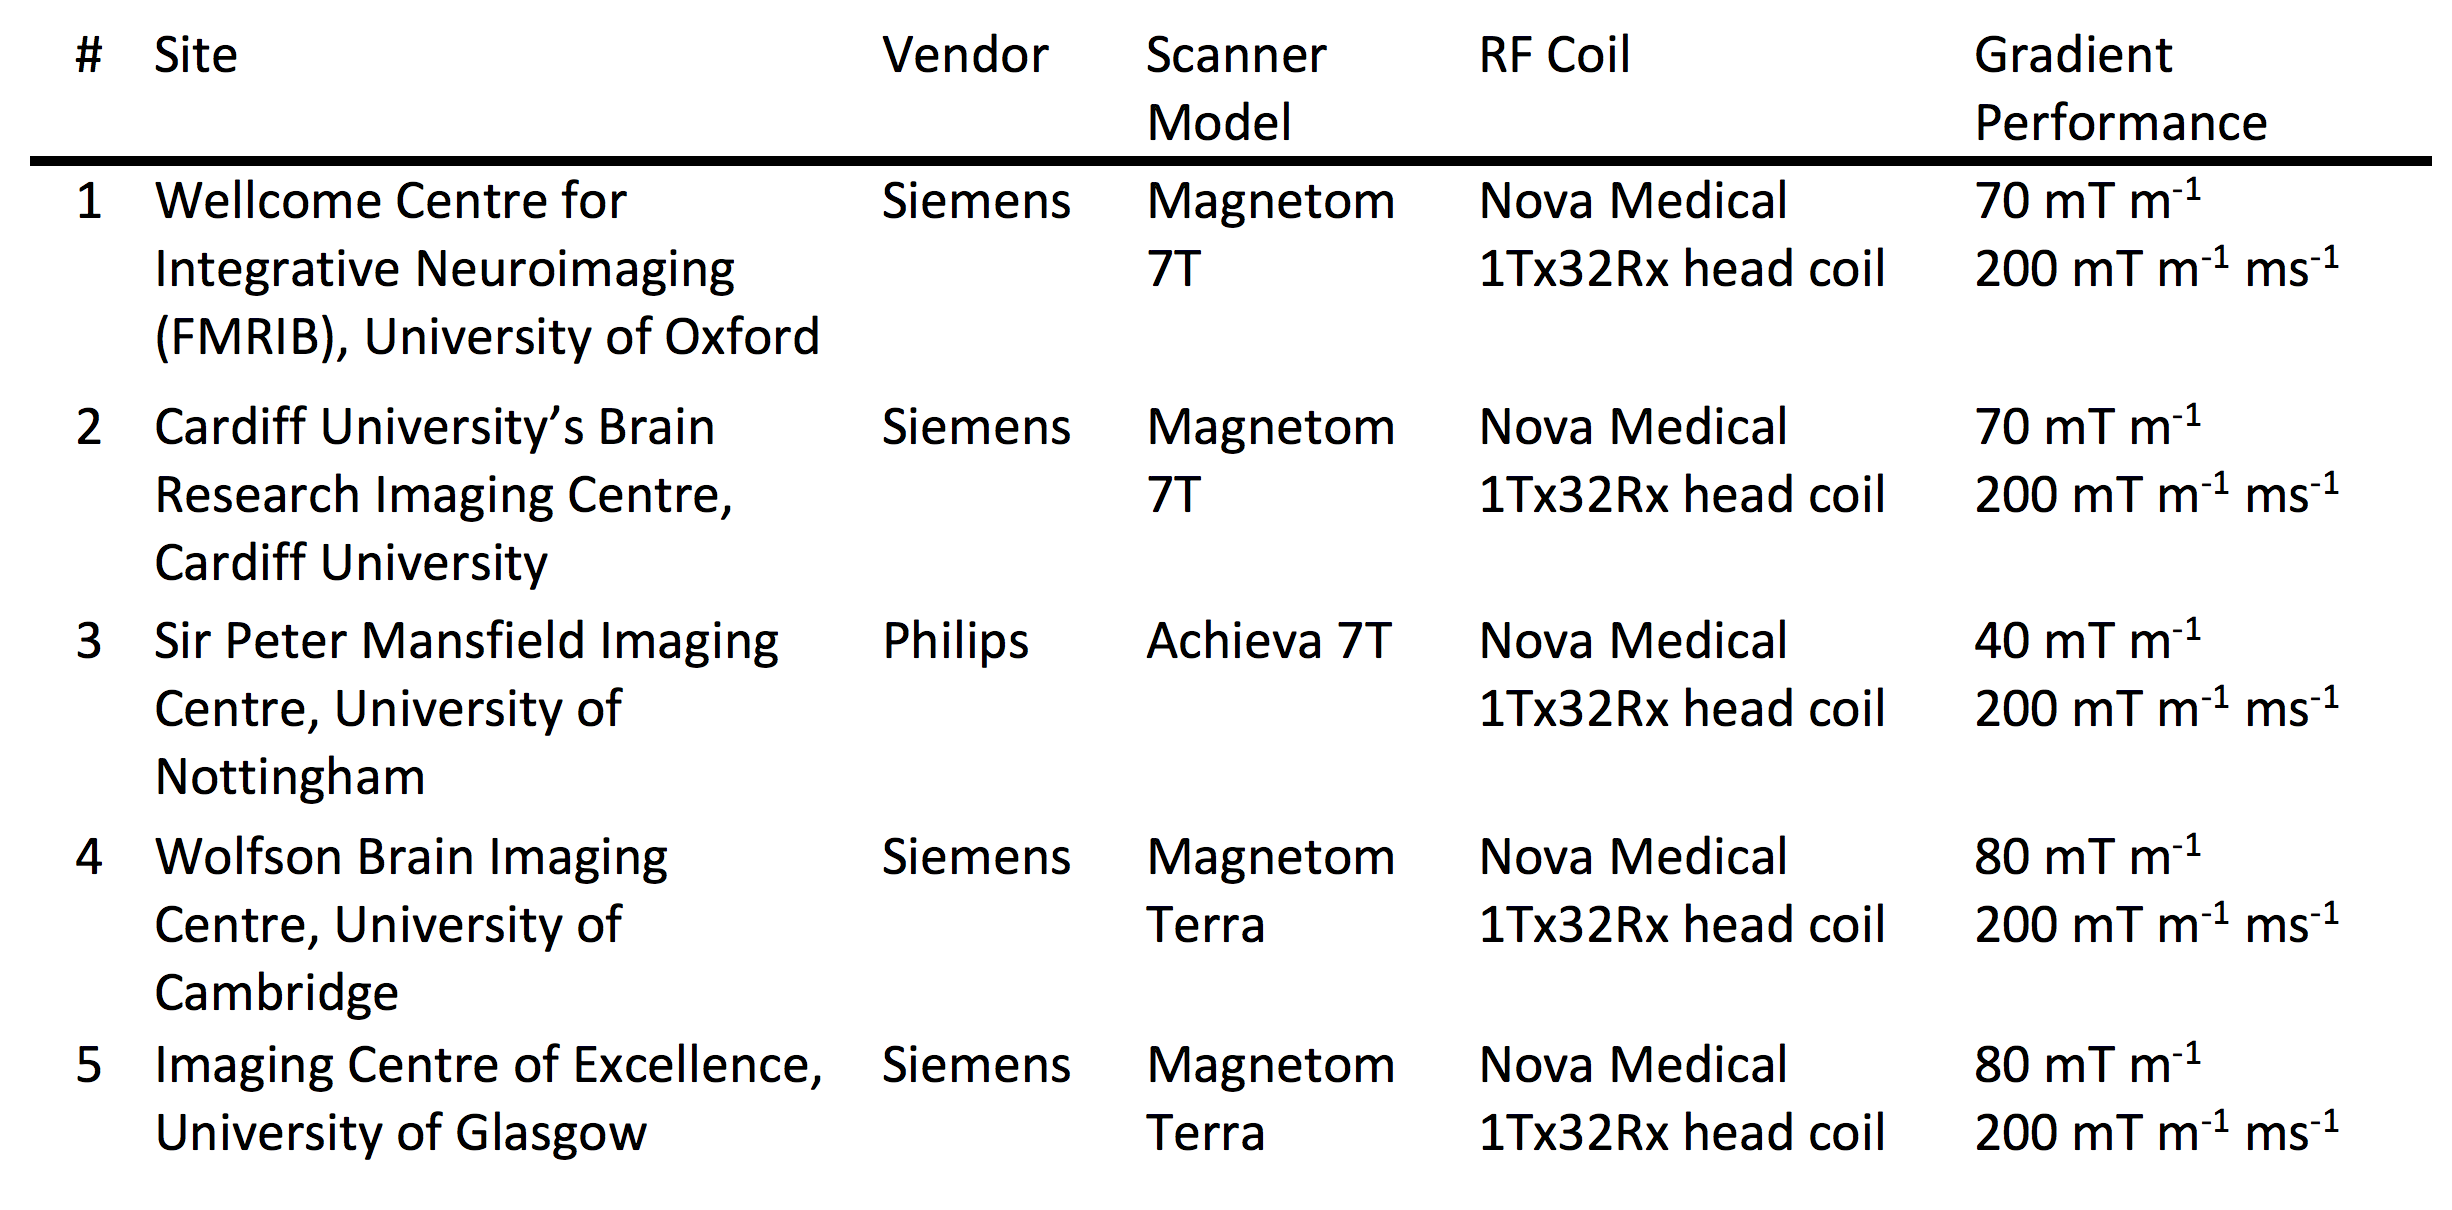
The five Network sites use three different scanner models, manufactured by two different vendors. Default protocols, sequence structure, image reconstruction and scanner adjustments consequently vary. In this work, the results of a pilot study using the different scanner systems are reported.
The pilot study has been used to identify differences, and harmonize the use of the systems before the start of a second larger study. The second study will validate the Network’s optimized set of protocols in a “travelling heads” study, scanning the same 10 subjects at every Network site.2
Methods
The pilot study was run at four sites (1-4 in Table 1) covering each of the different models of scanners in the Network. Three subjects (male, 31±4 years, 78±7 kg) were scanned at every site. A quality assurance protocol was run on every day of scanning on the same phantom.3
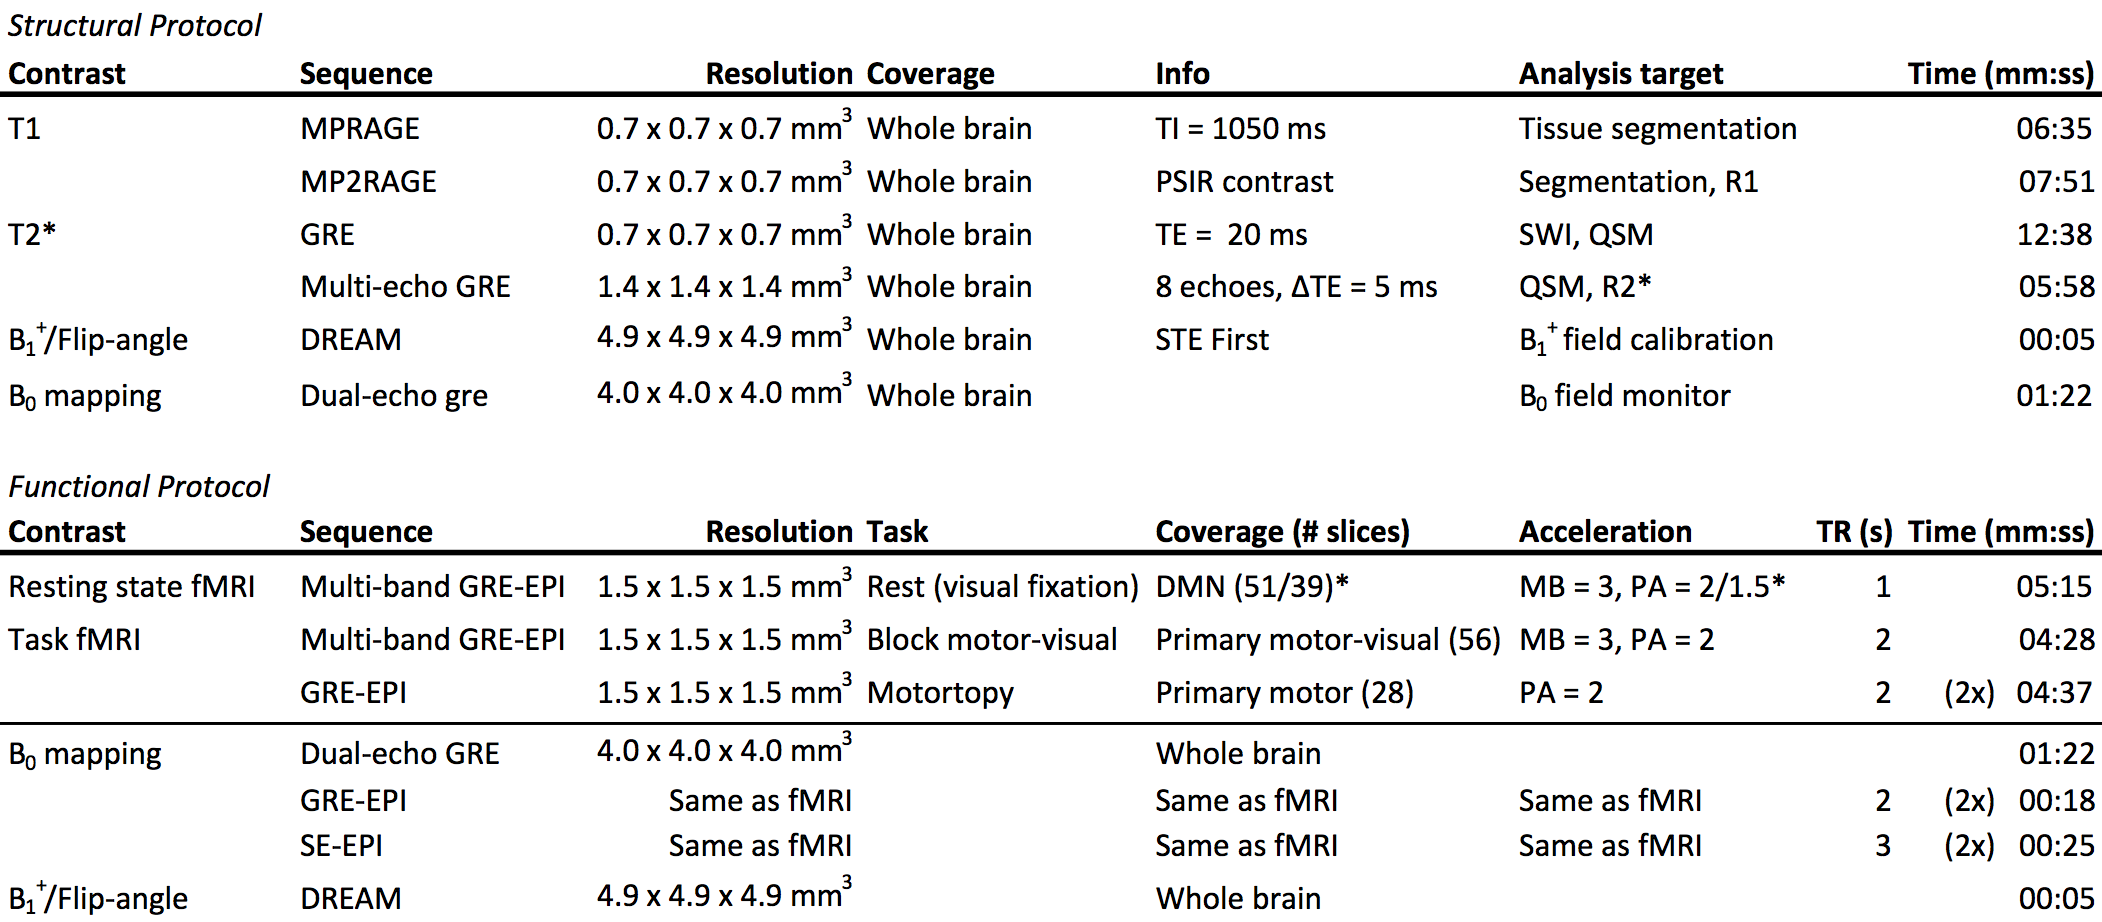
Two sessions per subject were run at each site (each ≤ 50 minutes): the first for structural images, the second for fMRI (Table 2).
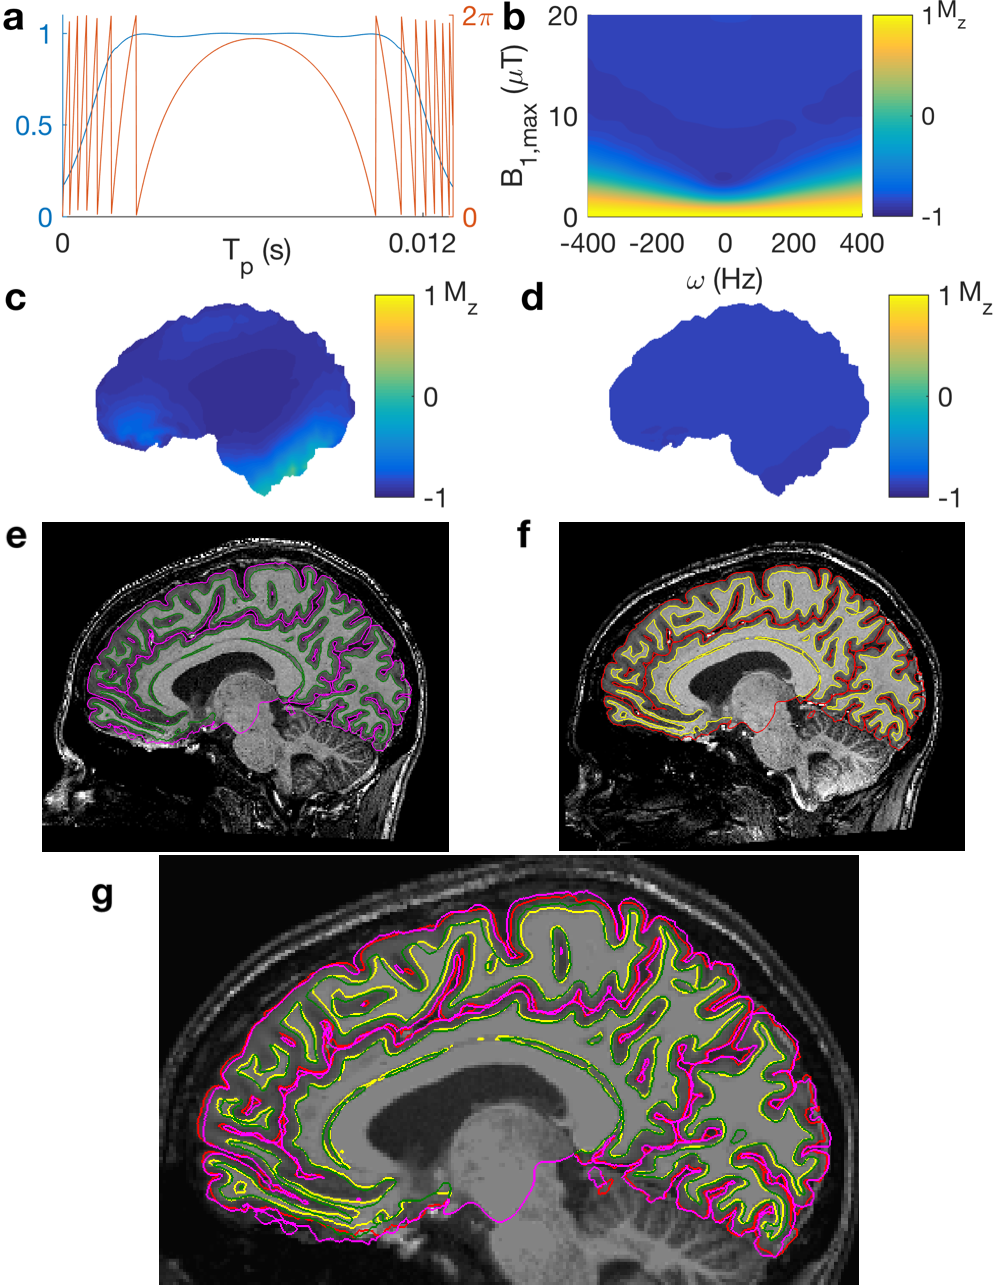
The structural protocol evaluated systematic differences in T1 and T2* weighted (including QSM and SWI) contrast scans.4 Field-mapping (B1+ and B0) sequences were run to identify systematic differences in the per-session calibration of scanners. Sequence parameters were made equal at every opportunity, and RF-pulses were harmonized across the sites e.g. the MP(2)RAGE inversion pulse (Figure 1).5,6
In the fMRI protocol, three fMRI data-sets were acquired. The protocol includes both 2D multi-band accelerated and single-band sequences.7 Both dual-echo GRE and blip-up-blip-down (GRE&SE) EPI field-maps were acquired to assess the optimum method for EPI distortion correction at 7T.8
Segmentation and cortical thickness measurements were carried out in FreeSurfer.9 T1 values were calculated from MP2RAGE data. QSM and R2* images were calculated using the STI Suite software package.10 Distortion-corrected fMRI, utilizing all types of field-map acquired and FSL, were compared to GRE images.11 fMRI scans were corrected for distortion and motion in FSL, registered to anatomical space and processed in FSL’s FEAT (task) and MELODIC (resting state).
Results
Data was acquired between July and November 2017. Detailed results are presented in other abstracts; here we identify key differences found between systems and provide a synopsis of results.
Cortical grey matter segmentation showed good agreement across scanners with no area significantly different on different scanners. Average T1 values agreed with the literature (WM = 1.26 s, GM = 1.94 s); with no significant differences between scanners.12 R2* values showed low inter-site variability.
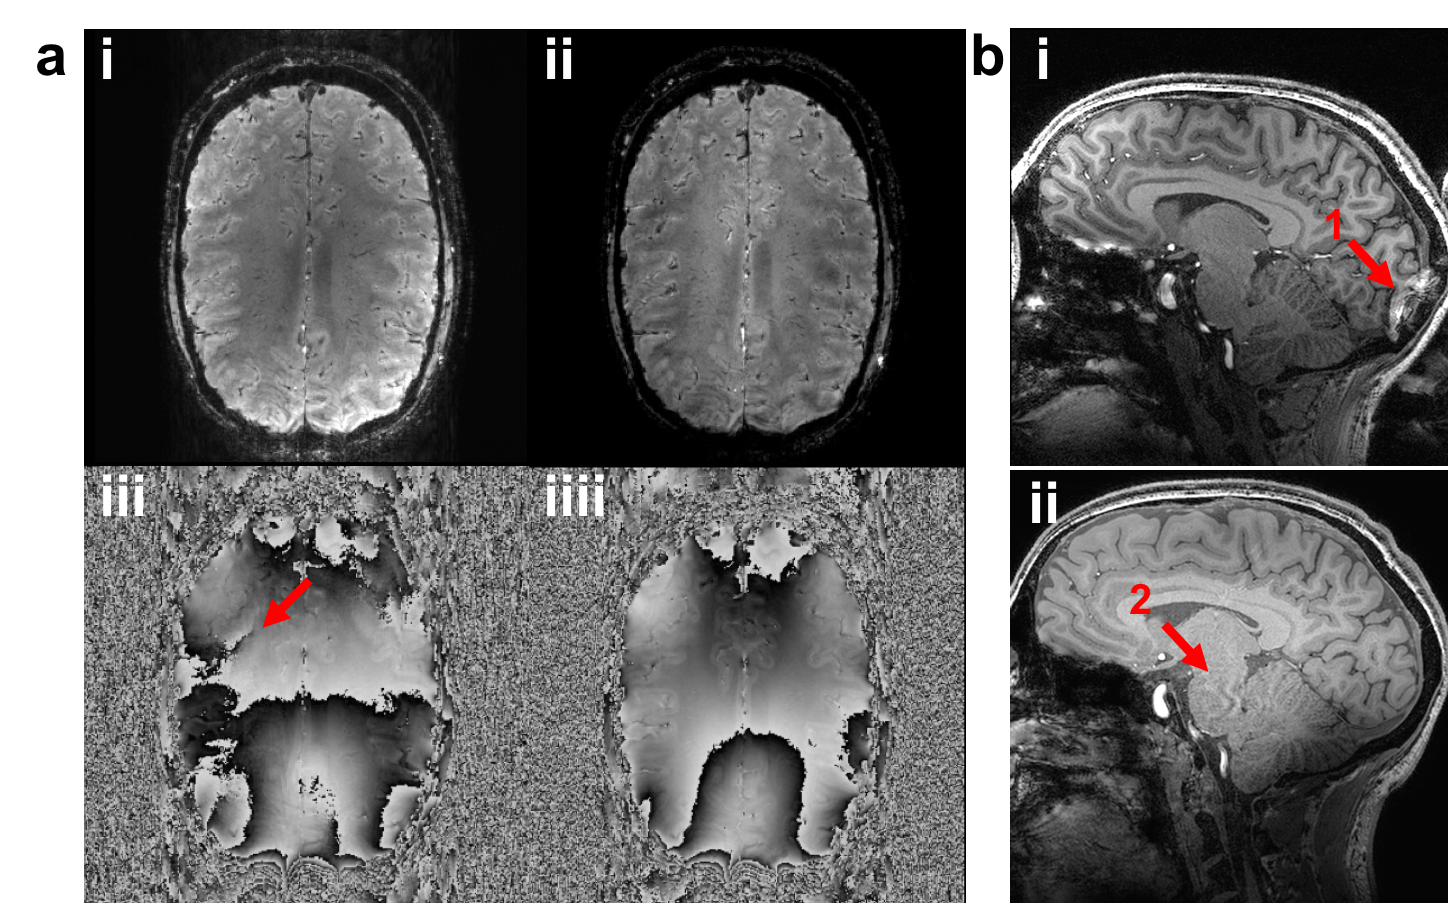
Differences were identified in scanner calibration, pulse sequences and reconstruction. Scanner calibration of B0 and B1+ introduced systematic differences in B0 homogeneity and B1+ magnitude. Phased array coil combination methods vary between vendors. SENSE-combined images give spatially continuous phase whilst others, e.g. the Adaptive Combine algorithm, contain open-ended fringe lines (Figure 2a).13,14 Different parallel acceleration techniques (i.e. SENSE and GRAPPA) result in different image artefacts (Figure 2b).15
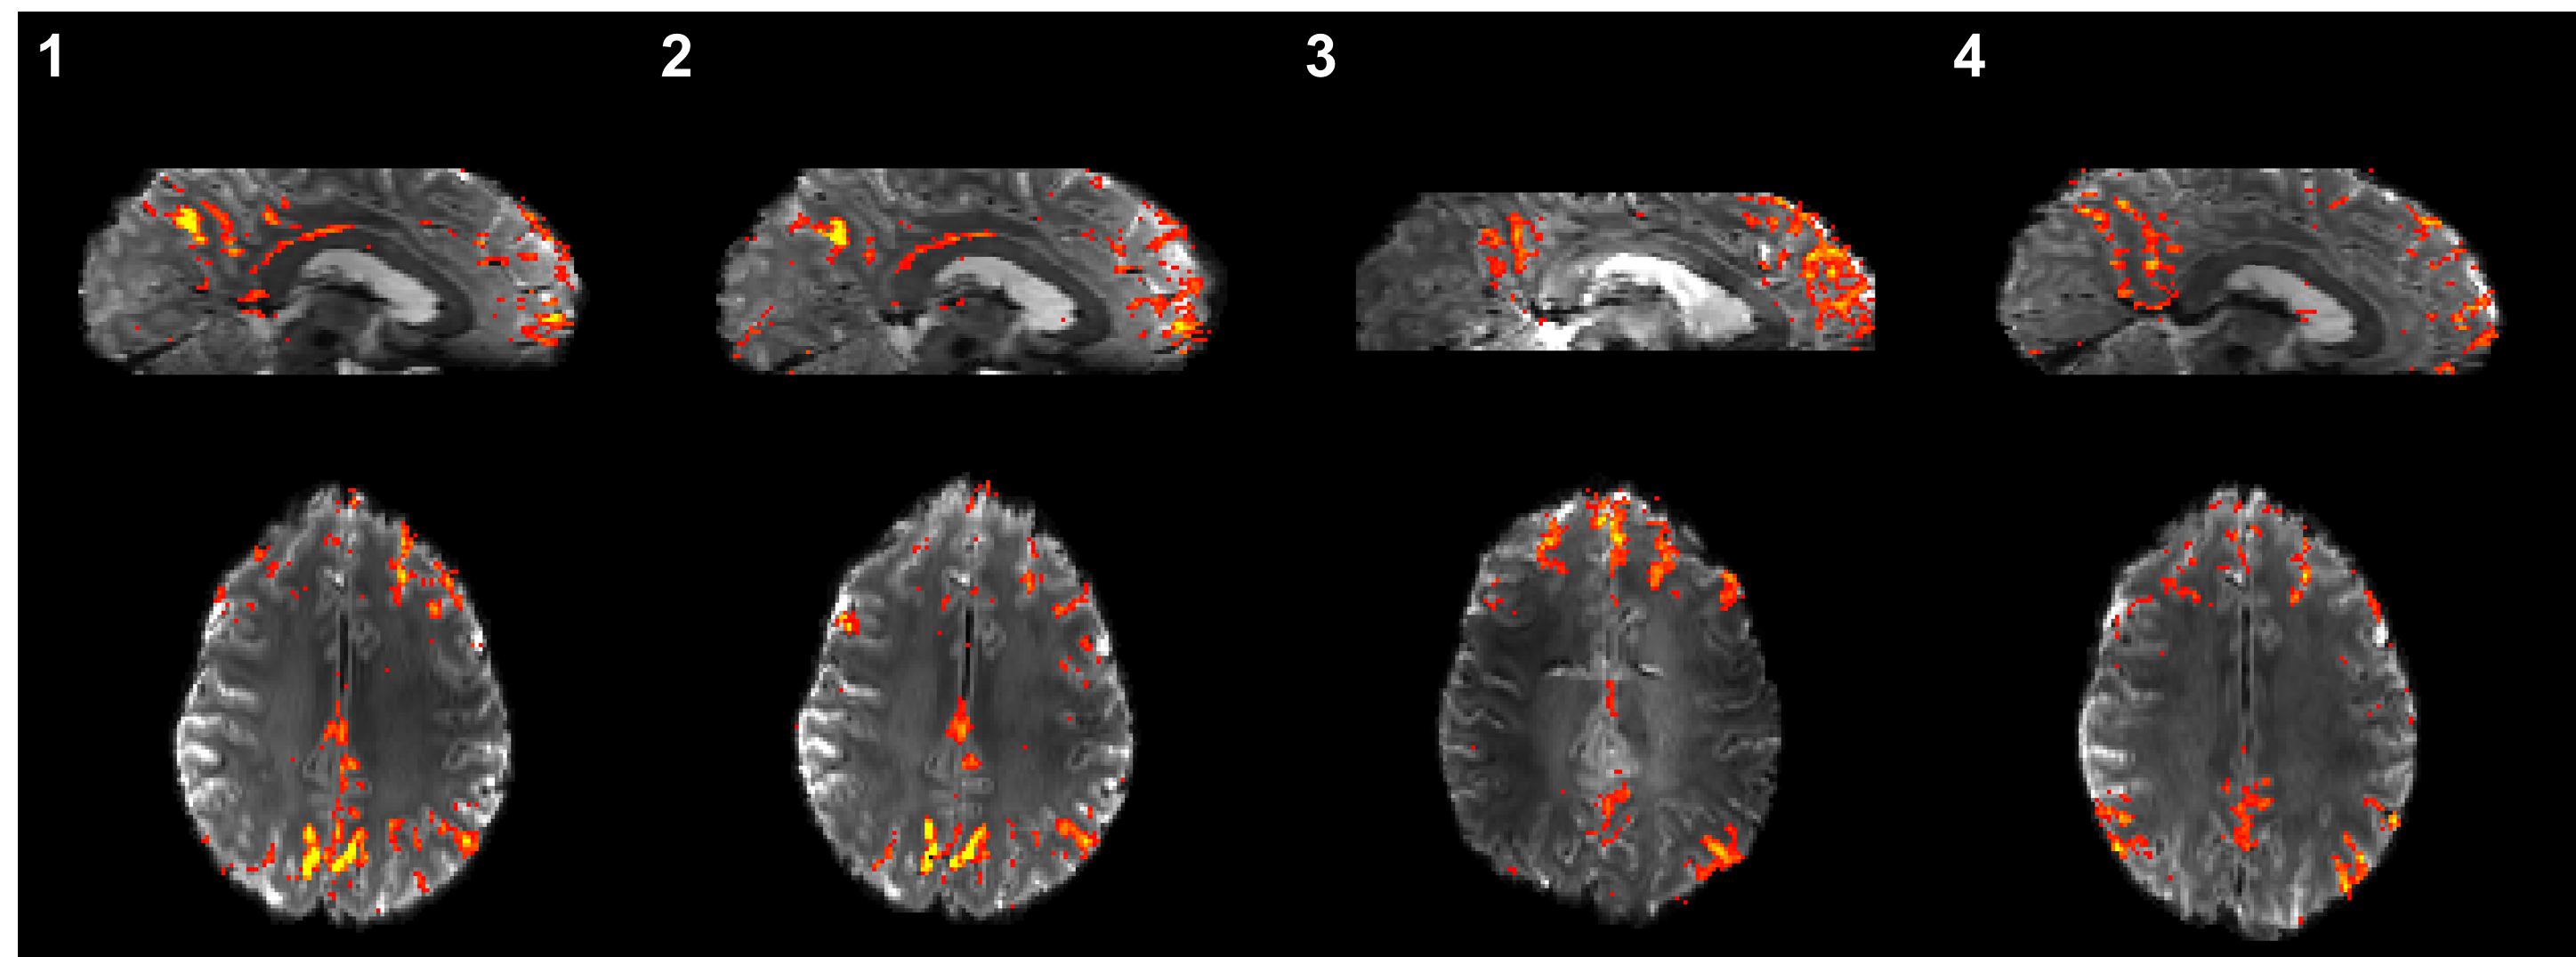
Results from fMRI data acquired using multi-band acceleration were found to depend strongly on scanner, sequence implementation and reconstruction. For example, in the z-statistic maps of the Default Mode Network (Figure 3).16
Discussion
In this pilot study, we have overcome major model-specific differences. Harmonizing sequences enabled us to consistently acquire anatomical and functional brain images. A custom implementation of Roemer’s coil combination enables uncorrupted phase data to be collected from all scanners.17
Differences between sites do remain. Across models, calibration of B1+ and B0 fields result in systematic differences in RF-field magnitude and B0-field homogeneity. User-validated calibration will be essential to harmonize sensitive qualitative contrasts.
Differences in multi-band accelerated fMRI data are small when using the same scanner model and sequence (sites/panels 1&2, Figure 3), but are significant even with the same sequence and reconstruction on a different scanner model (site/panel 4). Sequence parameters (e.g. in-plane acceleration and echo spacing) must be adjusted to minimize these effects.
This pilot study has laid the foundations for a subsequent larger “travelling heads” study. Conducted across all five Network sites, ten subjects will be scanned at each site and four more times at a designated “home” site.
Conclusion
Three subjects have been scanned on three different 7T scanners, at four sites, with research relevant neuroimaging protocols. Using harmonized protocols, site specific differences have been eliminated, though some remain. This work enables the planning of a multi-site, multi-vendor quantitative neuroimaging study.Acknowledgements
The UK7T network and this work was funded by the UK's Medical Research Council (MRC). Grant code: MR/N008537/1References
1. Trattnig S, Bogner W, Gruber S, Szomolanyi P, Juras V, Robinson S, Zbyn S, Haneder S. Clinical applications at ultrahigh field (7 T). Where does it make the difference? NMR Biomed 2016;29(9):1316-1334.
2. Voelker MN, Kraff O, Brenner D, Wollrab A, Weinberger O, Berger MC, Robinson S, Bogner W, Wiggins C, Trampel R, Stocker T, Niendorf T, Quick HH, Norris DG, Ladd ME, Speck O. The traveling heads: multicenter brain imaging at 7 Tesla. MAGMA 2016;29(3):399-415.
3. Voelker MN, Kraff O, Pracht E, Wollrab A, Bitz AK, Stöcker T, Quick HH, Speck O, Ladd ME. Quality Assurance Phantoms and Procedures for UHF MRI ‒ The German Ultrahigh Field Imaging (GUFI) Approach. 2017; Honolulu, HI, USA. p 3912.
4. Deistung A, Schweser F, Reichenbach JR. Overview of quantitative susceptibility mapping. NMR Biomed 2017;30(4).
5. Hurley AC, Al-Radaideh A, Bai L, Aickelin U, Coxon R, Glover P, Gowland PA. Tailored RF pulse for magnetization inversion at ultrahigh field. Magn Reson Med 2010;63(1):51-58.
6. Marques JP, Kober T, Krueger G, van der Zwaag W, Van de Moortele PF, Gruetter R. MP2RAGE, a self bias-field corrected sequence for improved segmentation and T1-mapping at high field. Neuroimage 2010;49(2):1271-1281.
7. Moeller S, Yacoub E, Olman CA, Auerbach E, Strupp J, Harel N, Ugurbil K. Multiband multislice GE-EPI at 7 tesla, with 16-fold acceleration using partial parallel imaging with application to high spatial and temporal whole-brain fMRI. Magn Reson Med 2010;63(5):1144-1153.
8. Andersson JL, Skare S, Ashburner J. How to correct susceptibility distortions in spin-echo echo-planar images: application to diffusion tensor imaging. Neuroimage 2003;20(2):870-888.
9. Reuter M, Rosas HD, Fischl B. Highly accurate inverse consistent registration: a robust approach. Neuroimage 2010;53(4):1181-1196.
10. STI Suite. http://people.duke.edu/~cl160/
11. Jenkinson M, Beckmann CF, Behrens TE, Woolrich MW, Smith SM. Fsl. Neuroimage 2012;62(2):782-790.
12. Wright PJ, Mougin OE, Totman JJ, Peters AM, Brookes MJ, Coxon R, Morris PE, Clemence M, Francis ST, Bowtell RW, Gowland PA. Water proton T1 measurements in brain tissue at 7, 3, and 1.5 T using IR-EPI, IR-TSE, and MPRAGE: results and optimization. MAGMA 2008;21(1-2):121-130.
13. Pruessmann KP, Weiger M, Scheidegger MB, Boesiger P. SENSE: sensitivity encoding for fast MRI. Magn Reson Med 1999;42(5):952-962.
14. Walsh DO, Gmitro AF, Marcellin MW. Adaptive reconstruction of phased array MR imagery. Magn Reson Med 2000;43(5):682-690.
15. Griswold MA, Jakob PM, Heidemann RM, Nittka M, Jellus V, Wang J, Kiefer B, Haase A. Generalized autocalibrating partially parallel acquisitions (GRAPPA). Magn Reson Med 2002;47(6):1202-1210.
16. Horn A, Ostwald D, Reisert M, Blankenburg F. The structural-functional connectome and the default mode network of the human brain. Neuroimage 2014;102 Pt 1:142-151.
17. Roemer PB, Edelstein WA, Hayes CE, Souza SP, Mueller OM. The NMR phased array. Magn Reson Med 1990;16(2):192-225.
Figures