0315
Using 3D high-resolution MR Fingerprinting (MRF) to assist detection and characterization of epileptic lesions1Radiology, Case Western Reserve University, Cleveland, OH, United States, 2Epilepsy Center, Cleveland Clinic, Cleveland, OH, United States, 3Magnetic Resonance Center, Max Planck Institute for Biological Cybernetics, Tuebingen, Germany, 4Imaging Institute, Cleveland Clinic, Cleveland, OH, United States, 5Neuroradiology, Cleveland Clinic, Cleveland, OH, United States
Synopsis
The goal of this study is to develop 3D high resolution MRF scans and partial volume analysis methods to assist detection and characterization of epileptogenic foci in patients with drug refractory epilepsy undergoing presurgical evaluation. In addition to providing quantitative T1/T2 values for tissue characterization, we hypothesize that quantitative maps also provide better sensitivity in detecting subtle epileptic lesions. To this end, high resolution T1 and T2 maps, as well as gray matter, white matter fractions maps and tissue cluster maps, were used to detect and characterize epileptic lesions that were difficult to identify from the weighted images and from conventional voxel-based post-processing analysis based on T1-weighted images.
Introduction
For patients with drug-refractory epilepsy, surgery is an effective treatment option. The success of epilepsy respective surgery is closely related to the identification of the epileptogenic zone, i.e., the tissue needed to be resected to achieve seizure-freedom. MRI detects a sizable percentage of epileptic lesions, but up to 30% of patients undergoing surgical evaluation still do not have an identifiable focus on the conventional MRI. The goal of this study is to explore the use of quantitative T1, T2 and partial volume maps from MR fingerprinting acquisition on the detection and characterization of epileptic lesions.Methods
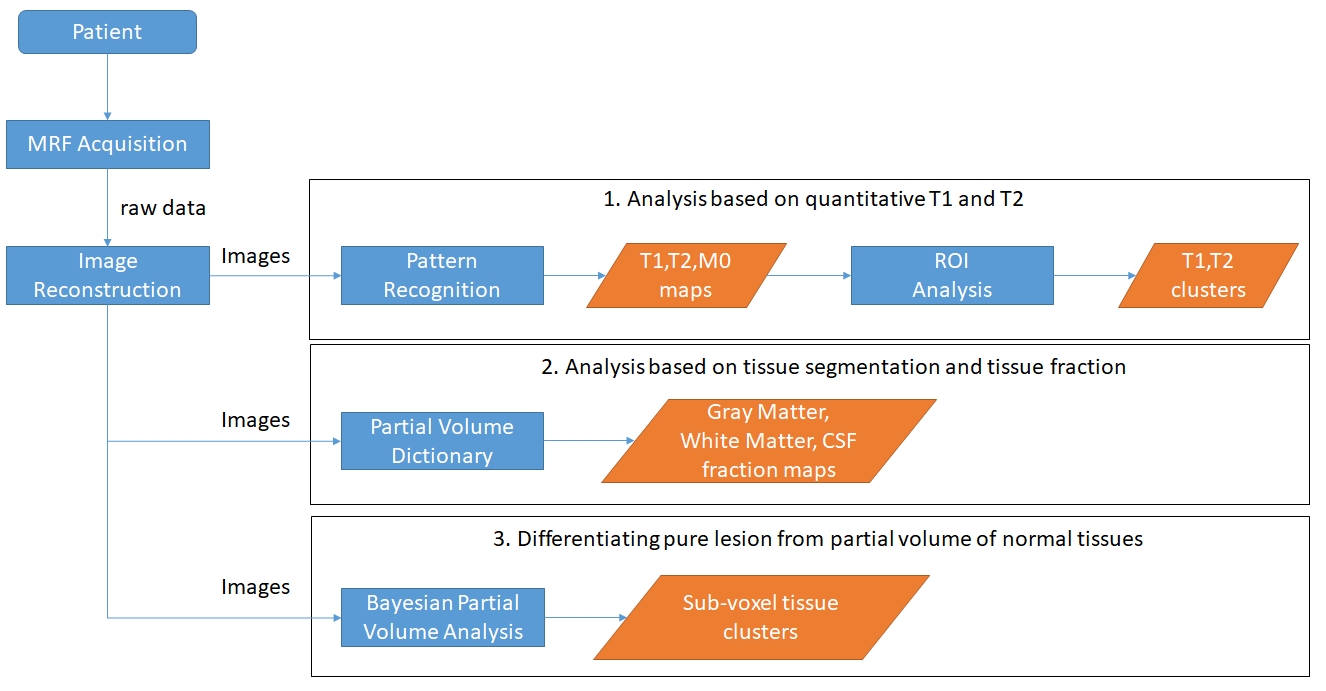
To fully capture the subtle and diffuse lesions from epilepsy patients, we developed a 3D whole brain MRF scan with FOV of 300x300x144 mm3 and matrix size of 256x256x120, which resulted in a 1.2 mm3 isotropic image resolution(1,2). The raw data were then zero-padded in three dimensions to achieve a 0.6 mm3 image resolution during the reconstruction and before the pattern recognition step. The total scan time of the 3D MRF scan was 10.4 minutes. A 1.5-minute B1 scan was performed to correct for the B1 inhomogeneity in all the MRF results. To further expand the dimension of tissue analysis, two PV methods(3,4) were applied to the acquired data to provide PV maps, such as gray-matter and white-matter fraction maps as well as tissue cluster maps. Based on the T1, T2 and PV maps, ROIs were drawn from the visible epileptic, non-epileptic, normal gray-matter and white-matter regions. The T1 and T2 values from these ROIs were plotted in a scatter plot. The main steps of data processing and analysis are illustrated in Figure 1.
All patients were scanned in a Siemens 3T Prisma MRI. We compared the MRF results with the conventional MRI scan, voxel-based morphometric (VBM) post-processing based on the T1-weighted images(5), and the clinical/EEG/surgery findings of the patients.
Results
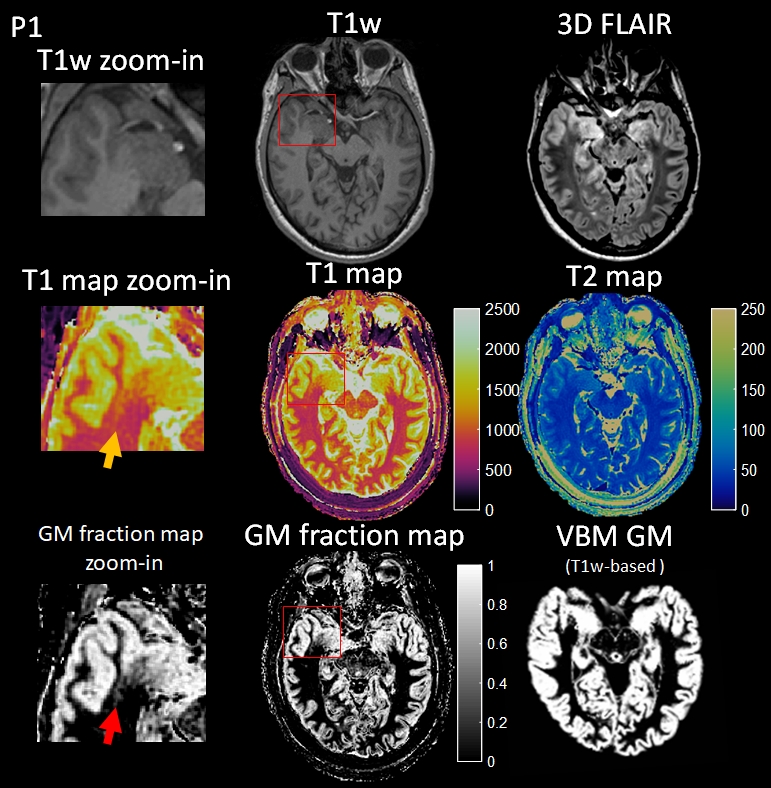
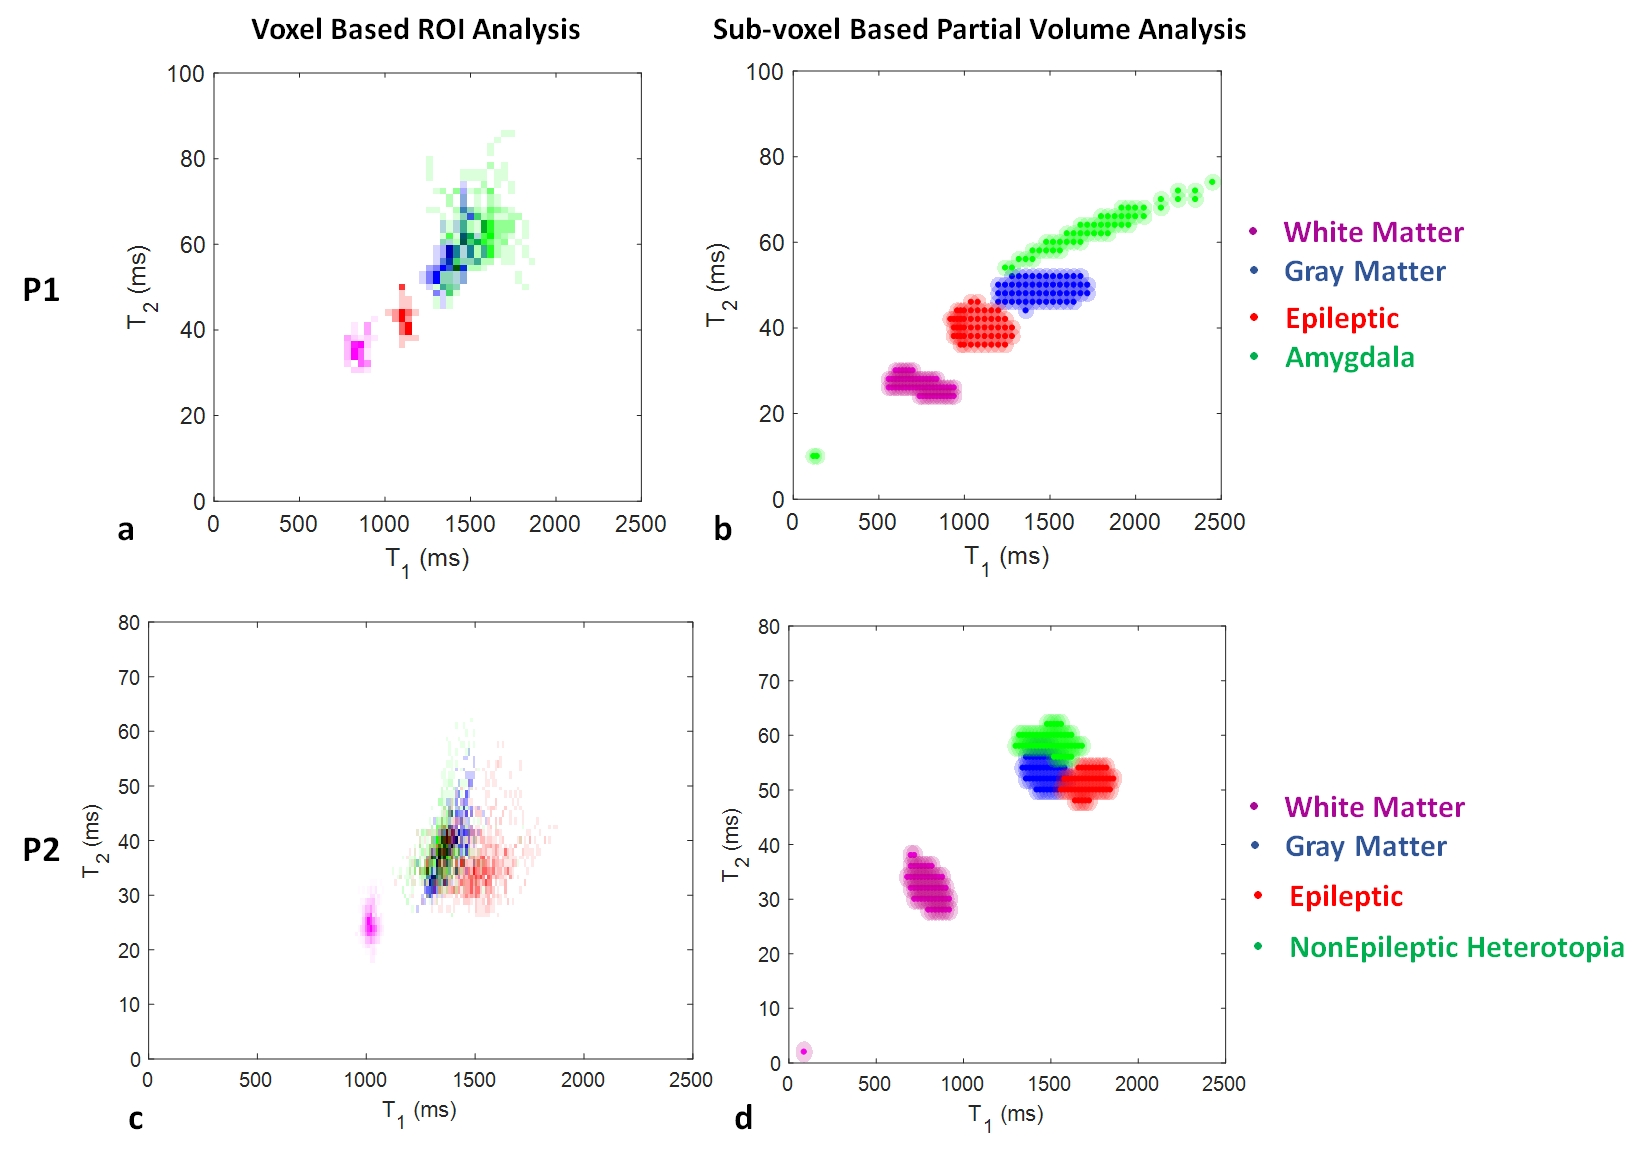
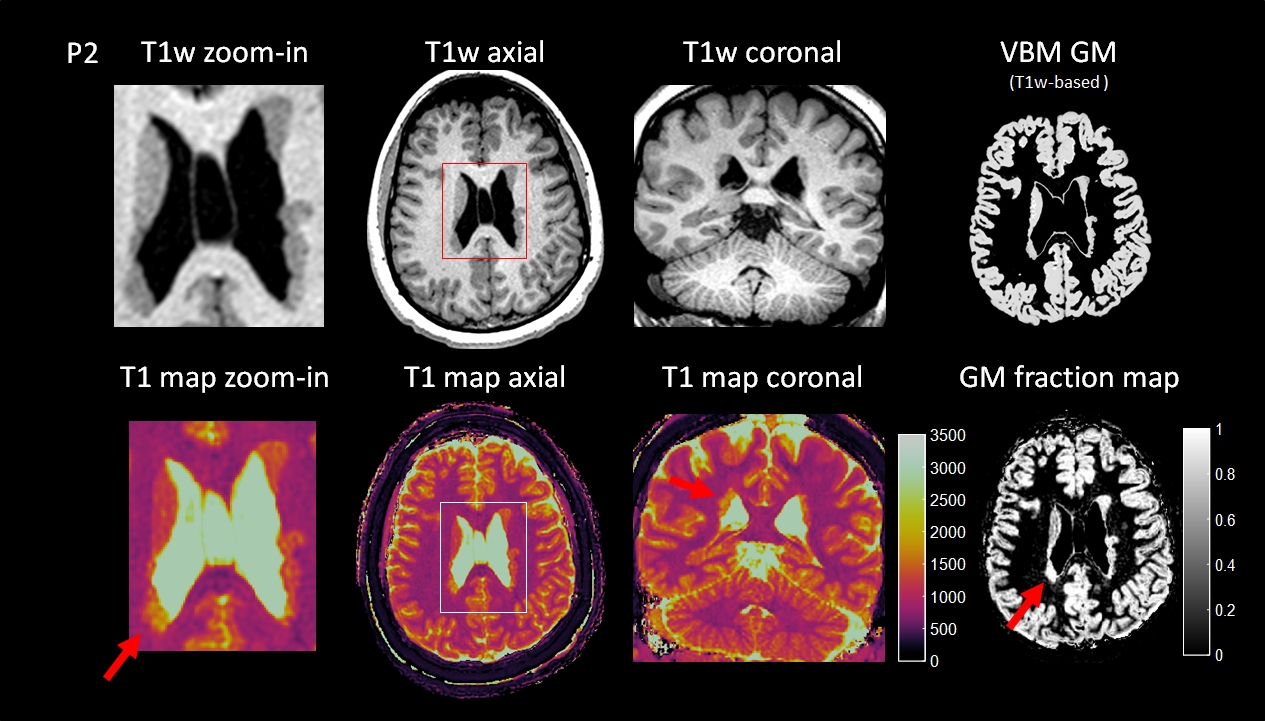
Two examples from epilepsy patients are shown in Figure 2 to 5. Figure 2 shows the 3D MRF acquisition on a patient with right temporal lobe epilepsy. Clinical MRI showed that the right amygdala was enlarged with FLAIR hyperintensity, with the right temporal lobe otherwise unremarkable by visual inspection or by VBM analysis. As illustrated, MRF reveals a previously unseen signal abnormality in addition to the amygdala hyerintensity: subtle increased T1 was seen on the T1 map and increased gray-matter fraction in the white-matter region was seen on the gray-matter fraction map of the right superior temporal region, indicating potential epileptogenic pathology. While this abnormality has no significant conspicuity on conventional MRI sequences, the location of the abnormality was highly concordant with interictal and ictal EEG localization. As shown in Figure 3a, ROI analysis shows a distinct cluster in this region as compared to more distal cortical GM, WM and amygdala. Sub-voxel PV analysis in Figure 3b shows similar cluster distribution, but additionally indicates that the lesion itself is a distinct and compact cluster, rather than a PV effect from normal GM and WM tissues. The patient underwent right temporal lobectomy and became seizure-free for 4 months (most recent follow up). Surgical pathology of the resected temporal lobe revealed mild forms of malformation of cortical development. Figure 4 shows the 3D MRF acquisition on a different patient with right temporo-parietal epilepsy, who had known bilateral periventricular heterotopias along the ventricles and the nodules showed uniform signal intensity from the clinical MRI scans as well as VBM analysis.
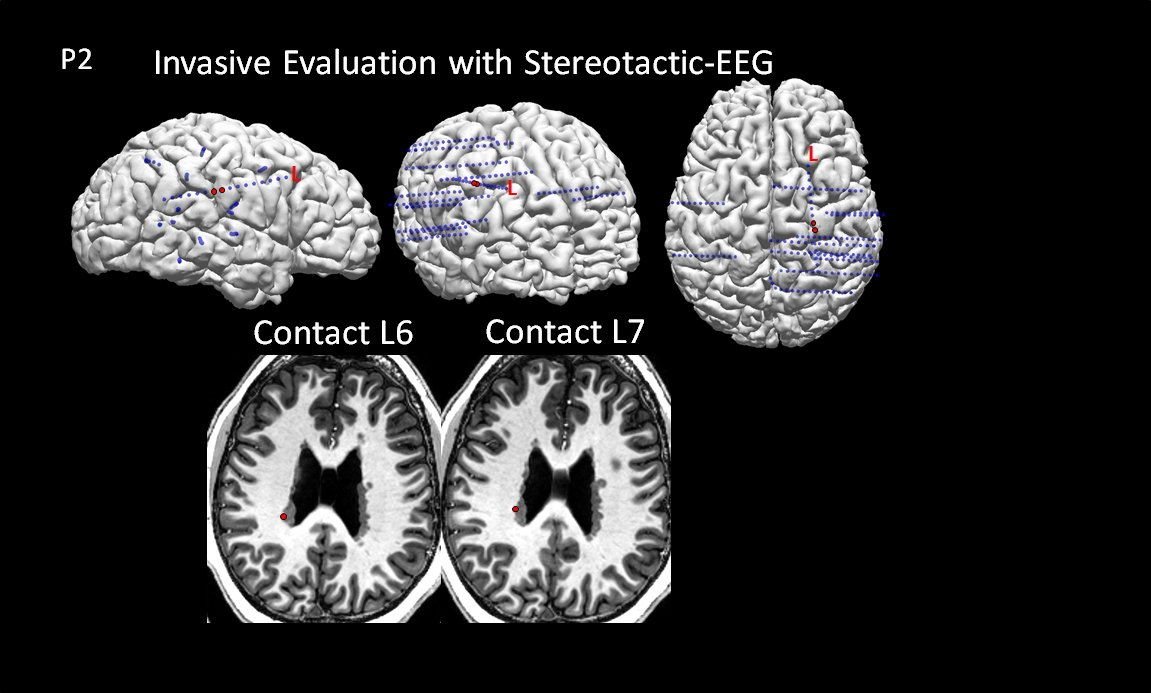
Figure 4 shows a subtle T1 increase in the MRF T1 map of the nodules at the right occipital horn, which was evident on both the axial and coronal T1 maps. ROI and sub-voxel PV analysis in Figure 3cd show a distinct cluster in this region as compared to the other nodules, cortical GM and WM. This distinct signal abnormality was not appreciable on the conventional MRI scans. The patient underwent invasive evaluation with stereotactic-EEG (SEEG) targeting multiple brain regions including the nodules as shown in Figure 5. The nodules with abnormal signals shown by MRF analysis were consistent with the interictal SEEG findings and ictal onset of a typical seizure. Electrical stimulation of the electrodes in these nodules (L6 and L7) produced habitual auras in this patient. The patient is scheduled to undergo laser ablation of the epileptic nodules.
Conclusions
MR fingerprinting is potentially significant for epilepsy patients, for the identification of otherwise inconspicuous epileptogenic lesions using quantitative T1, T2 and PV maps. Here we demonstrated two cases where MRF was able to demonstrate potentially important information that was unavailable in a conventional clinical protocol. Therefore, we believe that the tissue-specific fingerprints of epileptic and normal brain structures from this method may assist epilepsy surgery planning.Acknowledgements
The authors would like to acknowledge funding from Siemens Healthcare and NIH grants NIH 1R01EB016728 and NIH 5R01EB017219References
1. Ma D, Jiang Y, Chen Y, McGivney D, Mehta B, Gulani V, Griswold M. Fast 3D magnetic resonance fingerprinting for a whole-brain coverage. Magn. Reson. Med. [Internet] 2017;0:1–8. doi: 10.1002/mrm.26886.
2. Ma D, Pierre EY, McGivney DF, Mehta B, Chen Y, Jiang Y, Griswold MA. Applications of low rank modeling to fast 3D MRF. Proc. Intl. Soc. Mag. Reson. Med. 25 2017.
3. Deshmane A, McGivney D, Badve C, Gulani V, Griswold M. Dictionary approach to partial volume estimation with MR Fingerprinting: validation and application to brain tumor segmentation. In: Proc. Intl. Soc. Mag. Reson. Med. 25 (2017). ; 2017. p. 132.
4. Mcgivney D, Deshmane A, Jiang Y, Ma D, Griswold M. A Bayesian Approach to the Partial Volume Problem in Magnetic Resonance Fingerprinting. Magn.Reson.Med, In press.
5. Huppertz HJ, Wellmer J, Staack AM, Altenmüller DM, Urbach H, Kröll J. Voxel-based 3D MRI analysis helps to detect subtle forms of subcortical band heterotopia. Epilepsia 2008;49:772–785. doi: 10.1111/j.1528-1167.2007.01436.x.
Figures