0313
FLAWS imaging improves depiction of the thalamic subregions for DBS planning in epileptic patientsElise Bannier1,2, Giulio Gambarota3,4, Jean-Christophe Ferré1,2, Tobias Kober5,6,7, Anca Nica8, Stephan Chabardes9, and Claire Haegelen3,4,10
1Radiology, University Hospital of Rennes, Rennes, France, 2VISAGES ERL U-1228, Univ Rennes, Inria, CNRS, Inserm, IRISA UMR 6074, Rennes, France, 3LTSI, Université de Rennes 1, Rennes, France, 4U1099, INSERM, Rennes, France, 5Advanced Clinical Imaging Technology, Siemens Healthcare AG, Lausanne, Switzerland, 6Radiology, University Hospital Lausanne (CHUV), Lausanne, Switzerland, 7Signal Processing Laboratory, Ecole Polytechnique Fédérale de Lausanne, Lausanne, Switzerland, 8Neurology, University Hospital of Rennes, Rennes, France, 9Neurosurgery, University Hospital of Grenoble, Grenoble, France, 10Neurosurgery, University Hospital of Rennes, Rennes, France
Synopsis
Accurate localization of the thalamic subregions is of paramount importance for Deep Brain Stimulation (DBS) planning. Current MRI protocols use T2 and Gadolinium-enhanced T1 images, to visualize both the basal ganglia and the vessels, in order to define the electrode trajectory and target. This study shows the usefulness of Fluid and White Matter Suppression, i.e. FLAWS imaging, in eleven drug-resistant epileptic patients for preoperative Deep Brain Stimulation planning and anterior thalamic nucleus targeting.
Introduction
Material & Methods
After approval from the IRB, eleven drug-resistant epileptic patients referred for DBS surgery as part of a national study were scanned at 3T (MAGNETOM Verio, Siemens Healthcare, Erlangen, Germany) with the M2PRAGE prototype sequence adapted for 3D FLAWS imaging (TR/TE=5000/2.68ms, TI1/TI2=409/1300ms, alpha1/alpha2=5/5°, voxel size 1mm3, acquisition time 11min). 3D Gadolinium enhanced T1 imaging was also performed for vessel visualization (TR/TE/TI=1900/2.26/900ms, voxel size 1mm3, acquisition time 4min30s). The division image of the two FLAWS images was also computed. Brain/tissue contrast and contrast-to-noise values were measured with FGATIR-like (FLAWS1) and MPRAGE-like (FLAWS2) images. Regions of interest were drawn using ImageJ (1.46r)5 in the corpus callosum (splenium) for WM, caudate nucleus (head) for GM, and ventricles for CSF. Contrast-to-noise was computed as described in 2. Before DBS surgery, the 3D datasets were fed into in the PyDBS pipeline6 allowing registration to an atlas of the basal ganglia, fusion and 3D visualization for preoperative planning of electrode trajectories.Results
Example images for FLAWS1, FLAWS2 and division image are shown in Figure 1 and a zoomed excerpt is shown in Figure 2. Contrast-to-noise values obtained for FLAWS1 and FLAWS2 images in patients are reported in Figure 3. The values obtained in the original study in healthy subjects are also reported for comparison. The FLAWS images were used in the PyDBS pipeline and the basal ganglia atlas was registered with the FLAWS data as shown in Figure 4, here on the division image.Discussion
Conclusion
The objective to use FLAWS data was to better visualize the thalamic nuclei, especially the ATN to treat epilepsy. Excellent depiction of the thalamic subregions and the ATN on FLAWS images was reported by the neurosurgeon. This qualitative assessment was confirmed by tissue contrast and contrast-to-noise values, which were in agreement with the values reported in the original study in healthy subjects. The FLAWS images could smoothly be used in the PyDBS pipeline for the neurosurgeon to visualize the basal ganglia delineation extraction from the atlas, superimposed on FLAWS data. The visualization of thalamus subregions allowed confident definition of target and electrode trajectory before surgery. Postoperative results on reduction of seizure frequency need to be evaluated at a few years distance and are not available yet.Acknowledgements
MRI data acquisition was supported by the Neurinfo MRI research facility from the University of Rennes I. Neurinfo is granted by the the European Union (FEDER), the French State, the Brittany Council, Rennes Metropole, Inria, Inserm and the University Hospital of Rennes.References
1. Salanova V, Witt T, Worth R, et al. For the SANTE study Group. Long-term efficacy and safety of thalamic stimulation for drug-resistant partial epilepsy. Neurology. 2015; 84(1017-1025). 2. Tanner M, Gambarota G, Kober T, Krueger G, Erritzoe D, Marques J.P., Newbould R. JMRI. 2012; 35(1063-1070) 3. Marques J.P., Kober T, Krueger G, van der Zwaag W, van de Moortele P-F, Gruetter R. Neuroimage. 2010; 49(1271-1281) 4. Sudhyadhom A, Haq I, Foote K., Okun M, Bova F. Neuroimage. 2009; 47 (T44-T52) 5. Rasband, W.S., ImageJ, U. S. National Institutes of Health, Bethesda, Maryland, USA, https://imagej.nih.gov/ij/, 1997-2016. 6. D'albis T, Haegelen C, Essert C, Fernandez-Vidal S, Lalys F, Jannin P. Int J Cars. 2015; 10(117-128) 7. Rasouli J, Ramdhani R, Panov F, Dimov A, Zhang Y, Cho C, Wang Y, Kopell B. Operative Neurosurgery. 2017.Figures
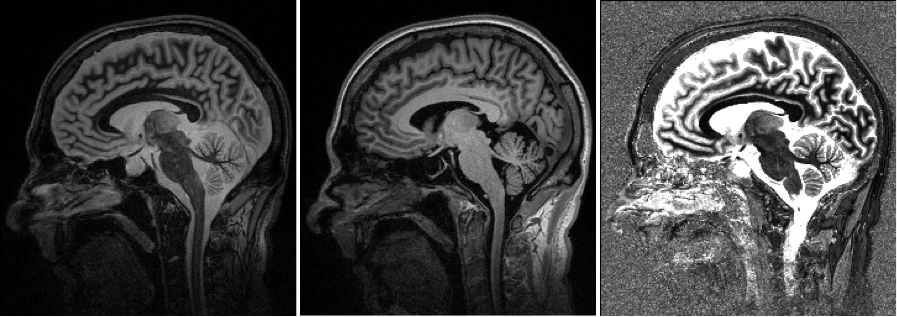
Example images for FLAWS1 (FGATIR-like), FLAWS2 (MPRAGE-like)
and division contrasts
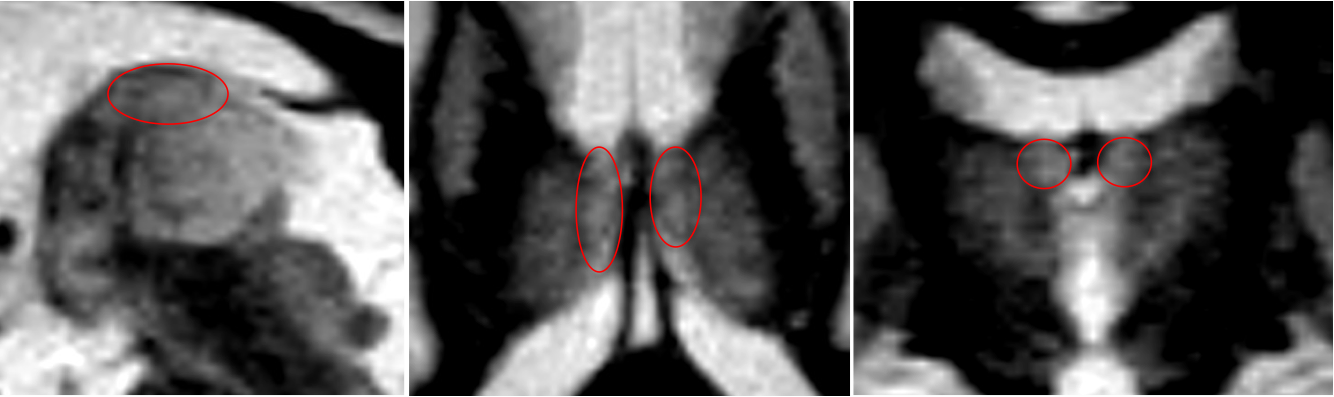
Zoom
on the anterior thalamic nucleus on FLAWS1
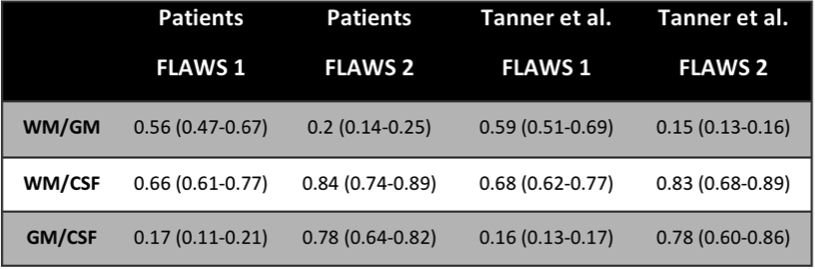
Contrast-to-noise values
obtained for FLAWS1 and FLAWS2 images in patients (present study). Values
obtained in the original study (Tanner et al.) in healthy subjects are reported for
comparison.
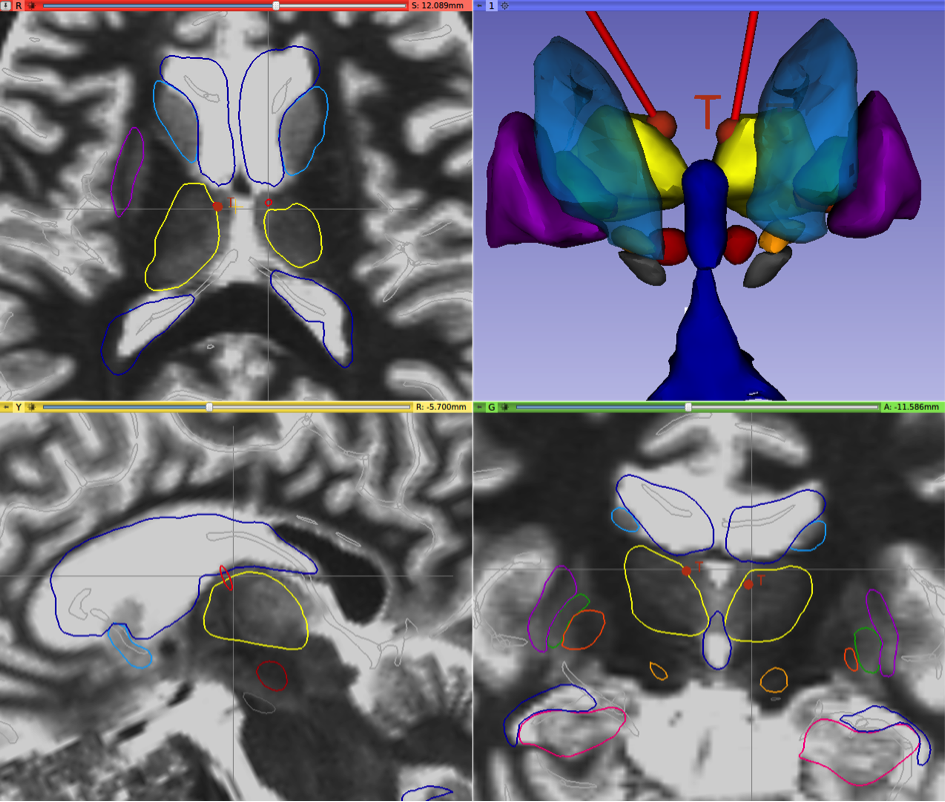
PyDBS atlas superimposed on
FLAWS division images showing amygdala (pink); caudate nucleus (light blue);
hippocampus (dark pink); lateral pallidum (green); lateral, third and fourth
ventricles (dark blue); medial pallidum (dark orange); putamen (dark purple);
red nucleus (red); subthalamic nucleus (light orange); substantia nigra (gray);
thalamus (yellow). Red lines represent the bilateral electrode trajectory.