0310
Improving Perfusion Image Quality and Quantification Accuracy Using Multi-contrast MRI and Deep Convolutional Neural Networks1Radiology, Stanford University, Stanford, CA, United States, 2Electrical Engineering, Stanford University, Stanford, CA, United States, 3Global Applied Science Lab, GE Healthcare, Menlo Park, CA, United States
Synopsis
We propose a novel method that uses deep convolutional neural networks (dCNNs) to combine multiple contrasts from MRI, including single- and multi-delay pseudo-continuous arterial spin labeling (PCASL) and structural scans, to synthesize perfusion maps that approach the accuracy of the PET perfusion measurements. The dCNN was trained and tested on both healthy and patient datasets, and demonstrated significant improvement on both image quality (higher structural similarity and lower normalized root mean square error) and quantification accuracy (regional CBF comparable with PET) than either ASL method alone. This method may potentially be generalized to other qualitative/quantitative applications.
Introduction
Arterial spin labeling (ASL) is a completely non-invasive MRI method for quantitative perfusion imaging1. But its signal-to-noise ratio (SNR) is low and it is sensitive to transit delay effects with conventional labeling. 15O-water Positron Emission Tomography (PET) is the reference standard for quantitative cerebral blood flow (CBF) imaging and has high SNR. In this study, we propose a novel method to improve image quality and quantification accuracy in ASL perfusion measurements, using multi-contrast information from MRI and deep learning, with 15O-water PET CBF measurements as the ground truth.Methods
Image acquisition and data preprocessing: Simultaneous PET/ASL perfusion measurements were acquired from 28 subjects (15 healthy controls (HC), 13 patients (PT) including 10 with Moyamoya disease, 3 with steno-occlusive disease of the carotid arteries) on a time-of-flight enabled PET/MRI system (SIGNA, GE Healthcare, Milwaukee). The protocol was approved by the local IRB committee. It included two measurements at baseline, and one after injection of vasodilator (Diamox).
Quantitative PET CBF maps were reconstructed with an atlas-based attenuation correction, an image-derived arterial input function2 and the Zhou one-tissue compartment model3 in the PMOD software. ASL scans included a single-delay (1-d.) pseudo-continuous ASL (PCASL) with labeling duration (LD) = 1.45 s and post-labeling delay (PLD) = 2.025 s, and a 5-delay (5-d.) PCASL with LD = 2 s and PLD = 0.7, 1.275, 1.85, 2.425 and 3 s. T1w 3D structural and T2w FLAIR images were also acquired. All PET/MRI images were co-registered, normalized to a MNI template and brain-masked.
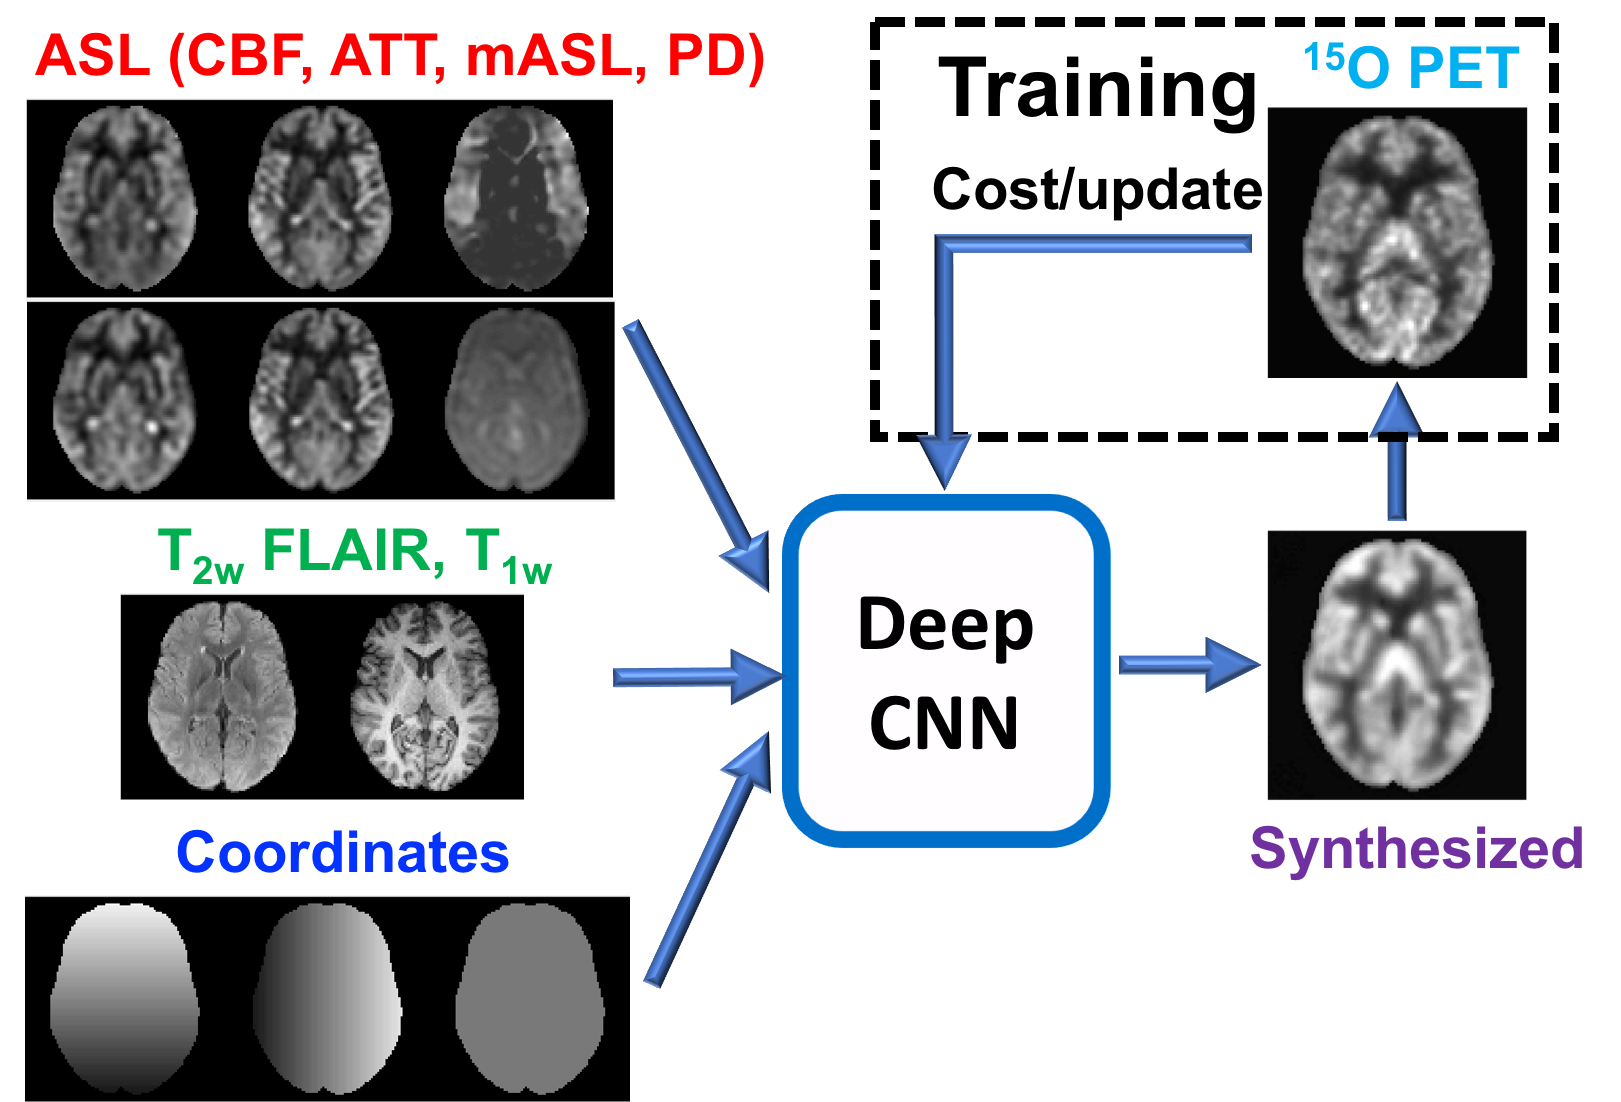
Deep convolutional neural network (dCNN): A U-Net encoder-decoder dCNN was constructed with skip connections between encoder-decoder layers and a residual connection at the central layer4,5. The input to the dCNN was images from ASL scans (including CBF from both 1-d and 5-d scans, arterial transit time, ASL signal at each delay, mean ASL signal, PD reference), structural scans (T1w and T2w FLAIR), and the pixel coordinate information (Figure 1). The output of the dCNN was synthesized CBF maps. In training, the synthesized CBF maps were compared with the reference PET images to minimize the mean absolute error cost and update the parameters of the network. In testing, the input MR images directly pass through the dCNN to produce synthesized CBF maps (Figure 1).
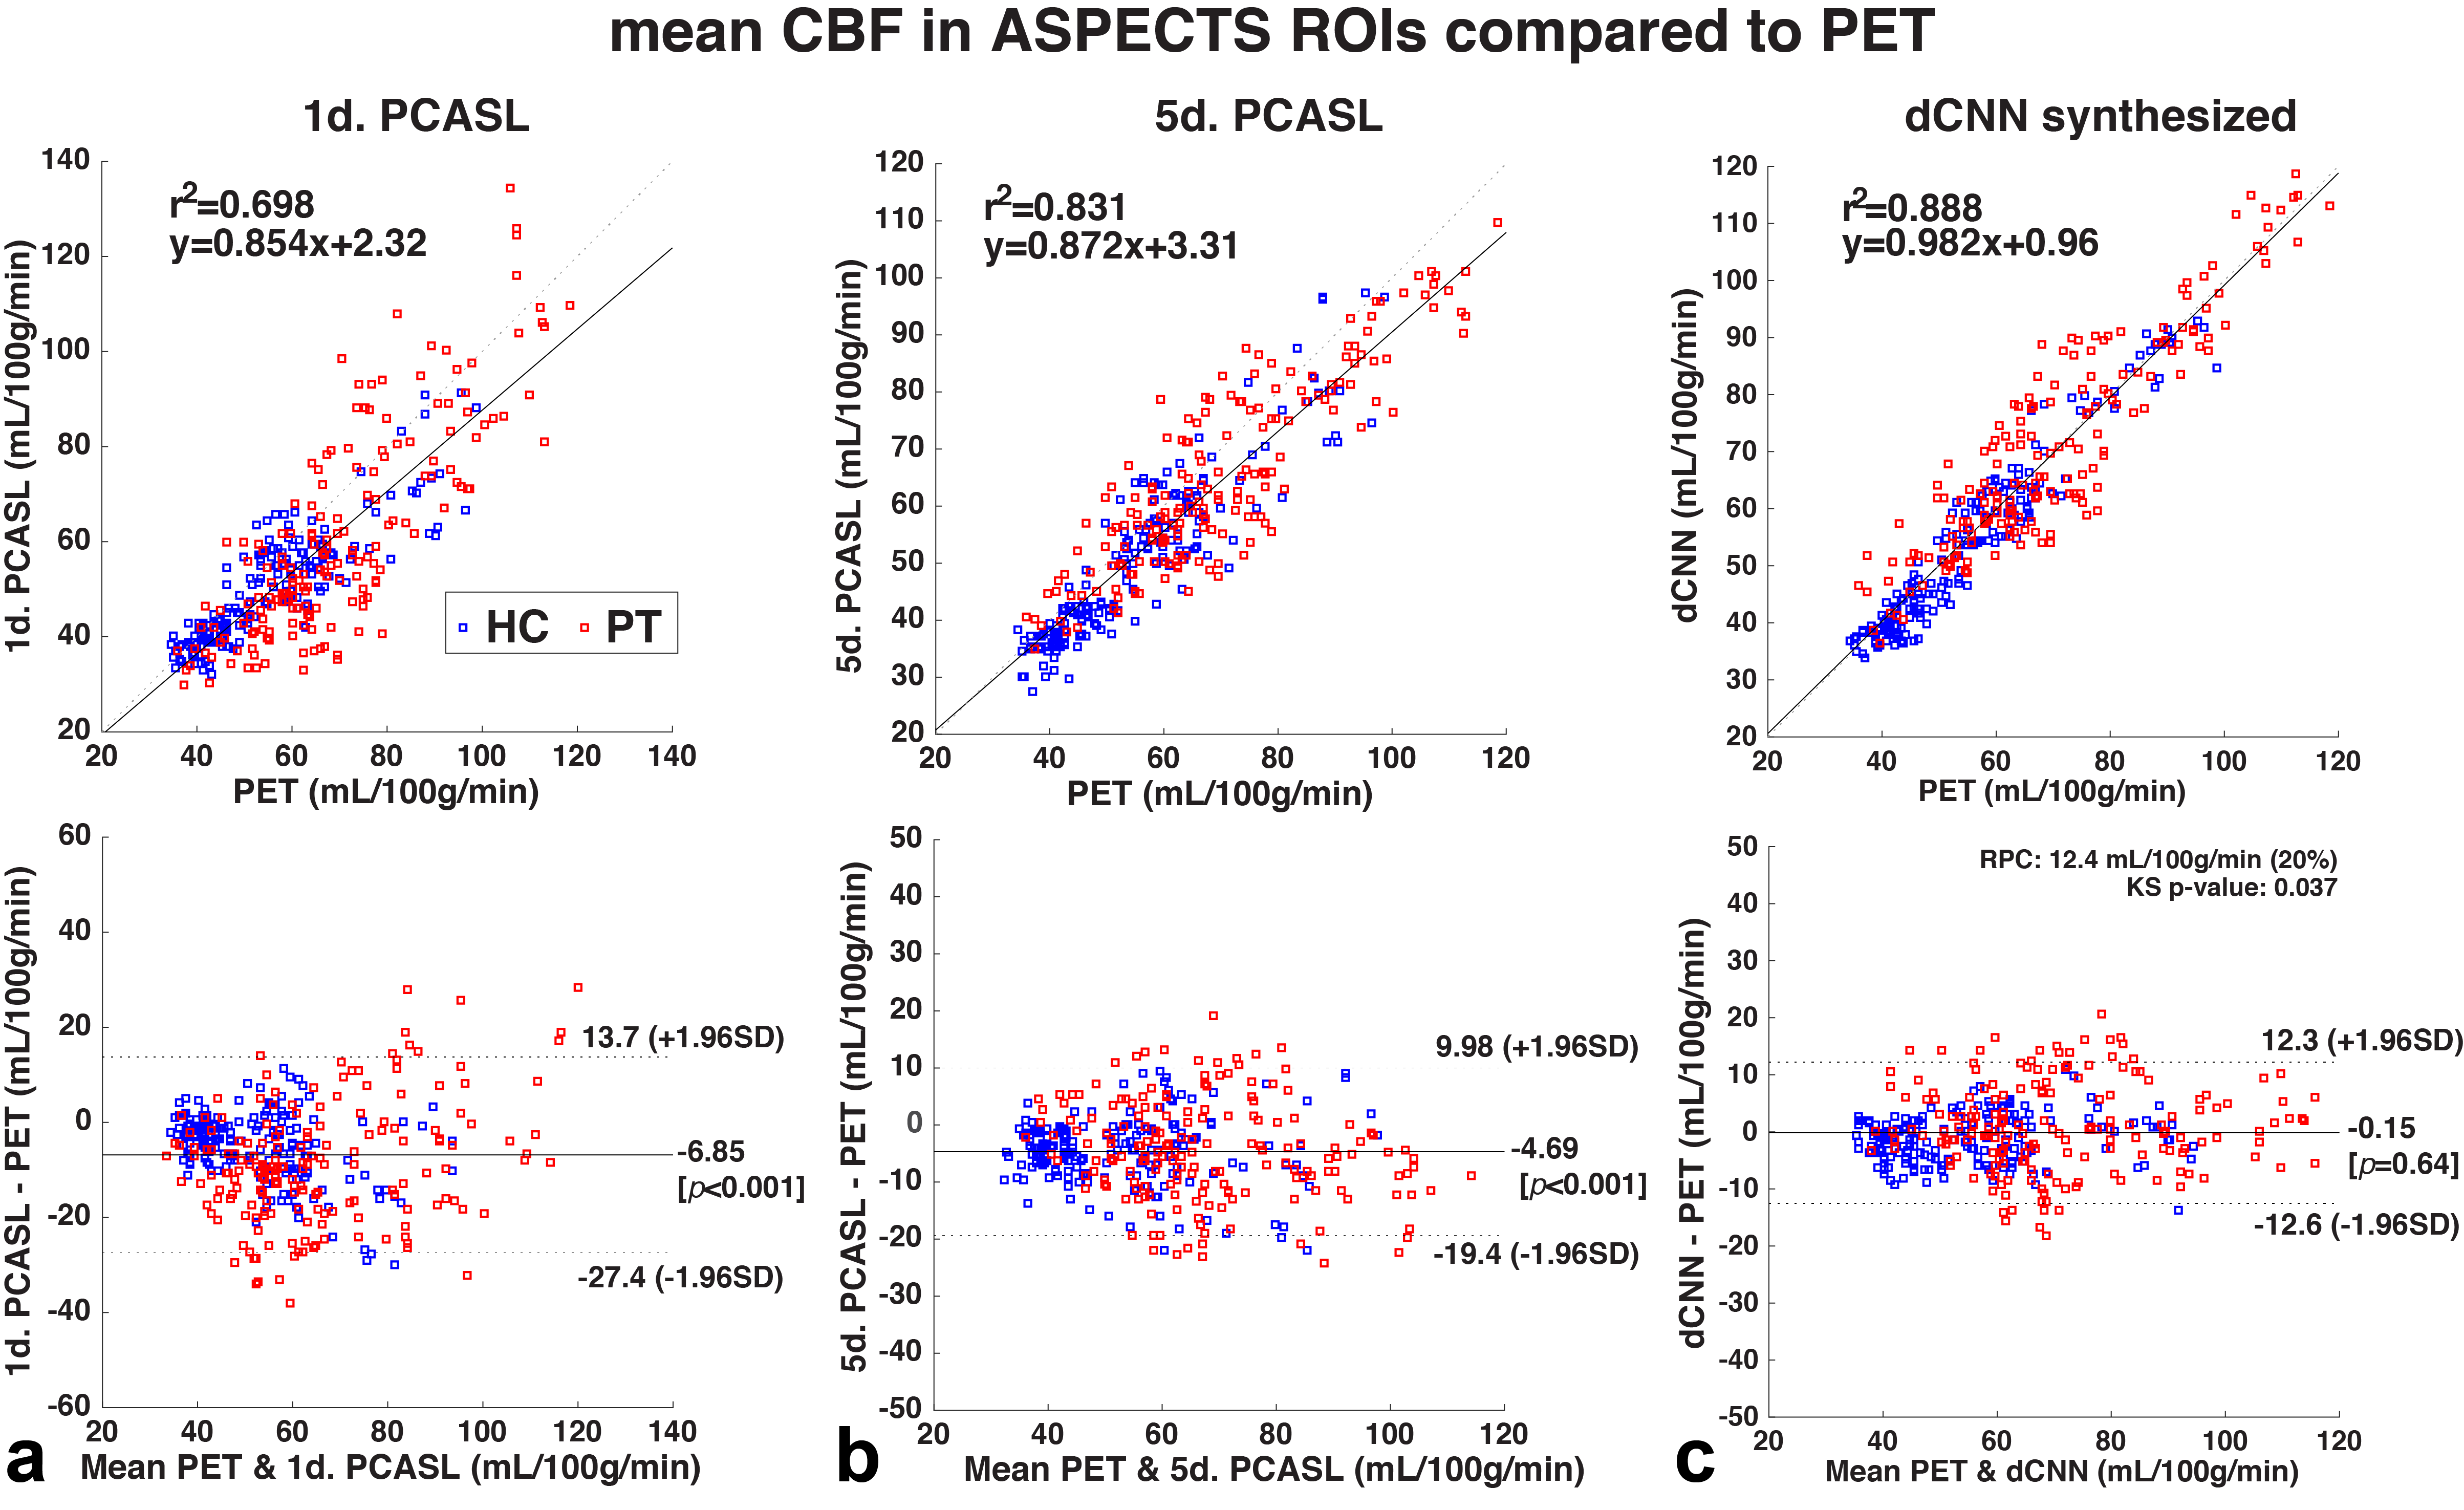
Model training and testing: A total of 78 PET/MRI datasets were included in this study. 60 datasets (from 12 HC and 10 PT) were used in training, 10% of which were used in validation. The training datasets were augmented by flipping and transpose in plane. The dCNN model was then tested on the remaining 18 whole brain datasets (3 datasets from each of 3 HC and 3 PT that were not used in the training) to generate synthesized CBF maps and compared with PET reference images. Image quality metrics (structural similarity, SSIM, and normalized root mean square error, NRMSE) were evaluated. Mean CBF was calculated in 20 regions of interest (ROIs) derived from ASPECTS6.
Results
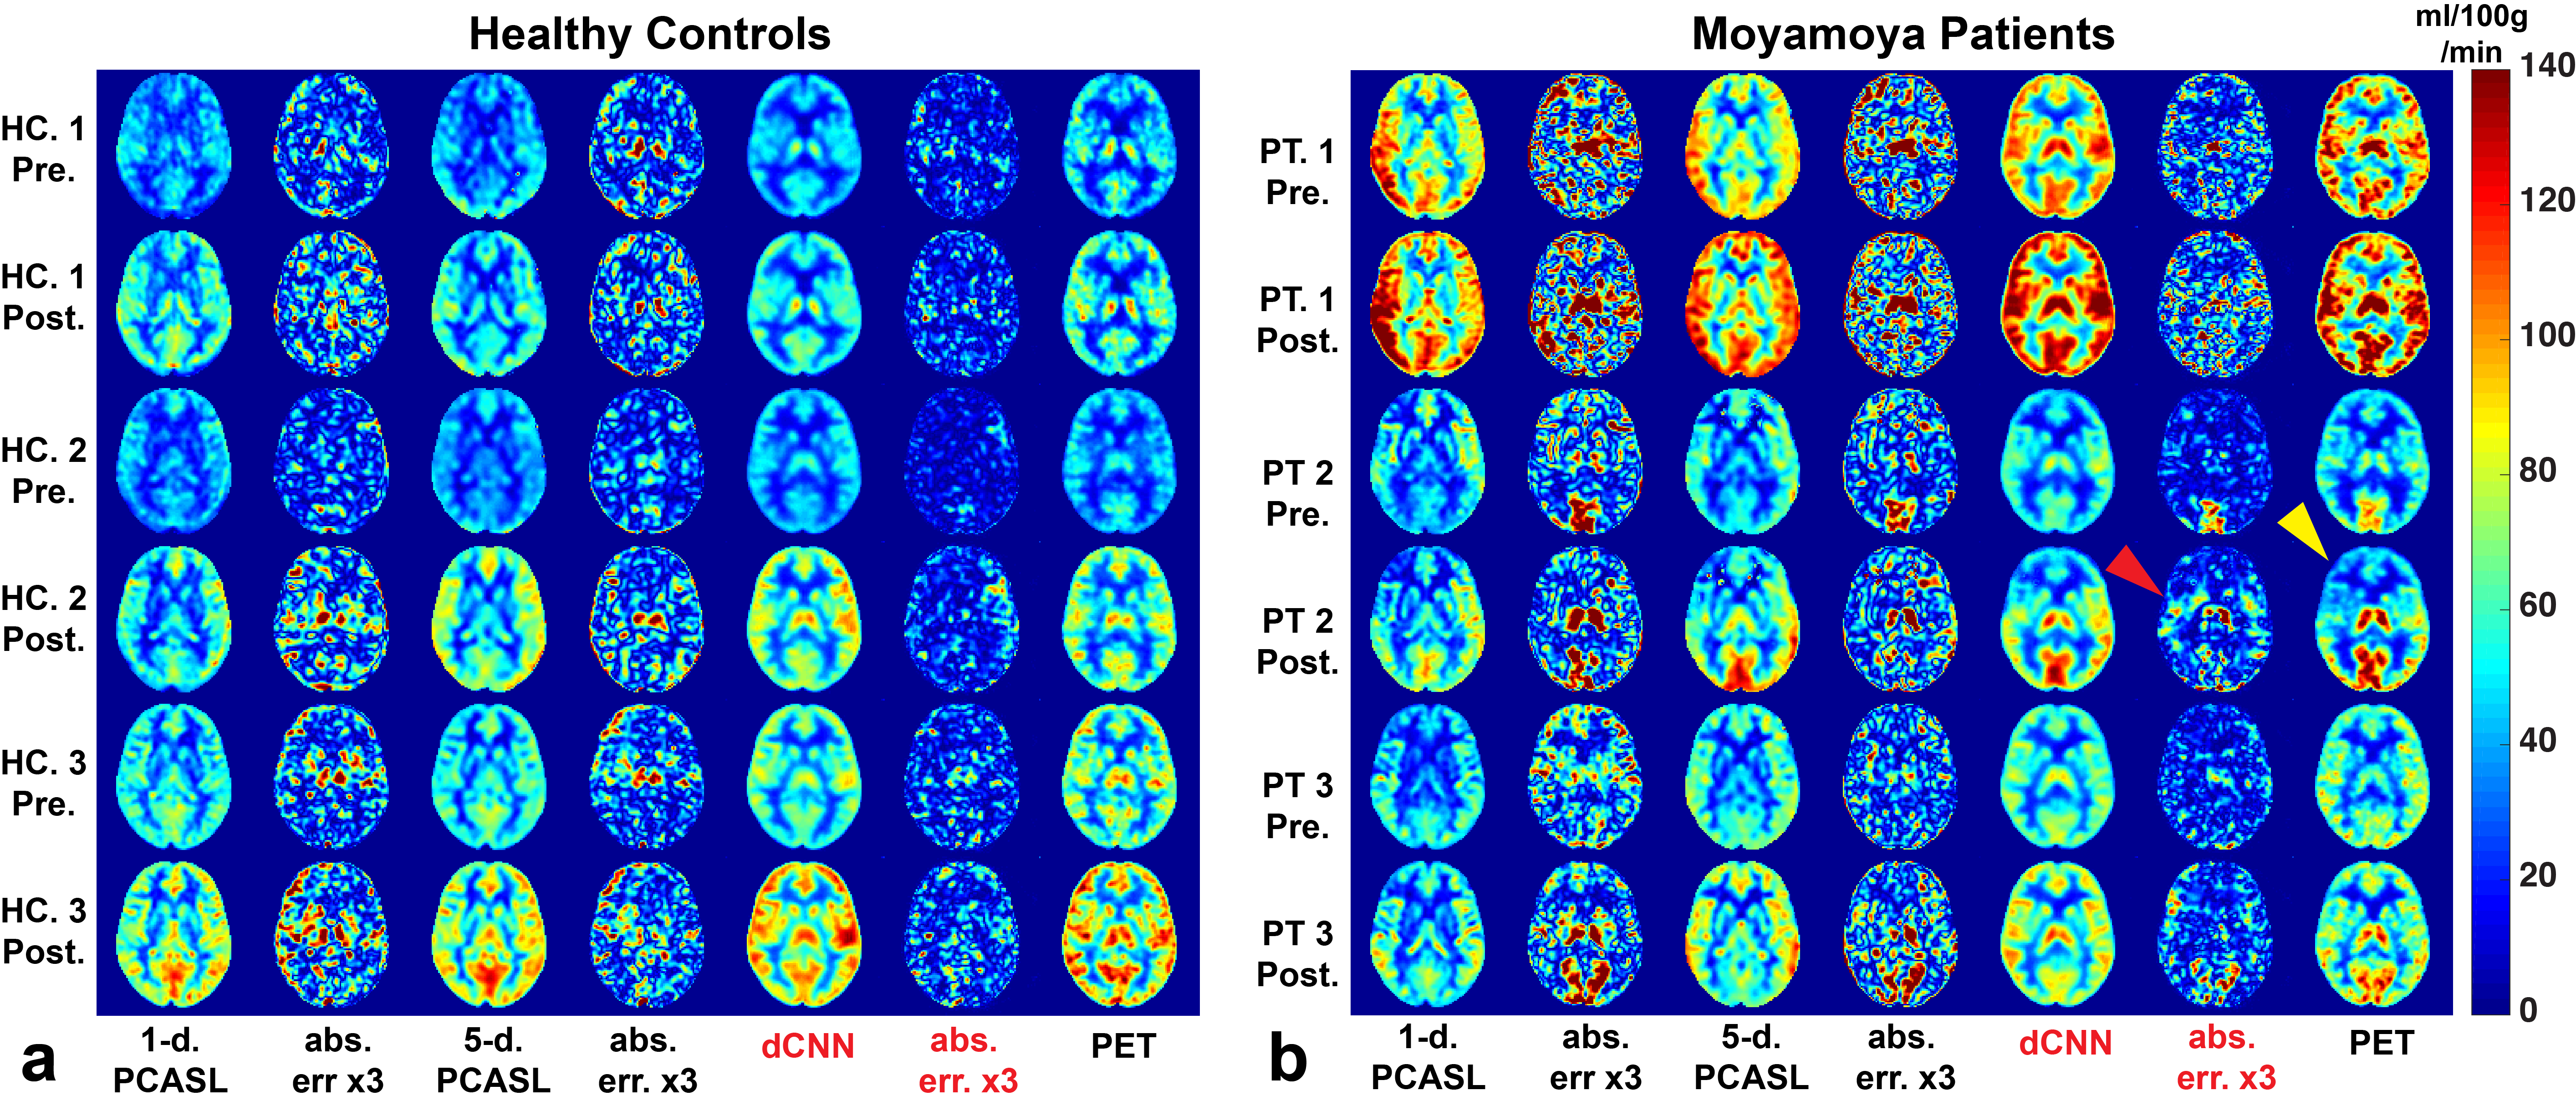
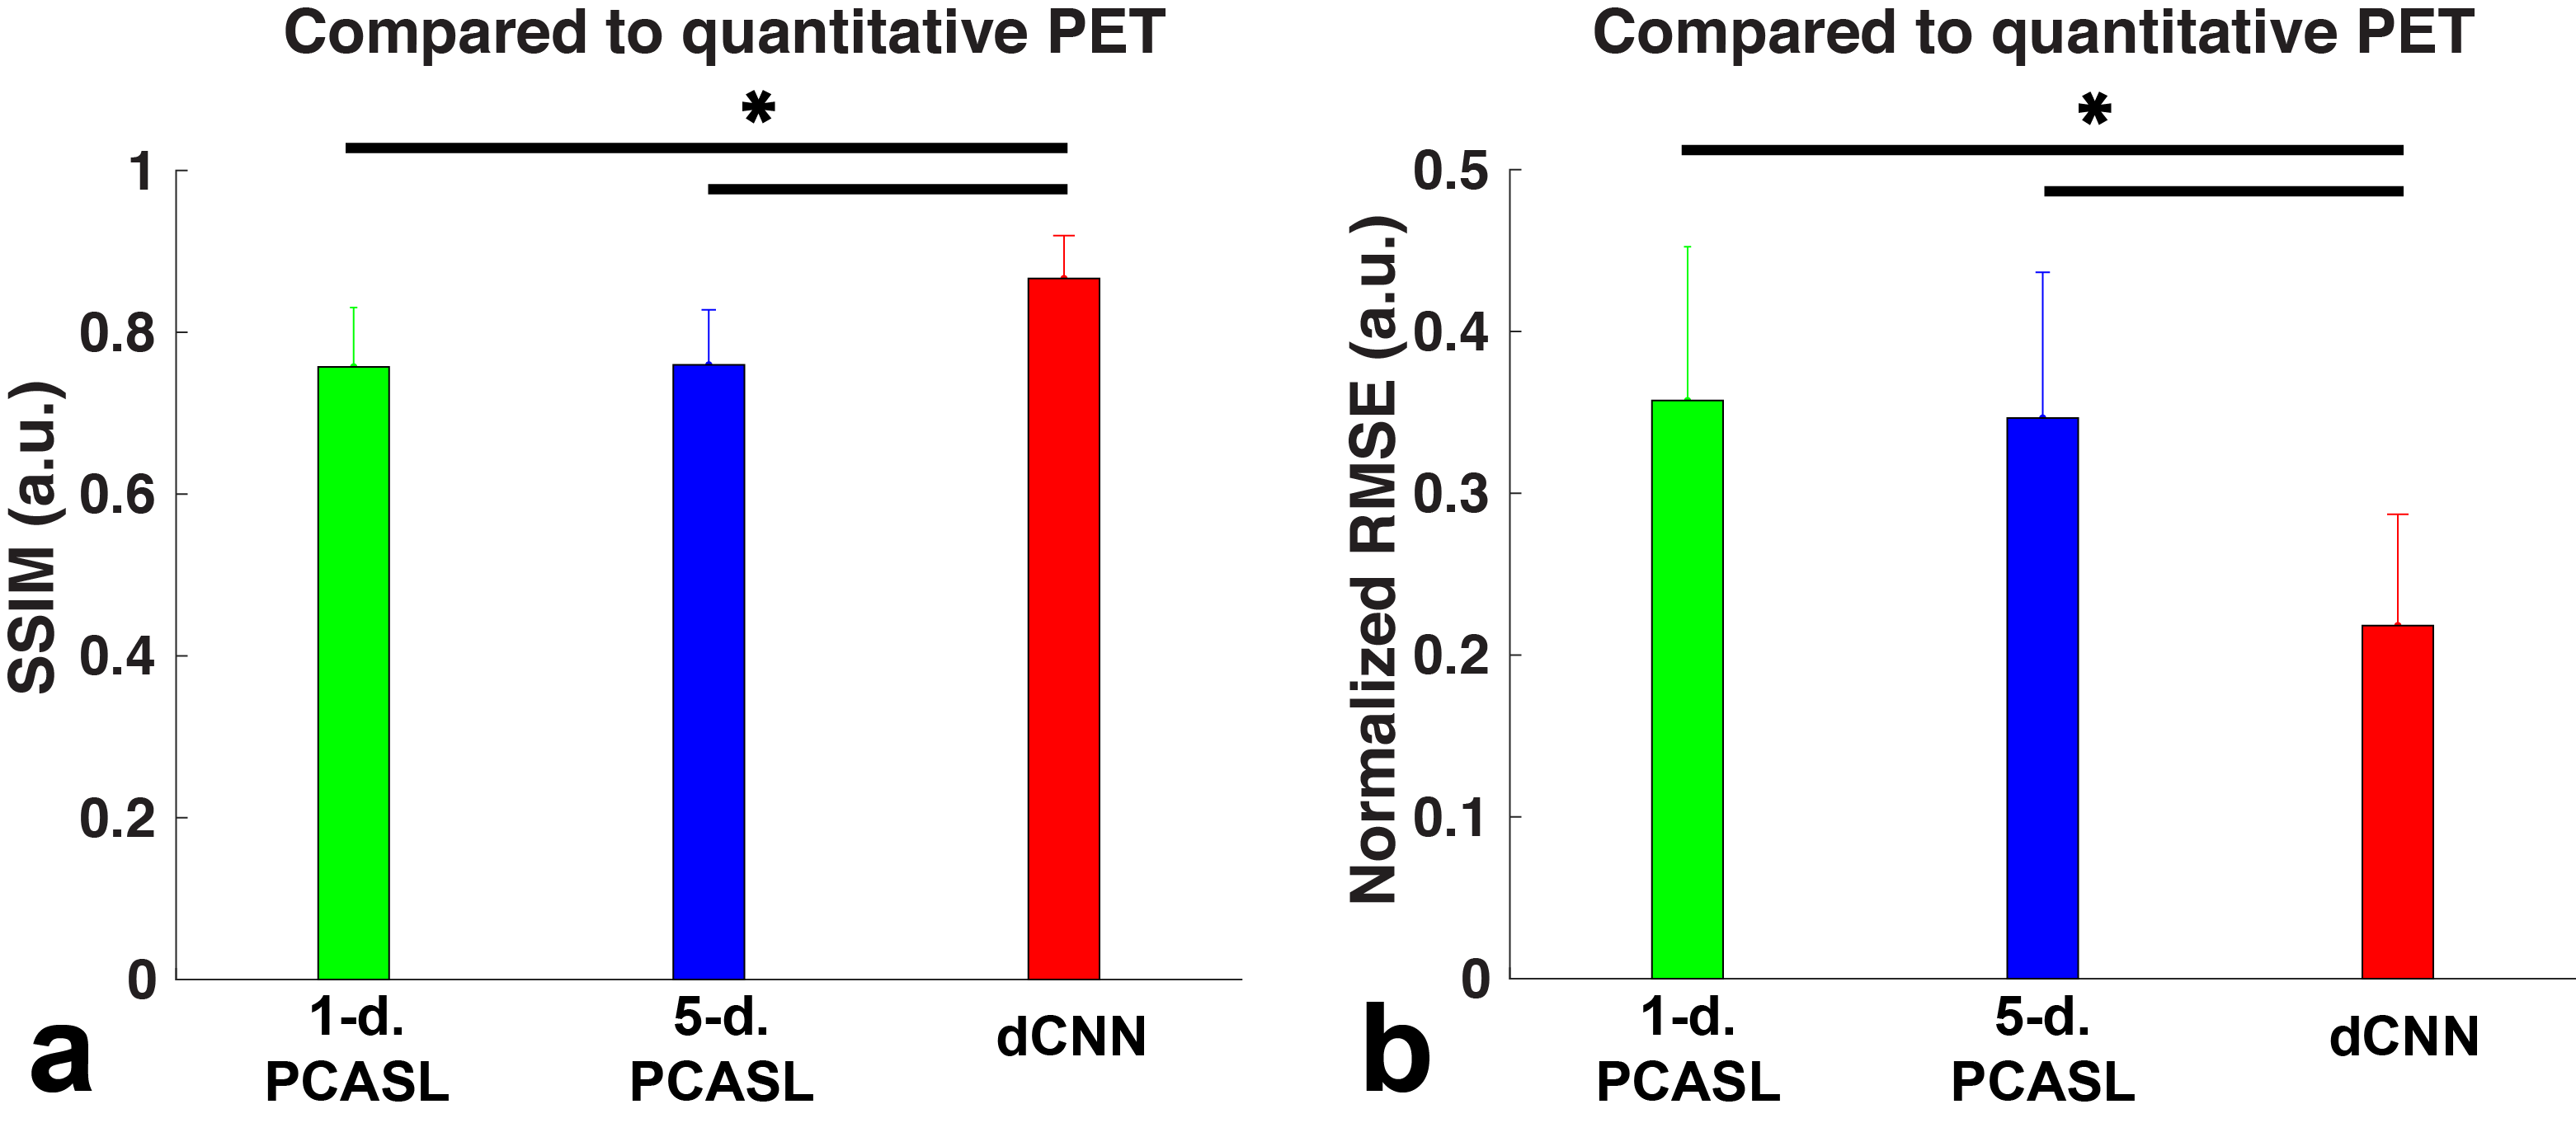
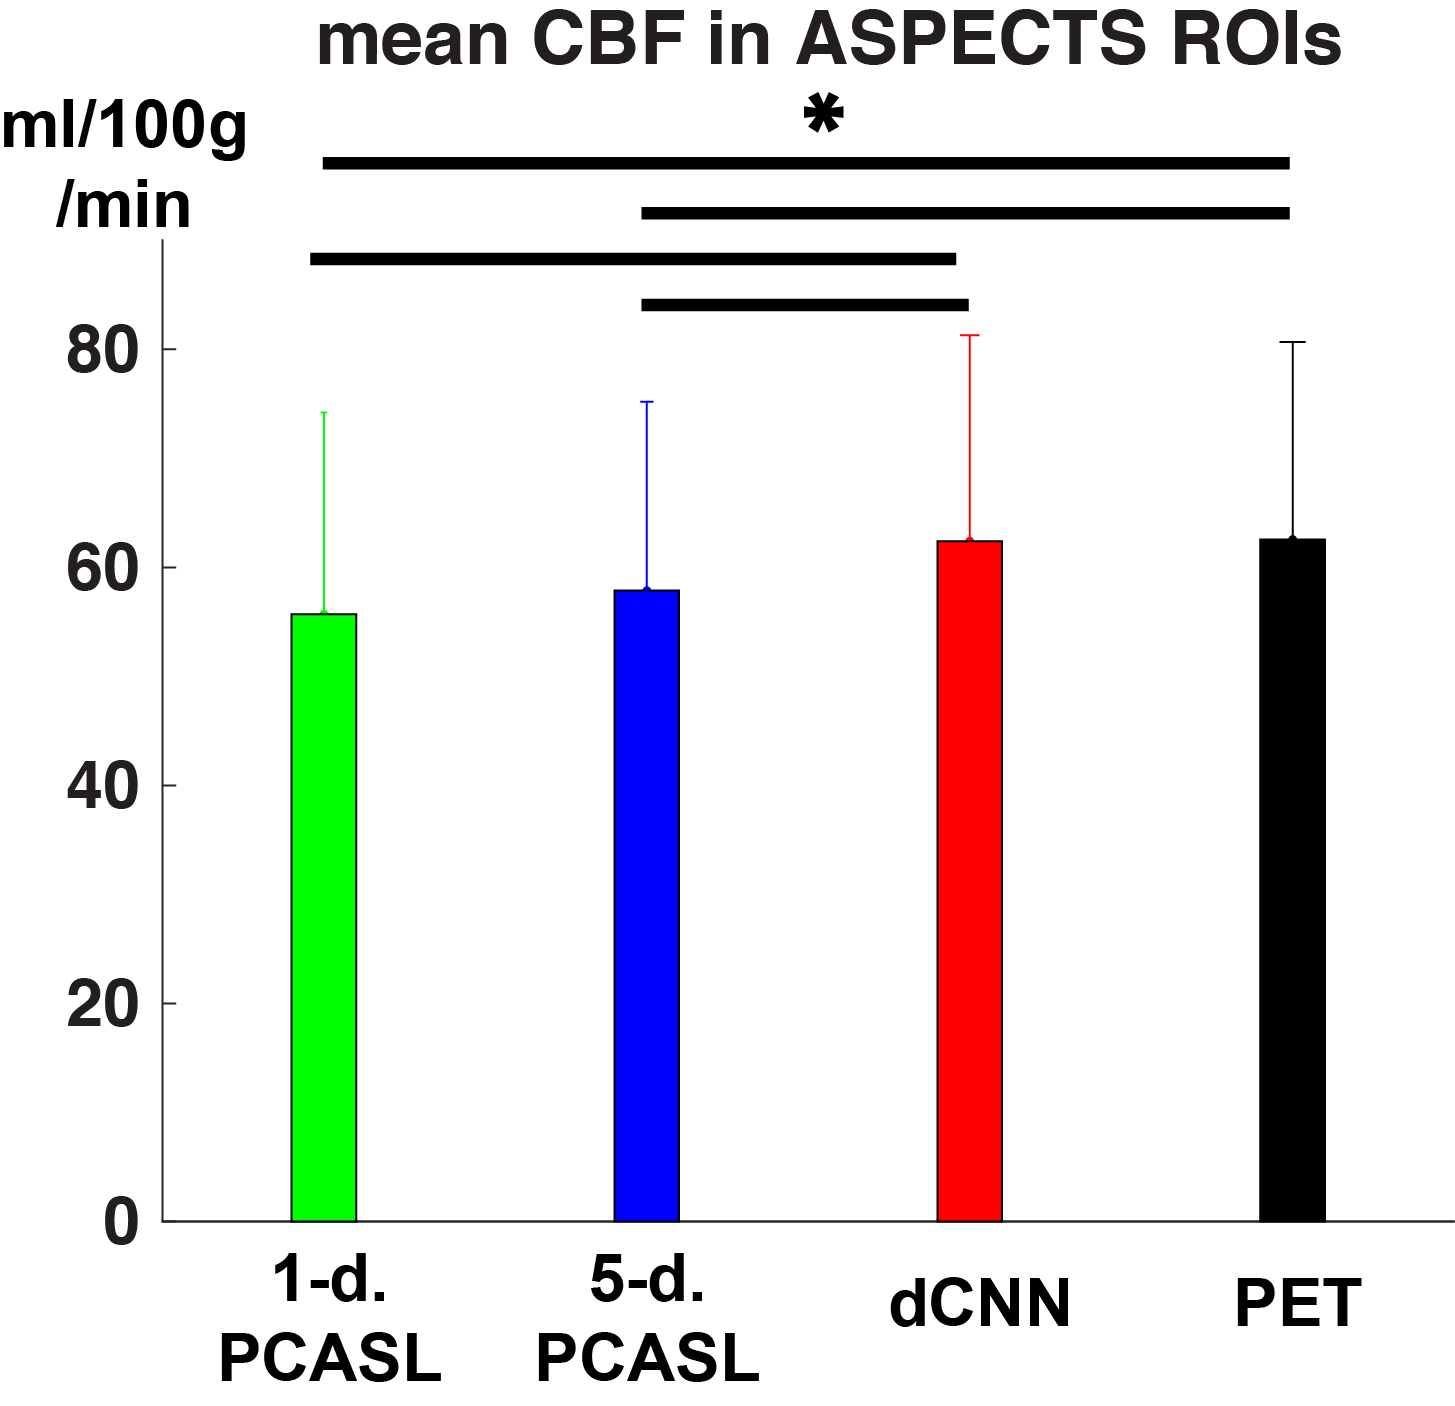
Example CBF maps and the mean image quality metrics are shown in Figures 2 and 3. Compared to PET CBF maps, dCNN significantly improved image quality with higher SSIM (0.866±0.053 vs. 0.757±0.073 with 1-d. and 0.760±0.068 with 5-d., p<3.9×10⁻¹⁰) and lower NRMSE ( 0.218±0.069 vs. 0.357±0.095 with 1-d. and 0.347±0.090 with 5-d., p<1.7×10⁻⁹). Quantitatively, dCNN yielded similar ROI CBF values compared to PET (62.4±18.9 vs. 62.6±18.1 ml/100g/min, p=0.64); while 1-d. and 5-d. PCASL significantly underestimated CBF (55.7±18.5 ml/100g/min, p=1.7×10⁻²⁹ and 57.9±17.3 ml/100g/min, p=1.0×10⁻²⁷, respectively), as shown in Figures 4 and 5 (bottom). Mean ROI CBF values generated by dCNN also showed improved correlation with those by PET values (β=0.982, r2=0.888), compared with 1-d. (β=0.854, r2=0.698) and 5-d. (β=0.872, r2=0.831) (Figure 5, top).
Discussion
In addition to more accurate regional CBF estimation from multiple MR contrast, the dCNN also learned some structural deformation to match the structures in PET images, contributing to the improved SSIM and NRMSE metrics. The discrepancies between the dCNN synthesized and reference PET CBF maps may be further reduced by including more training datasets, and/or ASL scans that are less sensitive to transit delay effects, e.g., PCASL with long LD and long PLD and velocity-selective ASL (VSASL)7. Currently the dCNN model was trained on all the input contrast, which may contain redundant information. An optimized combination can be explored to simplify and generalize the model.Conclusion
This study demonstrated that dCNN is capable of combining multi-contrast information from ASL and structural MRI to synthesize perfusion maps with significantly improved image quality and quantification accuracy, in both healthy and diseased subjects. This method may be generalizable to other quantitative/qualitative applications.Acknowledgements
NIH 5R01NS066506, NCRR 5P41RR09784, and support from GE Healthcare.References
1. Alsop, D. C., et al. (2015). "Recommended implementation of arterial spin-labeled perfusion MRI for clinical applications: A consensus of the ISMRM perfusion study group and the European consortium for ASL in dementia." Magnetic Resonance in Medicine 73(1): 102-116.
2. Khalighi, M. M., et al. (2017). "Image-derived input function estimation on a TOF-enabled PET/MR for cerebral blood flow mapping." Journal of Cerebral Blood Flow and Metabolism: 271678X17691784.
3. Zhou Y, Huang S, Bergsneider M. Linear Ridge Regression with Spatial Constraint for Generation of Parametric Images in Dynamic Positron Emission Tomography Studies. IEEE Tans Nucl Sci. 2001;48(1):125-130.
4. Ronneberger et al. (2015). “U-Net: Convolutional Networks for Biomedical Image Segmentation.” arXiv:1505.04597.
5. Chen et al. (2017). “Low-Dose CT with a Residual Encoder-Decoder Convolutional Neural Network (RED-CNN).” arXiv:1702.00288.
6. Barber, P. A., et al. (2000). "Validity and reliability of a quantitative computed tomography score in predicting outcome of hyperacute stroke before thrombolytic therapy." Lancet 355(9216): 1670-1674.
7. Wong, E. C., et al. (2006). "Velocity-selective arterial spin labeling." Magnetic Resonance in Medicine 55(6): 1334-1341.
Figures